How to | Plot Parametric Functions
The Wolfram Language can plot parametric functions in both two and three dimensions. Use a parametric plot when you can express the ![]() and
and ![]() or
or ![]() ,
, ![]() , and
, and ![]() coordinates at each point on your curve as a function of one or more parameters.
coordinates at each point on your curve as a function of one or more parameters.
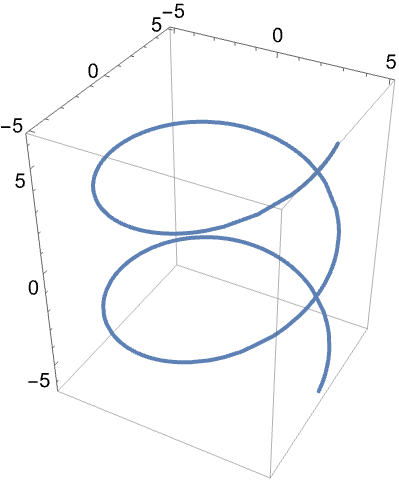
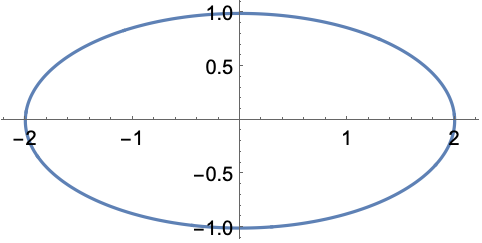
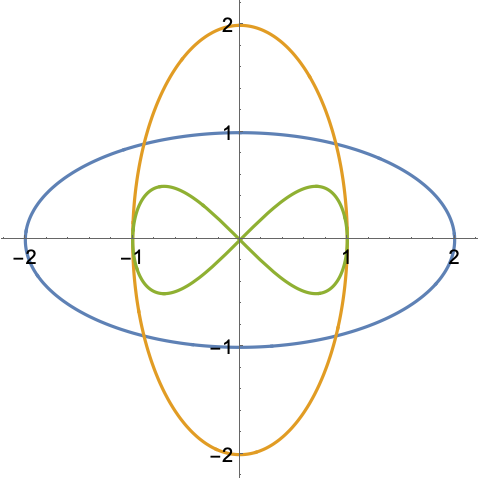
Plot the parametric curve ![]() where the parameter
where the parameter ![]() varies from
varies from ![]() to
to ![]() :
:
In[1]:=1
✖
https://wolfram.com/xid/0k2pd80m337laft8nokqpoz-nyxrnp
Out[1]=1
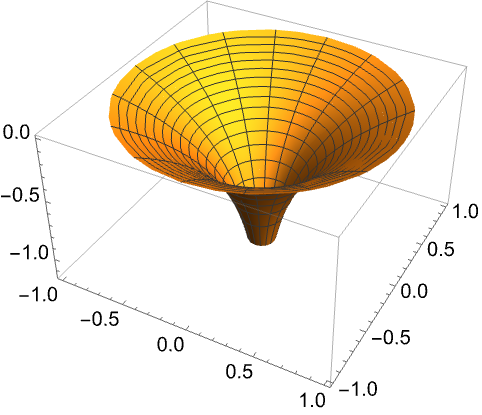
Use ParametricPlot3D to plot the surface defined by ![]() :
:
In[1]:=1
✖
https://wolfram.com/xid/0k2pd80m337laft8nokqpoz-v8wd3s
Out[1]=1