


Callout
Details and Options
- Callout[data,expr,…] can be used as a wrapper in visualization functions such as Plot, ListPlot, etc.
- Callout[expr,…] can be used in PlotLabels to specify callouts, similar to Placed.
- expr can be any expression, including strings, graphics, and formulas.
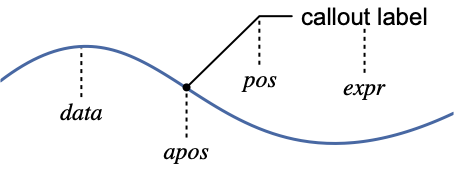
- The callout position pos and anchor positions apos are automatically computed when specific positions are not given.
- Possible callout positions pos vary by function, but typically include:
-
x near the data at a position x {x,y} at a position {x,y} Scaled[s] scaled position s along the data Above,Below,Before,After relative positions {s,Above},{s,Below},… relative position at position s along the data {pos,epos} epos in expr placed at position pos Automatic pos is automatically determined - Possible anchor positions apos include:
-
x near the data at a position x {x,y} at a position {x,y} Scaled[s] scaled position s along the data Automatic apos is automatically determined - Callout takes the following options:
-
Appearance Automatic overall style of the callout Background Automatic style of the label background CalloutMarker None marker to use for the anchor position apos CalloutStyle Automatic style to use for strokes and knockouts Frame Automatic frame of the label box FrameMargins Automatic margins to leave inside the frame LabelStyle {} style to use for the label LabelVisibility Automatic priority relative to other labels LeaderSize Automatic length and angle to use for the leader RoundingRadius 0 radius for rounded corners - Possible values for Appearance:
-

"Leader" a leader is used from label to data 
"CurvedLeader" a curved leader 
"SlantedLabel" an angled label and neck 
"Frame" full frame around expr 
"Line" a partial frame around expr 
"Corners" frame corners around expr 
"Balloon" a balloon around expr 
"LineBalloon" a partial balloon around expr 
None no leader is drawn - Possible settings for CalloutMarker are:
-
None no marker is used "name" use named marker Arrowheads[…] arrowhead specification g expression g - The named markers "name" are:
-

"CirclePoint","Circle" circular markers 
"BoxPoint", "Box" square markers 
"Star", "OpenStar" star markers 
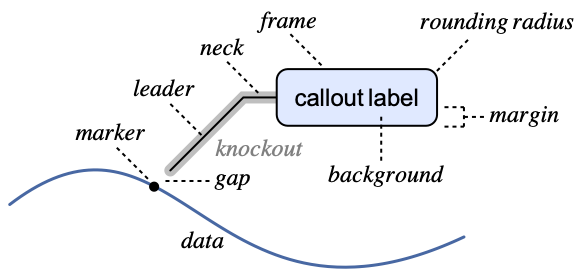
"Arrow", "OpenArrow" arrow markers - CalloutStyle specifies the style to be used for the marker, leader, neck, and frame. The marker, leader, and neck typically have the space around them padded with the ambient background color to increase visibility.
- Possible values for CalloutStyle are:
-
Automatic default style is used sty use style sty, with the default knockout style {sty,kosty} use kosty for the knockout style - Possible values for LeaderSize:
-
Automatic automatic leader size lr length of the leader {lr,lθ,s} leader length lr at angle lθ and the gap s to the anchor {{lr,lθ,s},{nr,nθ}} leader specification with neck length nr at angle nθ
Examples
open all close allBasic Examples (4)
ListPlot[Table[Callout[i, i], {i, 1, 5}]]Use a named position for the callout:
ListPlot[{16, 35, 39, Callout[44, "label", Below], 61, 74, 84, 86, 97, 100}]Plot[{Sin[x], Callout[Cos[x], "label"]}, {x, 0, 2π}]Use a named position relative to the curve for the callout:
Plot[{Callout[Log[x]Sin[x], "max", Above], Log[x]Cos[x]}, {x, 0, 2π}]Plot[Callout[Log[x]Sin[x], "min", Bottom, LabelStyle -> Directive[Bold, Italic], Background -> StandardBlue, FrameMargins -> 7], {x, 0, 2π}]Scope (15)
Label Placement (8)
Callouts are placed near individual points:
ListPlot[Table[Callout[Fibonacci[n], Fibonacci[n]], {n, 10}]]Callouts are automatically placed at the ends of curves:
Plot[{Callout[Sin[x], "sine"], Callout[Cos[x], "cosine"]}, {x, 0, 10}]Place callouts relative to the points:
Table[ListPlot[Table[Callout[Fibonacci[n], Fibonacci[n], p], {n, 10}], Frame -> True], {p, {Above, Below, Before, After}}]Table[Plot[Callout[Sinc[x], "label", p], {x, -10, 10}, Frame -> True, BaselinePosition -> Bottom], {p, {Above, Below}}]Place labels near an absolute position on a curve:
Plot[Callout[Sinc[x], "label", 7], {x, 0, 10}]Place labels near a scaled position on a curve:
Plot[Callout[Sinc[x], "label", Scaled[0.75]], {x, 0, 10}]Place labels above the curve near the given positions:
Plot[Callout[Sinc[x], "label", {3, Above}], {x, 0, 10}]Plot[Callout[Sinc[x], "label", {Scaled[0.3], Above}], {x, 0, 10}]Place a label at a specific point:
Plot[Callout[Sinc[x], "label", {6, 0.5}], {x, 0, 10}]Specify the position in the label that connects to the leader:
Table[Plot[Callout[Sinc[x], "label", {5Pi / 2, {s, 0.5}}], {x, 0, 10}], {s, {0, 1}}]Anchor Placement (3)
Specify where the leader should point to on the curve with an absolute position:
Table[Plot[Callout[Sinc[x], "label", {5, 0.8}, a], {x, -10, 10}], {a, {2, 8}}]Specify where the leader should point to on the curve with a scaled position:
Table[Plot[Callout[Sinc[x], "label", {5, 0.8}, Scaled[a]], {x, -10, 10}], {a, {0.6, 0.9}}]Specify an exact point the leader should point to:
ListLinePlot[Callout[Table[{t Cos[t], t Sin[t]}, {t, 0, 10, 0.1}], "label", {-3, 3}, {2.5Cos[2.5], 2.5Sin[2.5]}]]Presentation (4)
Plot[Callout[Log[x]Sin[x], "max", Above, Appearance -> "Frame"], {x, 0, 2π}, PlotTheme -> "Minimal"]Plot[Callout[Log[x]Sin[x], "max", Above, Appearance -> "Balloon"], {x, 0, 2π}, PlotTheme -> "Minimal"]Circle the anchor point for the callout on the curve:
Plot[Callout[Log[x]Sin[x], "min", Below, CalloutMarker -> "Circle"], {x, 0, 2π}, PlotTheme -> "Business"]Plot[Callout[Log[x]Sin[x], "min", Below, CalloutMarker -> "Arrow"], {x, 0, 2π}, PlotTheme -> "Business"]Use uniform leader lines for the callouts:
ListPlot[Table[Callout[Prime[n], Prime[n], LeaderSize -> {{12, 135°, 6}, {5, 180°}}], {n, 10}], PlotMarkers -> Automatic, PlotTheme -> "Web"]Style the callouts to match their curves:
Plot[{Callout[Sin[x], Sin[x], Above, Background -> RGBColor[0.790588, 0.201176, 0.], LabelStyle -> GrayLevel[1]], Callout[Cos[x], Cos[x], Below, Background -> RGBColor[0.192157, 0.388235, 0.807843], LabelStyle -> GrayLevel[1], Appearance -> "Balloon"]}, {x, 0, 2Pi}, PlotTheme -> "Web"]Options (17)
Appearance (2)
Use different named appearances:
Table[Plot[Callout[Log[x]Sin[x], "label", Scaled[0.2], Appearance -> a], {x, 0, 10}, PlotLabel -> a], {a, {"Leader", "CurvedLeader", "SlantedLabel", "Frame", "Line", "Corners", "Balloon", "LineBalloon"}}]Combine appearance with other styling:
Plot[{Callout[Log[x]Sin[x], "label", Automatic, 4, Appearance -> "Corners", Background -> StandardGreen, LeaderSize -> {20, 60 °, 5}, CalloutStyle -> {StandardBlue, StandardGreen}], Cos[x]}, {x, 0, 2π}]Background (1)
CalloutMarker (2)
Table[ListLinePlot[Callout[Fibonacci[Range[6]], "label", {3, 5}, 4, CalloutMarker -> i], PlotLabel -> i], {i, {"CirclePoint", "Circle", "BoxPoint", "Box", "Star", "OpenStar", "Arrow", "OpenArrow"}}]Use Arrowheads as a marker:
ListLinePlot[{Callout[Fibonacci[Range[6]], "Fibonacci", {4, 10}, 5, CalloutMarker -> Arrowheads[0.04]], Table[LucasL[n], {n, 6}]}]CalloutStyle (2)
Change the color of the leader:
ListLinePlot[{Range[20], Callout[Prime[Range[20]], "label", Scaled[0.6], CalloutStyle -> Red]}]ListLinePlot[{Callout[Prime[Range[20]], "label", 14, CalloutStyle -> {White, Red}], Range[20]}, GridLines -> Automatic, PlotTheme -> "Marketing"]Frame (1)
FrameMargins (1)
Control the margins around the callout label:
Table[ListLinePlot[Callout[Prime[Range[20]], "label", Scaled[0.6], Frame -> True, FrameMargins -> i]], {i, {3, 6}}]Table[ListLinePlot[Callout[Prime[Range[20]], "label", Scaled[0.6], Appearance -> "Balloon", FrameMargins -> i]], {i, {3, 6}}]LabelVisibility (3)
Callouts are pruned to avoid collisions:
ListPlot[Table[Callout[{i, i}, i, LabelVisibility -> Automatic], {i, 50}], ImageSize -> 200]Label all the even-numbered points in a plot, even if some of them collide:
ListPlot[Table[Callout[{i, i}, i, LabelVisibility -> If[EvenQ[i], All, None]], {i, 50}], ImageSize -> 200]Label even-numbered points while avoiding collisions:
ListPlot[Table[Callout[{i, i}, i, LabelVisibility -> If[EvenQ[i], Infinity, -Infinity]], {i, 50}], ImageSize -> 200]LeaderSize (3)
Table[Plot[{Callout[Log[x] Sin[x], "label", Automatic, 2, LeaderSize -> s], Sin[x]}, {x, 0, 10}], {s, {15, 30}}]Control the slope of the leader:
Table[Plot[Callout[Sinc[x], "label", Automatic, 0, LeaderSize -> {20, θ, 5}], {x, -10, 10}, PlotRange -> {-1, 2}], {θ, {0°, 45°, 135°, 180°}}]Specify the distance between the leader and the curve:
Table[Plot[Callout[Sinc[x], "label", Automatic, 1, LeaderSize -> {25, 45°, g}], {x, -10, 10}, PlotRange -> {-1, 2}], {g, {0, 10}}]Specify both leader and neck length and angle:
Plot[{Callout[Log[x] Sin[x], "label", Automatic, 6.5, LeaderSize -> {{35, 110°, 5}, {10, 150°}}], Sin[x]}, {x, 0, 10}]LabelStyle (1)
RoundingRadius (1)
Use a rounded rectangle around the callout label:
Plot[Callout[x ^ 4 - 25 x ^ 2 + 20 x + 15, "label", Scaled[0.6], RoundingRadius -> 5, Appearance -> "Frame"], {x, -5, 5}]Plot[Callout[x ^ 4 - 25 x ^ 2 + 20 x + 15, "label", Scaled[0.6], RoundingRadius -> 5, Appearance -> "Balloon"], {x, -5, 5}]Applications (1)
Get the area and population for every country in the world:
data = EntityValue[["all countries"], {"Name", "Area", "Population"}];Add callouts to some of the countries that have relatively extreme areas or populations:
annotated = data /. {{n : "Macau" | "Monaco" | "India", a_, b_} :> Callout[{a, b}, n, Above], {n : "Pitcairn Islands" | "Svalbard" | "Greenland", a_, b_} :> Callout[{a, b}, n, Below], {r : "Russia" | "China", a_, b_} :> Callout[{a, b}, r, After], {"Vatican City", a_, b_} :> Callout[{a, b}, "Vatican City", Before], {n_, a_, b_} :> Tooltip[{a, b}, n]};Plot the data on a log-log scale:
ListLogLogPlot[annotated, PlotTheme -> "Detailed", FrameLabel -> Automatic]Text
Wolfram Research (2016), Callout, Wolfram Language function, https://reference.wolfram.com/language/ref/Callout.html (updated 2019).
CMS
Wolfram Language. 2016. "Callout." Wolfram Language & System Documentation Center. Wolfram Research. Last Modified 2019. https://reference.wolfram.com/language/ref/Callout.html.
APA
Wolfram Language. (2016). Callout. Wolfram Language & System Documentation Center. Retrieved from https://reference.wolfram.com/language/ref/Callout.html