

TimeSeriesWindow
TimeSeriesWindow[tes,{tmin,tmax}]
gives the elements of the time or event series data tes that falls between tmin and tmax.
TimeSeriesWindow[tes,winspec]
gives the elements of tes that satisfy the window specification winspec.
Details and Options
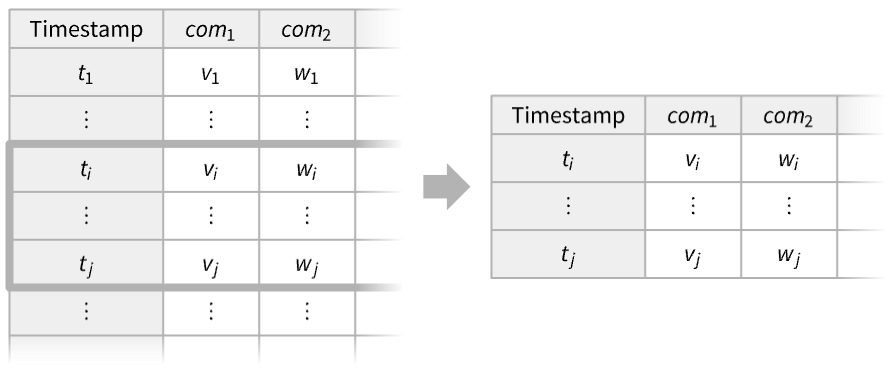
- TimeSeriesWindow is typically used to select a subset of a time or event series that falls in a given time window.
- TimeSeriesWindow will select the data points with timestamps
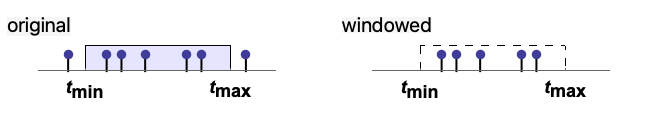 such that
  .
. - Possible forms of time or event series data tes include:
-
TimeSeries[…] continuous time-ordered sampled data EventSeries[…] collection of temporal events with values TemporalData[…] one or more paths composed of time-value pairs {{t1,x1},{t2,x2},…} list of time-value pairs {x1,x2,…} list of values with implied integer times starting at 0 - The window specification winspec can be given as:
-
{tmin,tmax} time or date limits Interval[…] one or more numeric time segments DateInterval[…] one or more calendar date segments DateObject[_, gran] single granular DateObject daytype day type specification - The window times tmin and tmax can be given as Automatic, numbers or dates. When tmin or tmax is given as Automatic, the first and last times in tes are used, respectively.
- Possible daytype values include "Weekday", "Weekend", Monday through Sunday, "BeginningOfMonth", "EndOfMonth", "BusinessDay" and "Holiday".
- TimeSeriesWindow takes the following options:
-
ResamplingMethod Automatic the method to use for resampling paths IncludeWindowTimes False whether to create values at tmin and tmax if not members of the timestamps CalendarType Automatic the calendar system to interpret the dates HolidayCalendar Automatic the holiday calendar schedule for business days - By default, the window times tmin and tmax are included only if they are existing timestamps of tes.
- If tmin and tmax are outside the range of the tes timestamps, they will be clipped to that range.
Examples
open all close allBasic Examples (2)
Select a subset of a time series:
ts = TimeSeries[{1, 2, 3, 4, 5}, {DateObject[{2026, 3, 13}, "Day"]}]TimeSeriesWindow[ts, {DateObject[{2026, 3, 14}, "Day"], DateObject[{2026, 3, 16}, "Day"]}]Normal[%]Select a subset of an event series:
es = EventSeries[{{.1, Subscript[x, 1]}, {.6, Subscript[x, 2]}, {1.3, Subscript[x, 3]}, {2.2, Subscript[x, 4]}, {2.5, Subscript[x, 5]}}];TimeSeriesWindow[es, {.9, 2.3}]Normal[%]Scope (7)
Basic Uses (2)
Select Fridays from a time series with dates:
ts = TimeSeries[TimeEventSeries`TimestampData[Association["UniformlySpacedQ" -> False,
   "Timestamps" -> TabularColumn[Association[
      "Data" -> {21, {{NumericArray[{15492, 15495, 15496, 15497, 15498, 15499, 15502, 15503, 15504,
           15505,  ... , 284.53455, 282.832828, 280.82584, 279.804813, 282.53754, 285.710728, 291.056065,
      289.044041, 282.887882, 286.026035, 280.630649, 282.622623, 284.93494, 282.437443,
290.325321}, {}, None}, "ElementType" -> "Real64"]], Association[]];fridays = TimeSeriesWindow[ts, Friday]DateListPlot[{ts, fridays}, Joined -> {True, False}, Filling -> 2 -> 0, FillingStyle -> Directive[Gray, Thick]]fridays["Timestamps"]//NormalThese are alternative ways to get the same list:
DateSelect[ts["Timestamps"]//Normal, #DayName === Friday&]Select[ts["Timestamps"], DayMatchQ[Friday]]//NormalSelect[ts, DayMatchQ[#Timestamp, Friday]&]%["Timestamps"]//NormalVisualize different subsets of a time series:
data = TimeSeries@RandomFunction[ARIMAProcess[{.1}, 1, {.2}, 1], {1000}]ListLinePlot[data]Split the data into three parts:
win1 = TimeSeriesWindow[data, {Automatic, 300}];
win2 = TimeSeriesWindow[data, {300, 700}];
win3 = TimeSeriesWindow[data, {700, Automatic}];ListLinePlot[{win1, win2, win3}, PlotLegends -> {"win1", "win2", "win3"}]Data Types (5)
Extract three elements from a vector:
v = {a, b, c, d, e};TimeSeriesWindow[v, {2, 4}]Select the values for a specific interval of times in a list of time-value pairs:
v = {{1, a}, {3, b}, {7, c}, {14, d}, {15, e}};TimeSeriesWindow[v, {2, 8}]Extract 50 values from a TimeSeries:
ts = TimeSeries[TimeEventSeries`TimestampData[Association["UniformlySpacedQ" -> True, "Count" -> 100,
   "Endpoints" -> TabularColumn[Association["Data" -> {{0, 99}, {}, None},
      "ElementType" -> "Integer64"]], "MinimumTimeIncrement" -> 1, "Caller ...  -5.83329995009813, -5.365194518466113, -5.614668108914484,
      -6.477246191853266, -7.461704439607946, -6.79657593242878, -5.864937981765857,
-6.27785271209235, -5.841962111797332}, {}, None}, "ElementType" -> "Real64"]], Association[]];win = TimeSeriesWindow[ts, {10, 59}]Overlay the window over the original data:
ListLinePlot[{ts, win}]Extract 30 values from an EventSeries:
es = EventSeries[TimeEventSeries`TimestampData[Association["UniformlySpacedQ" -> True, "Count" -> 50,
   "Endpoints" -> TabularColumn[Association["Data" -> {{0, 49}, {}, None},
      "ElementType" -> "Integer64"]], "MinimumTimeIncrement" -> 1, "Caller ...  -1, -1, 1, 1, -1, 1, 1, -1, -1, 1, 1, 1, -1, -1, 1, -1,
      1, -1, -1, -1, -1, -1, 1, -1, -1, -1, -1, 1, -1, 1, 1, 1, 1, 1, -1, 1, -1, -1, -1, 1, 1, 1,
-1, 1, 1, -1, -1, -1, -1}, {}, None}, "ElementType" -> "Integer64"]], Association[]];win = TimeSeriesWindow[es, {10, 39}]Overlay the window over the original data:
ListPlot[{es, win}, Filling -> Axis]Restrict the paths of TemporalData to a smaller interval:
td = RandomFunction[WienerProcess[], {0, 20, 0.01}, 5]win = TimeSeriesWindow[td, {3, 15}]ListLinePlot[#, PlotRange -> {{0, 20}, {-10, 10}}]& /@ {td, win}Options (4)
IncludeWindowTimes (1)
Take a list of time-value pairs to be interpreted as data for a time series:
ts = {{1, 1}, {2, 2}, {3, 3}, {4, 4}};Select the pairs between the time window endpoints, not including them:
TimeSeriesWindow[ts, {1.5, 3.5}]The endpoints are included if they are timestamps of the time series:
TimeSeriesWindow[ts, {2, 3}]Specify that the window endpoints should be included:
TimeSeriesWindow[ts, {1.5, 3.5}, IncludeWindowTimes -> True]Include only the right window endpoint:
TimeSeriesWindow[ts, {1.5, 3.5}, IncludeWindowTimes -> {False, True}]ResamplingMethod (1)
Specify what values to assign to window times that are not among the timestamps:
s = {Subscript[x, 1], Subscript[x, 2], Subscript[x, 3], Subscript[x, 4]};
t = {2, 4, 6, 8};data = TimeSeries[s, {t}];
data//NormalBy default, a resampling method of the input data is used:
win1 = TimeSeriesWindow[data, {4, 6.4}, IncludeWindowTimes -> True];win1//Normal//Simplifywin2 = TimeSeriesWindow[data, {4, 6.4}, IncludeWindowTimes -> True, ResamplingMethod -> {"Interpolation", InterpolationOrder -> 1}];win2//Normal//Simplifywin3 = TimeSeriesWindow[data, {4, 6.4}, ResamplingMethod -> {"Constant", c}, IncludeWindowTimes -> True];win3//NormalCalendarType (1)
Applications (3)
This time series contains the number of steps taken daily by a person during a period of five months:
stepdata = TemporalData[TimeSeries, {{{10785, 11753, 7092, 5290, 5022, 7438, 13386, 11195, 12499, 12495,
    12004, 11833, 4097, 14270, 10280, 11947, 12699, 15634, 12332, 8399, 4680, 10034, 9173, 5309,
    9552, 5605, 13294, 7600, 2417, 0, 1315, 9066, 11624 ... 1, 9618, 21243, 22273, 15869, 17687, 9263,
    21162, 14724, 6386}}, {TemporalData`DateSpecification[{2013, 4, 1, 0, 0, 0.},
    {2013, 9, 1, 0, 0, 0.}, {1, "Day"}]}, 1, {"Discrete", 1}, {"Discrete", 1}, 1,
  {ValueDimensions -> 1}}, True, 10.];
Display the daily step counts for each of the months:
monthlyTS = Table[TimeSeriesWindow[stepdata, DateObject[{2013, k}]], {k, 4, 8}];months = {"April", "May", "June", "July", "August"};DateListPlot[monthlyTS, PlotLegends -> months]Display the total number of steps for each month:
monthlyTotals = Total /@ monthlyTS;PieChart[monthlyTotals, ChartLabels -> Placed[{monthlyTotals, months}, {"RadialCenter", "RadialCallout"}]]Visualize the temperature in Champaign during the summer of 2014:
td = TemporalData[TimeSeries,
 {{QuantityArray[StructuredArray`StructuredData[{365},
     {{-2.94, -7.28, -14.94, -3.39, -2.56, -21, -23.06, -14.33, -6.5, 1.33, 3.22, 1.67, 5, -1.72,
       -2.33, -7.78, -0.5, -9, -4.28, 1.83, -0.94, -17, -12.17, -18 ... cation[{2014, 1, 1, 0, 0, 0.}, {2014, 12, 31, 0, 0, 0.}, {1, "Day"}]},
  1, {"Continuous", 1}, {"Discrete", 1}, 1, {ValueDimensions -> 1, DateFunction -> Automatic,
   ResamplingMethod -> {"Interpolation", InterpolationOrder -> 1}}}, True, 10.1];
Extract the temperatures for summer months:
summer = TimeSeriesWindow[td, {DateObject[{2014, 6, 1}, "Day", "Gregorian", -6.], DateObject[{2014, 9, 1}, "Day", "Gregorian", -6.]}]Find some basic descriptive statistics:
{Min[#], Mean[#], Max[#]}&@summerDateListPlot[{td, summer}, FrameLabel -> Automatic]Extract a portion of a time series:
ts = TimeSeries[FinancialData["GOOGL", {"1 Jan 2012", "1 Jan 2014"}]]DateListPlot[ts]Take the elements between May 4 and August 4 of 2012:
win = TimeSeriesWindow[ts, {{2012, 5, 4}, {2012, 8, 4}}]DateListPlot[win]Extract elements from June 2012:
TimeSeriesWindow[ts, DateObject[{2012, 6}, "Month"]]Extract elements that fall at the end of each month:
end = TimeSeriesWindow[ts, "EndOfMonth"]DateListPlot[end, PlotMarkers -> Automatic]Properties & Relations (1)
Take extracts elements of a time series based on a range of indices:
ts = TimeSeries[Range[10], {DateObject[{2026, 1, 21}]}]Take[ts, {3, 6}]TimeSeriesWindow uses a range of times:
TimeSeriesWindow[ts, {DateObject[{2026, 1, 23}], DateObject[{2026, 1, 26}]}]Those dates correspond to the previously used range of indices {3,6}:
ts["Times"][[{3, 6}]]//NormalText
Wolfram Research (2014), TimeSeriesWindow, Wolfram Language function, https://reference.wolfram.com/language/ref/TimeSeriesWindow.html (updated 2026).
CMS
Wolfram Language. 2014. "TimeSeriesWindow." Wolfram Language & System Documentation Center. Wolfram Research. Last Modified 2026. https://reference.wolfram.com/language/ref/TimeSeriesWindow.html.
APA
Wolfram Language. (2014). TimeSeriesWindow. Wolfram Language & System Documentation Center. Retrieved from https://reference.wolfram.com/language/ref/TimeSeriesWindow.html