How to | Add Text to a Graphic
The Wolfram Language offers great flexibility for adding text to graphics; you can add text interactively using the Drawing Tools palette or programmatically using various graphics primitives.
Selected examples from the video:
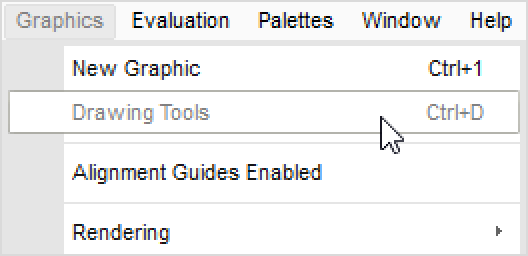
To add text to a plot or graphic, select Drawing Tools from the Graphics menu to bring up the Drawing Tools palette:
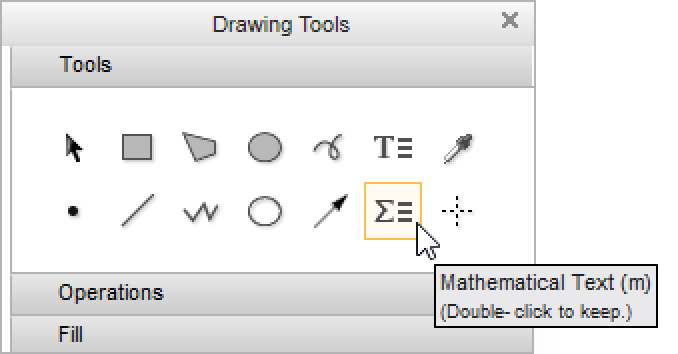
You can use the math tool to add mathematical notation to a graphic. The math tool gives the proper spacing for mathematical typesetting, automatically italicizes variables, and lets you type built-up fractions, raised powers, square roots, and so on. With the math tool selected, you can click a graphic and then enter mathematical notation:
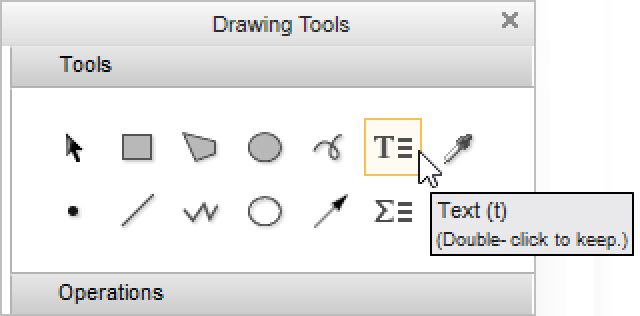
You can also add text to a graphic by using the text tool. Select the text tool, click a graphic, and then enter some text:
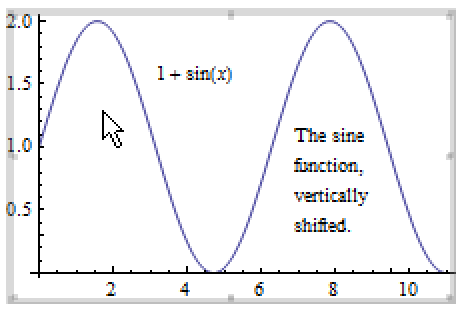
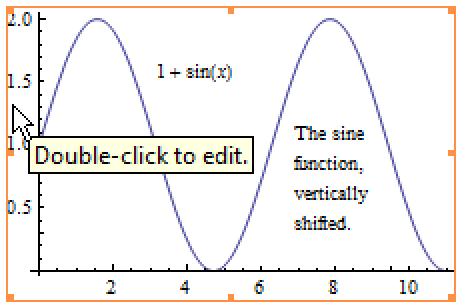
In the graphic below, the math tool was used to enter the plotted function, ![]() . The text description of the plot was entered using the text tool.
. The text description of the plot was entered using the text tool.
If you see the orange graphics highlight frame, the entire graphic is selected and you cannot edit the items within it. To edit the graphic, double-click it:
The thick gray frame indicates that you can edit the items within the graphic. Fine-tune the positions of the mathematical notation and text in the graphic by dragging: