

LinearGradientFilling
LinearGradientFilling[{col1,col2,…,coln}]
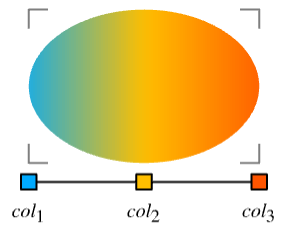
多面体の面およびその他の塗り潰されるグラフィックスオブジェクトを,水平の直線に沿って色 coliの間の漸進移行を使って描画するように指定する二次元グラフィックスプリミティブである.
LinearGradientFilling[{pos1,pos2,…,posn}{col1,col2,…,coln}]
色 coliをスケールされた位置 posiに使う.
LinearGradientFilling[{pos1,pos2,…,posn}{col1,col2,…,coln},dir]
向きが dir の直線に沿って描画する.
LinearGradientFilling[{pos1,…,posn}{col1,…,coln},dir,padding]
境界位置 pos1と posnを超えて描画する際に指定された充填法を使う.
詳細
- LinearGradientFillingは,線形勾配,水平勾配,垂直勾配あるいは角度勾配としても知られている.
- LinearGradientFillingは,位置に依存する色を使った領域の塗潰しによく使われる.
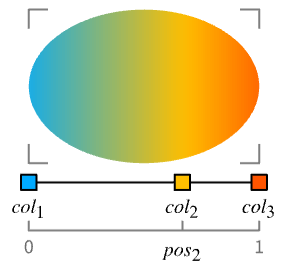
- LinearGradientFilling[{col1,col2,…,coln}]は,グラフィックスオブジェクトの境界ボックスの x 軸に沿った coliの間の漸進移行を指定する.
- LinearGradientFilling[]は,事実上,LinearGradientFilling[{Black,White}]に等しい.
- LinearGradientFilling["scheme"]はColorDataの指定されたカラースキームを使う.
- LinearGradientFilling[{pos1,pos2,…,posn}{col1,col2,…,coln}]は,グラフィックスオブジェクトの幅と相対的であるとみなされるスケールされた位置 posiに使う色 coliを指定する.
- ImageScaledを使って位置 posiを指定することができるこの位置は画像の全領域との比であるとみなされる.
- LinearGradientFilling[{pos1col1,pos2col2,…}]はLinearGradientFilling[{pos1,pos2,…}{col1,col2,…}]に等しい.
- LinearGradientFilling[{{pos1,col1},{pos2,col2},…}]はLinearGradientFilling[{pos1,pos2,…}{col1,col2,…}]に等しい.
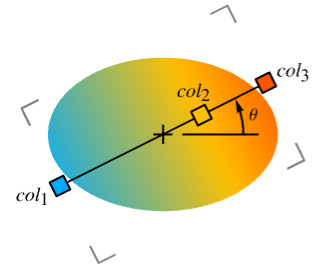
- 数値 θ を持つLinearGradientFilling[…,θ]は,角度 θ で勾配の方向がベクトル{Cos[θ],Sin[θ]}の直線を指定する.
- 次は,LinearGradientFilling[…,dir]における可能なシンボルの方向 dir である.
-
Bottom 上から下 Center 左下から右上 Left 右から左 Right 左から右 Top 下から上 - LinearGradientFilling[colors]は,事実上,LinearGradientFilling[colors,Right]に等しい.
- LinearGradientFilling[{pos1,…,posn}{col1,…,coln},dir,padding]は,もとの位置の pos1から posnまでを超えて描画する際に使用する充填を指定する.
- 次は,padding の可能な設定である.
-
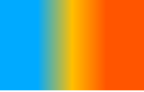
"Fixed" 色の繰返し 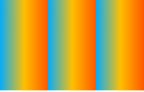
"Periodic" すべての色の循環的繰返し 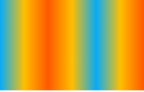
"Reflected" 色の反射 - LinearGradientFilling[colors,dir]は,事実上,LinearGradientFilling[colors,dir,"Fixed"]に等しい.
例題
すべて開く すべて閉じる例 (3)
Graphics[{LinearGradientFilling[{Red, Blue}], Rectangle[]}]Plot[2Sin[x] + x, {x, 0, 15}, FillingStyle -> LinearGradientFilling[{RGBColor[1., 0.71, 0.75], RGBColor[0.64, 182/255, 244/255]}, Top], Filling -> Bottom]GeoGraphics[{LinearGradientFilling[{RGBColor[0.8887337889338569, 0.6872652443890922, 0.7107936282493809, 1.], RGBColor[0.49023987591300533, 0.4876253828910493, 0.6209426339841682, 1.], RGBColor[0.9996537617780855, 0.9995675813955313, 0.9996214193107363, 1.], RGBColor[0.698039839063257, 0.1333301463795396, 0.20392133625241132, 1.]}], Polygon[["United States"]]}]スコープ (15)
基本的な用法 (6)
Graphics[{LinearGradientFilling[{RGBColor[0.6705882352941176, 0.8627450980392157, 1.], RGBColor[0.011764705882352941, 0.5882352941176471, 1.]}], #}]& /@ {Triangle[], Disk[], Polygon[{{3, 1}, {9, 8}, {0, 5}, {9, 3}, {4, 9}}]}Plot[2Sin[x] + x, {x, 0, 15}, Filling -> Bottom, FillingStyle -> LinearGradientFilling[{RGBColor[0.6705882352941176, 0.8627450980392157, 1.], RGBColor[0.011764705882352941, 0.5882352941176471, 1.]}, Top]]BarChart[{1, 2, 3, 4}, ChartStyle -> LinearGradientFilling[{RGBColor[0.6705882352941176, 0.8627450980392157, 1.], RGBColor[0.011764705882352941, 0.5882352941176471, 1.]}, Top]]Region[Style[ImplicitRegion[y^2 < x (-1 + x^3), {x, y}], LinearGradientFilling[{RGBColor[0.6705882352941176, 0.8627450980392157, 1.], RGBColor[0.011764705882352941, 0.5882352941176471, 1.]}]]]GeoGraphics[{GeoStyling["OutlineMap", LinearGradientFilling[{RGBColor[0.6705882352941176, 0.8627450980392157, 1.], RGBColor[0.011764705882352941, 0.5882352941176471, 1.]}]], Polygon[["austria"]]}]LinearGradientFilling[{RGBColor[0.6705882352941176, 0.8627450980392157, 1.], RGBColor[0.011764705882352941, 0.5882352941176471, 1.]}]指定 (9)
引数がないLinearGradientFillingはBlackからWhiteへの漸進移行を描画する:
Graphics[{LinearGradientFilling[], RegularPolygon[4]}]Graphics[{LinearGradientFilling[#], RegularPolygon[4]}] & /@ {{Black, LightGray}, {Red, Pink, LightRed}, {Purple, Blue, Green, Yellow, Orange, Red}}Graphics[{LinearGradientFilling[# -> {Black, LightGray}], RegularPolygon[4]}]& /@ {{0, 1}, {0.25, 1}, {0.75, 1}}スケールされた位置はグラフィックスオブジェクトの幅と相対的であるとみなされる:
Graphics[{LinearGradientFilling[{0, 1} -> {Black, White}], RegularPolygon[4], RegularPolygon[{1, 1}, 1, 4]}]Graphics[{LinearGradientFilling[{ImageScaled[0], ImageScaled[1]} -> {Black, White}], RegularPolygon[4], RegularPolygon[{1, 1}, 1, 4]}]ColorDataからの定義済みのカラースキームを使う:
Graphics[{LinearGradientFilling[#], RegularPolygon[4]}]& /@ {"SunsetColors", "BlueGreenYellow", "DeepSeaColors"}LightDarkSwitchedを使ってライトモードとダークモードに異なる色を指定する:
graphic = Graphics[{LinearGradientFilling[{LightDarkSwitched[Blue, Red], LightDarkSwitched[Cyan, Pink]}], RegularPolygon[4]}];{LightModePane[graphic], DarkModePane[graphic]}Graphics[{LinearGradientFilling[{Black, White}, Pi / 4], RegularPolygon[4]}]Graphics[{LinearGradientFilling[{Black, White}, 90 Degree], RegularPolygon[4]}]Graphics[{LinearGradientFilling[{Black, White}, #], RegularPolygon[4]}] & /@ {Right, Left, Top, Bottom, Center}Graphics[{LinearGradientFilling[ {0.4, 0.5, 0.6} -> {RGBColor[0., 2/3, 1.], RGBColor[1., 3/4, 0.], RGBColor[1., 1/3, 0.]}, Pi / 4, #], RegularPolygon[4]}] & /@ {"Fixed", "Periodic", "Reflected"}アプリケーション (13)
基本的なアプリケーション (3)
gradient[pos_ -> colors_] := Graphics[{LinearGradientFilling[pos -> colors], Polygon[{{0, 0}, {1, 0}, {1, 1}, {0, 1}}]}, GridLines -> {Thread[{pos, colors}], None}, GridLinesStyle -> Thick, AspectRatio -> .2]gradient[{0, 1} -> {RGBColor[0., 2/3, 1.], RGBColor[1., 3/4, 0.]}]gradient[{1 / 3, 2 / 3} -> {RGBColor[0., 2/3, 1.], RGBColor[1., 3/4, 0.]}]gradient[RandomReal[1, 2] -> {RGBColor[0., 2/3, 1.], RGBColor[1., 3/4, 0.]}]direction[colors_, dir_] :=
Graphics[{{LinearGradientFilling[colors, dir], Polygon[{{0, 0}, {1, 0}, {1, 1}, {0, 1}}]}, {Thickness[Large], Arrowheads[{{.125, 1 / 2}}], Rotate[Arrow[{{0.01, 0.5}, {0.99, 0.5}}], dir, {0.5, 0.5}]}}]direction[{RGBColor[0., 2/3, 1.], RGBColor[1., 3/4, 0.]}, #] & /@ {0, Pi / 4, 3Pi / 4, Pi}gradient[pos_ -> colors_, padding_] := Graphics[{LinearGradientFilling[pos -> colors, padding], Polygon[{{0, 0}, {1, 0}, {1, 1}, {0, 1}}]}, GridLines -> {Thread[{pos, colors}], None}, GridLinesStyle -> Thick, AspectRatio -> .2]gradient[{1 / 3, 2 / 3} -> {RGBColor[0., 2/3, 1.], RGBColor[1., 3/4, 0.]}, "Fixed"]gradient[{1 / 3, 2 / 3} -> {RGBColor[0., 2/3, 1.], RGBColor[1., 3/4, 0.]}, "Periodic"]gradient[{1 / 3, 2 / 3} -> {RGBColor[0., 2/3, 1.], RGBColor[1., 3/4, 0.]}, "Reflected"]勾配色 (3)
ColorDataの勾配色コレクション:
ColorData["Gradients"]//Shortdisplay[scheme_] := Graphics[{LinearGradientFilling[scheme], Rectangle[RoundingRadius -> .1]}]display /@ Take[ColorData["Gradients"], -30]Wolfram Data Repositoryの勾配色コレクション:
uigradients = ResourceData["UI Color Gradients"];Keys[uigradients]//Shortdisplay[name_ -> color_] := Graphics[{LinearGradientFilling[color], Rectangle[RoundingRadius -> .1]}]display /@ Normal[Take[uigradients, 60]]Wolfram Data Repositoryの色相コレクション:
hues = ResourceData["Hue Color Gradients"];hues//Shortdisplay[color_] := Graphics[{LinearGradientFilling[color], Rectangle[RoundingRadius -> .1]}]display /@ huesグラフィックス (3)
Graphics[{LinearGradientFilling[{RGBColor[0.6705882352941176, 0.8627450980392157, 1.], RGBColor[0.011764705882352941, 0.5882352941176471, 1.]}], #}]& /@ {Triangle[], RegularPolygon[4], Polygon[{{3, 1}, {9, 8}, {0, 5}, {9, 3}, {4, 9}}]}勾配塗潰しをTextに適用する:
text[str_] := BoundaryDiscretizeGraphics[Text[str], _Text];Graphics[{LinearGradientFilling[{ImageScaled[0], ImageScaled[1]} -> {RGBColor[0.996078431372549, 0.7568627450980392, 0.38823529411764707], RGBColor[0.8705882352941177, 0.2627450980392157, 0.07450980392156863]}], text[Style["Wolfram", Large, FontFamily -> "Brush Script MT"]]}]background[g_, colors_, dir_ : 0] := Append[g, Prolog -> {LinearGradientFilling[ImageScaled /@ Range[0, 1, 1 / (Length[colors] - 1)] -> colors, dir], RectangleBox[ImageScaled[{0, 0}], ImageScaled[{1, 1}]]}]background[Graphics[{Red, Disk[], Green, Rectangle[{0, 0}, {2, 2}], Blue, Disk[{2, 2}]}], {Blue, Green, Red}]background[GraphPlot[Table[i -> Mod[i ^ 2, 102], {i, 0, 102}]], {RGBColor[0.6705882352941176, 0.8627450980392157, 1.], RGBColor[0.011764705882352941, 0.5882352941176471, 1.]}]background[BarChart[Range[8], Axes -> False], {RGBColor[0.996078431372549, 0.7568627450980392, 0.38823529411764707], RGBColor[0.8705882352941177, 0.2627450980392157, 0.07450980392156863]}, Top]可視化 (4)
Plot[Sin[Sqrt[2]x] + Sin[x], {x, 0, 10}, Prolog -> {LinearGradientFilling[{ImageScaled[0], ImageScaled[1]} -> {RGBColor[0.6705882352941176, 0.8627450980392157, 1.], RGBColor[0.011764705882352941, 0.5882352941176471, 1.]}], Rectangle[ImageScaled[{0, 0}], ImageScaled[{1, 1}]]}, ...]Plot[{Sin[x] + x / 2, Sin[x] + x}, {x, 0, 10}, Filling -> {1 -> {2}}, FillingStyle -> LinearGradientFilling[{RGBColor[1., 0.71, 0.75], RGBColor[0.64, 182/255, 244/255]}, Bottom]]BarChart[{1, 2, 3, 4, 5}, ChartStyle -> LinearGradientFilling[{Black, White}, Bottom]]DateListPlot[FinancialData["IBM", "Jan. 1, 2020"], Filling -> Bottom, FillingStyle -> LinearGradientFilling[{LightRed, Red}, Top]]特性と関係 (5)
LinearGradientFillingは指定された色の色空間を使う:
Graphics[{LinearGradientFilling[{RGBColor[1, 0, 0], RGBColor[0, 0, 1]}], Rectangle[]}]Graphics[{LinearGradientFilling[{Hue[0], Hue[2 / 3]}], Rectangle[]}]単一の位置に異なる色を与えてハードストップを生成することができる:
Graphics[{LinearGradientFilling[{0, 1 / 2, 1 / 2, 1} -> {RGBColor[1, 0, 0], RGBColor[1, 1, 0], RGBColor[0, 1, 0], RGBColor[0, 0, 1]}], Rectangle[]}]LinearGradientImageは色の線形ブレンドで画像を返す:
LinearGradientImage[{RGBColor[0., 2/3, 1.], RGBColor[1., 3/4, 0.], RGBColor[1., 1/3, 0.]}, {100, 50}]Graphics[{LinearGradientFilling[{RGBColor[0., 2/3, 1.], RGBColor[1., 3/4, 0.], RGBColor[1., 1/3, 0.]}], Rectangle[]}]Blendを使って混色の配列を生成する:
Graphics[Raster[{Range[100] / 100}, ColorFunction -> (Blend[{{0, RGBColor[1, 0, 0]}, {(1/2), RGBColor[1, 1, 0]}, {1, RGBColor[0, 0, 1]}}, #]&)], AspectRatio -> .4]Graphics[{LinearGradientFilling[{0, 1 / 2, 1} -> {RGBColor[1, 0, 0], RGBColor[1, 1, 0], RGBColor[0, 0, 1]}], Rectangle[]}]VertexColorsは色の間を補間する:
Graphics[Polygon[{{0, 0}, {1, 0}, {1, 1}, {0, 1}}, VertexColors -> {RGBColor[1, 0, 0], RGBColor[0, 1, 0], RGBColor[0, 1, 0], RGBColor[1, 0, 0]}]]Graphics[{LinearGradientFilling[{RGBColor[1, 0, 0], RGBColor[0, 1, 0]}], Polygon[{{0, 0}, {1, 0}, {1, 1}, {0, 1}}]}]考えられる問題 (2)
色が同じ色空間で指定されると,補間にもその色空間が使われる:
{Graphics[{LinearGradientFilling[{RGBColor[1, 0, 0], RGBColor[0, 0, 1]}], Rectangle[]}] , Graphics[{LinearGradientFilling[{Hue[0], Hue[2 / 3]}], Rectangle[]}]}色が異なる色空間で指定されると,補間には最初の色の色空間が使われる:
{Graphics[{LinearGradientFilling[{RGBColor[1, 0, 0], Hue[2 / 3]}], Rectangle[]}] , Graphics[{LinearGradientFilling[{Hue[2 / 3], RGBColor[1, 0, 0]}], Rectangle[]}]}Graphics[{LinearGradientFilling[{GrayLevel[0.5], Red}], Rectangle[]}]LinearGradientFillingは色指示子に先行する:
Graphics[{LinearGradientFilling[], Red, Disk[]}]テキスト
Wolfram Research (2020), LinearGradientFilling, Wolfram言語関数, https://reference.wolfram.com/language/ref/LinearGradientFilling.html.
CMS
Wolfram Language. 2020. "LinearGradientFilling." Wolfram Language & System Documentation Center. Wolfram Research. https://reference.wolfram.com/language/ref/LinearGradientFilling.html.
APA
Wolfram Language. (2020). LinearGradientFilling. Wolfram Language & System Documentation Center. Retrieved from https://reference.wolfram.com/language/ref/LinearGradientFilling.html