"KMeans" (Machine Learning Method)
- Method for FindClusters, ClusterClassify and ClusteringComponents.
- Partitions data into a specified
 clusters of similar elements using a k-means clustering algorithm.
Details & Suboptions
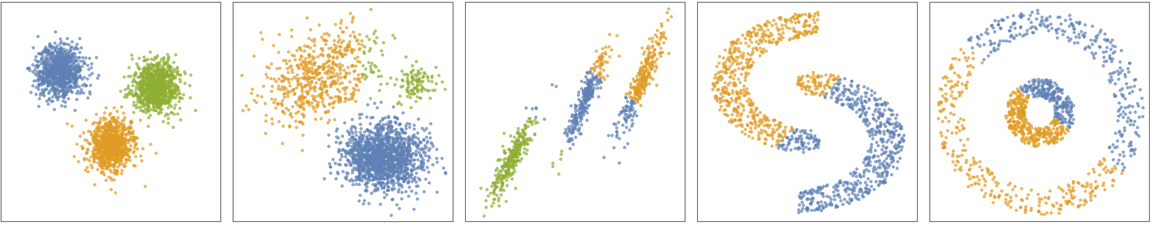
- "KMeans" is a classic, simple, centroid-based clustering method. "KMeans" works when clusters have similar sizes and are locally and isotropically distributed around their centroid. When clusters have very different sizes, are anisotropic, are intertwined, or when outliers are present, it is likely that "KMeans" will give poor results.
- The following plots show the results of the "KMeans" method applied to toy datasets:
-
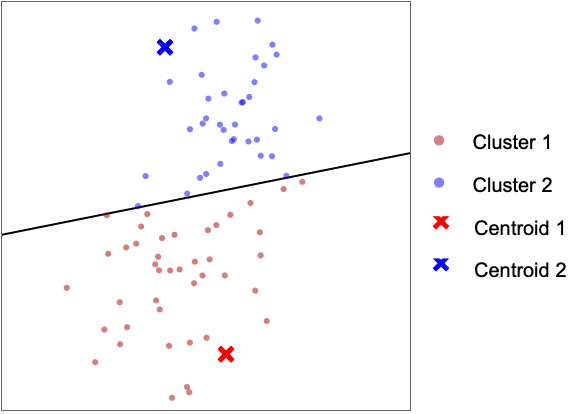
- The "KMeans" method aims to find k centroids defining k clusters. Each data point is assigned to its nearest centroid. All points assigned to a given centroid are forming a cluster.
- The procedure to find the best k centroids is iterative. The search starts by using random centroids and assigning each point to its nearest centroid:
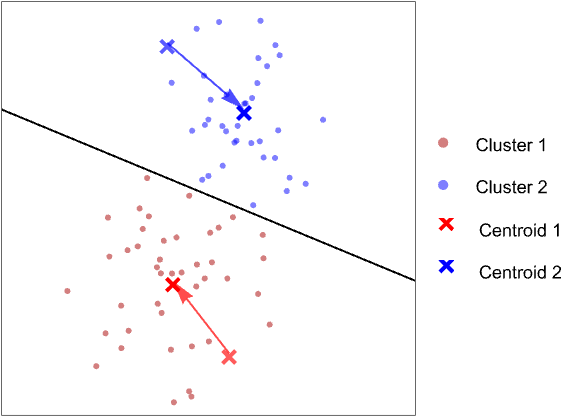
- Once all clusters are defined, the mean of each cluster becomes a new centroid:
- This procedure is repeated until the clusters remain unchanged. This iterative procedure is sometimes called "hard EM" (hard Expectation Maximization).
- The "KMeans" method is similar to the "GaussianMixture" with a spherical covariance (that is, all clusters are isotropic and have the same size).
- Since the initial centroids are chosen randomly, results might differ upon evaluation.
- The suboption "InitialCentroids" can be used to specify the initial centroids as a list of data points.
- The following suboption can be given:
-
"InitialCentroids" Automatic a list of initial centroids
Examples
open all close allBasic Examples (3)
Find exactly four clusters of nearby values using the "KMeans" clustering method:
FindClusters[{1, 2, 10, 12, 3, 1, 13, 25}, 4, Method -> "KMeans"]data = Join[RandomReal[1, {100, 2}], RandomReal[{-3, -.1}, {100, 2}], RandomReal[{-3, -0.1}, {100, 2}], RandomReal[{1, 3}, {100, 2}]];
ListPlot[data]Plot computed clusters using the "KMeans" method:
ListPlot[FindClusters[data, 3, Method -> "KMeans"]]Train a ClassifierFunction on a list of strings:
string = {"c", "a", "b", "xxx", "xxx2xx", "xxxxx", "uuuuu4u", "u5uuuuu"};
c = ClusterClassify[string, 3, Method -> "KMeans"]Find the cluster assignments and gather the elements by their cluster:
components = c[string]
GatherBy[string, c]Options (3)
DistanceFunction (1)
"InitialCentroids" (2)
Generate a list of 100 random colors:
colors = RandomColor[100]Cluster the colors without specifying the initial configuration of centroids using the "KMeans" method:
FindClusters[colors, 4, Method -> "KMeans"]Specify the initial colors to be used as centroids using the "KMeans" method:
FindClusters[colors, 3, Method -> {"KMeans", "InitialCentroids" -> {RGBColor[0.08509910562814116, 0.2392990464510818, 0.995197105413417], RGBColor[0.7194874746578643, 0.8141965369852671, 0.7566048068843456], RGBColor[0.904015286667484, 0.19694494526282913, 0.18860612169002278]} }]SeedRandom[123]
data = Join[RandomReal[1, {100, 2}], RandomReal[{-3, -.1}, {100, 2}], RandomReal[{-3, -0.1}, {100, 2}], RandomReal[{1, 3}, {100, 2}]];
ListPlot[data]Find different clusterings of data using the "KMeans" method by varying the "InitialCentroids":
{p1, p2, p3} = {{-1, -1}, {1, 0}, {2, 2}};
{q1, q2, q3} = RandomReal[-2, {3, 2}];

Grid[{Table[ListPlot[FindClusters[data, 3, Method -> {"KMeans", "InitialCentroids" -> s}]], {s, {{p1, p2, p3}, {q1, q2, q3}}}]}, Frame -> All]
Possible Issues (1)
Create and visualize noisy 2D moon-shaped training and test datasets:
circle[r_, theta_] := {r Sin[theta], r Cos[theta]};
{train, test} = With[{
	rot = RotationTransform[π, {0, 0}],
	tra = TranslationTransform[{1, 2.5}], pts = circle@@@RandomVariate[UniformDistribution[{{2, 3}, {0, Pi}}], 2000]},
	TakeDrop[RandomSample@Join[tra[rot[pts]], pts], 2000]
	];
ListPlot[{train, test}, PlotRange -> All, AspectRatio -> 1, PlotStyle -> Directive[ PointSize[0.013], Opacity[0.7]], Frame -> True, Axes -> False]
Train a ClassifierFunction using "KMeans" for two clusters and find clusters in the test set:
ncls = 2;
cl = ClusterClassify[train, ncls, Method -> "KMeans"]
decision = cl[test];
Visualizing clusters indicates that "KMeans" performs poorly on intertwined clusters:
fcl = ListPlot[Pick[test, decision, #]& /@ Range[ncls], PlotStyle -> Directive[PointSize[0.025], Opacity[0.7]], AspectRatio -> 1, Frame -> True, Axes -> False]