Geographic Visualization
 Topic Overview
 The Wolfram Language provides geographic visualization functions to create maps from many types of data. Geo locations can be given as arbitrary geo positions or as geo entities in the Wolfram Knowledgebase. The plots make use of the full range of features of geo graphics, including projections, backgrounds and general styling.
 GeoListPlot — plot points or regions on a map
Scalar Values at Locations
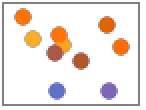
 GeoBubbleChart — plot values on a map using bubbles of different sizes
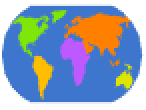 GeoRegionValuePlot — plot values on a map by using styled regions
 GeoContourPlot — plot contour lines through values on a map
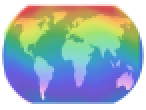 GeoDensityPlot — plot values on a map using smoothly varying colors
Vector Values at Locations
 GeoVectorPlot — plot vector fields on a map as individual markers
 GeoStreamPlot — plot vector fields on a map using continuous streamlines
Location Intensity of Points
 GeoSmoothHistogram — create smooth intensities of locations on a map
 GeoHistogram — create binned intensities of locations on a map
Location Connectivity
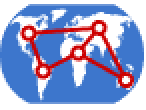 GeoGraphPlot — plot a graph of relations between geographic locations on a map
 GeoGraphValuePlot — plot weighted relations between geographic locations
Multidimensional Data at Locations
 PointValuePlot — plot multidimensional data at locations on a map