High-Dimensional Visualization
High-dimensional data has many values for each data point and occurs frequently, including scientific data where lots of attributes are measured; engineering data capturing multiple sensor readings; and business data tracking different process metrics. Whether data comes from spreadsheets, databases or APIs, visualizing it collectively allows you to see overall patterns and trends between the various components.
Visualizing ![]() -dimensional data requires different techniques than for data with just 2 or 3 dimensions. Multipanel methods show multiple, simple views of the data using shared aesthetics and scales to make it easier to identify potential features. Single-panel plots use distinct markers and styles to represent the full depth of the data.
-dimensional data requires different techniques than for data with just 2 or 3 dimensions. Multipanel methods show multiple, simple views of the data using shared aesthetics and scales to make it easier to identify potential features. Single-panel plots use distinct markers and styles to represent the full depth of the data.
Pairwise Plots
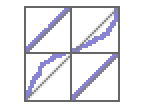
Plot all pairwise 2D projections of data.
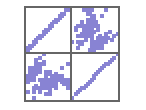 PairwiseListPlot — array of pairwise list plots
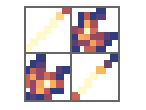 PairwiseDensityHistogram — array of pairwise density histograms
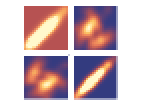 PairwiseSmoothDensityHistogram — array of pairwise smooth density histograms
Compare all 1D projections of data.
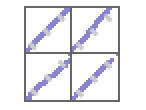 PairwiseQuantilePlot — array of pairwise Q-Q plots
 PairwiseProbabilityPlot — array of pairwise P-P plots
Multiaxis Plots
Plot an ![]() -dimensional point as a curve with multiple axes.
-dimensional point as a curve with multiple axes.
 ParallelAxisPlot — plot
 ![]() -dimensional points on parallel axes
-dimensional points on parallel axes
 RadialAxisPlot — plot
 ![]() -dimensional points on radial axes
-dimensional points on radial axes
Feature Plots
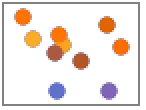
Feature space plots extract low-dimensional feature vectors for each object and plot them.
 FeatureSpacePlot — plot feature vectors in 2D
 FeatureSpacePlot3D — plot feature vectors in 3D
Glyph Plots
Glyph plots visualize each data point as another plot.
 PointValuePlot — plot locations with associated data of any dimension