How to | Edit Wolfram Language Graphics
The Wolfram Language's unified symbolic graphics architecture makes it possible to mix programmatic graphics generation with interactive editing and control. The Wolfram System Drawing Tools palette lets you edit existing plots or illustrations—or create free-form ones from scratch.
Selected examples from the video:
You can edit Wolfram Language graphics by using the tools in the Drawing Tools palette.
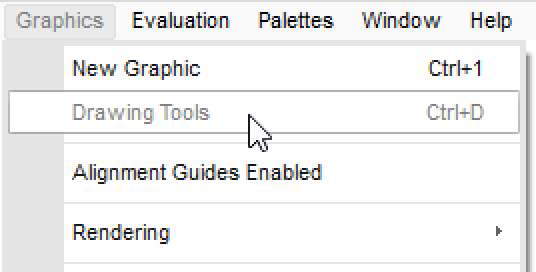
Open the palette by choosing Graphics ▶ Drawing Tools:
To create a new graphic, click the new graphic button ![]() in the Drawing Tools palette. The orange box that appears in your notebook indicates that an empty graphic has been created:
in the Drawing Tools palette. The orange box that appears in your notebook indicates that an empty graphic has been created:
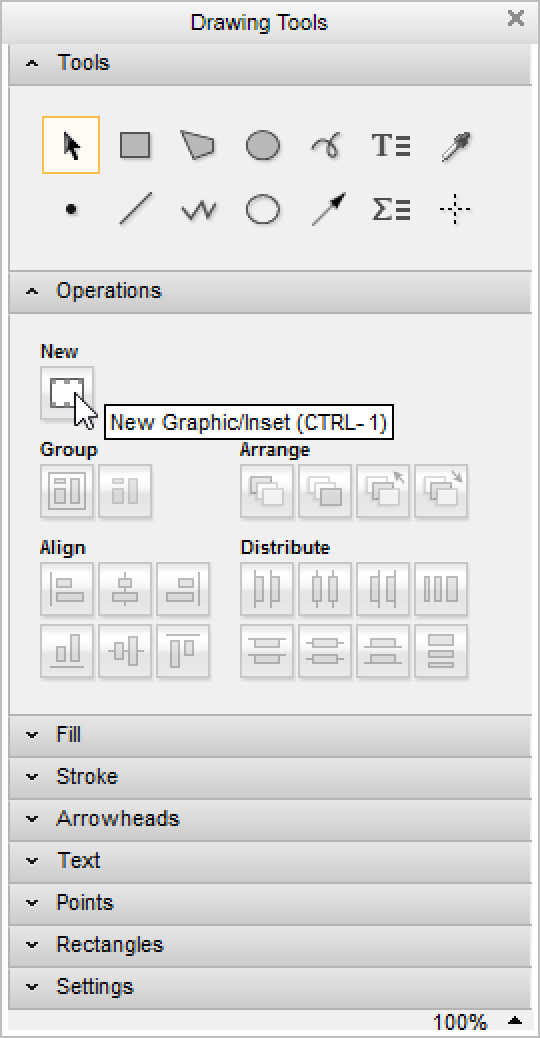
You can use the tools in the bottom pane of the palette to draw circles ![]() , rectangles
, rectangles ![]() , polygons
, polygons ![]() , freehand curves
, freehand curves ![]() , and so on in the empty graphic.
, and so on in the empty graphic.
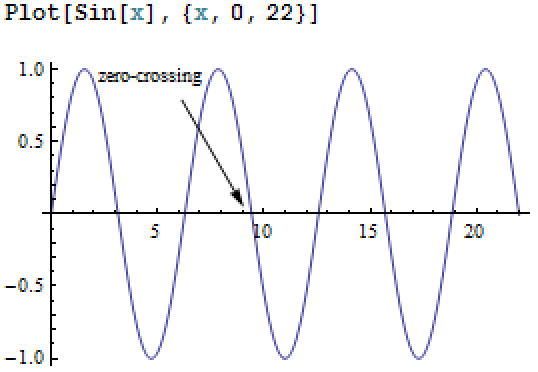
You can use the same tools to add annotations to existing graphics. Here, the text tool ![]() was used to add text to the plot, and the arrow tool
was used to add text to the plot, and the arrow tool ![]() was used to draw attention to an area of interest:
was used to draw attention to an area of interest:
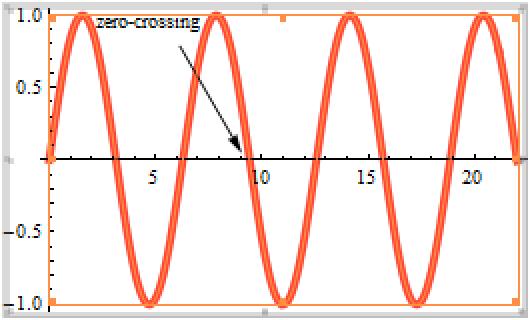
You can also change the attributes of graphics, such as color, thickness, and arrowhead shape using the Drawing Tools palette.
Click the object whose attributes you want to change, and then use the controls under the Stroke section to change thickness, color, or other attributes. Here, the sine curve was clicked and then changed to a thick red line:
When you draw a new graphic, it uses the attributes you have previously set.
If you draw a rectangle over the text added to the plot earlier, it uses the same red color the sine curve was changed to, and blocks the text.
With the rectangle selected, select Move to Back in the Graphics menu to display the rectangle behind the text.