Create and deploy an API to the cloud to automatically generate a report using data provided to it.
Without Formatting ...
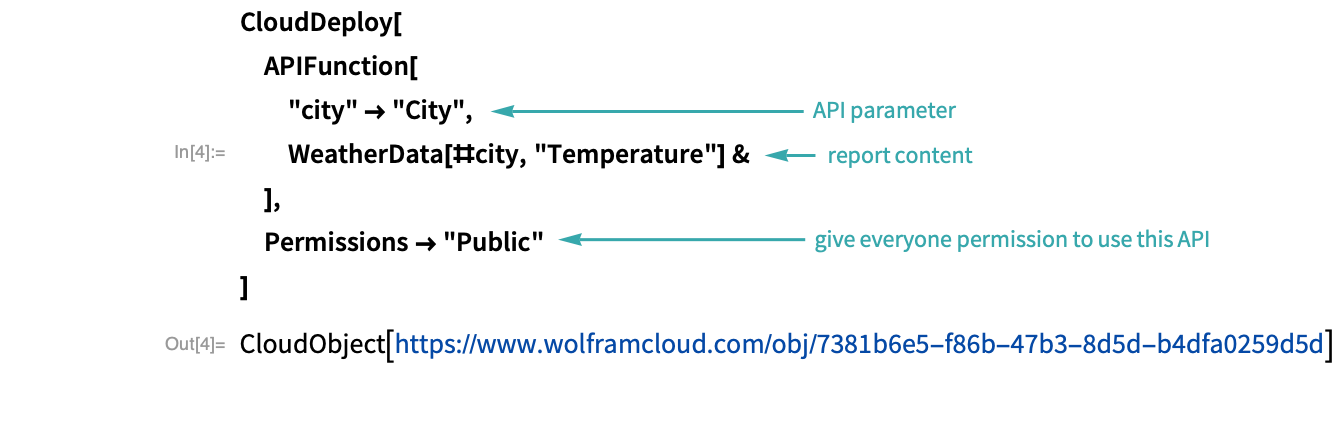
Create a simple report API
Use APIFunction to create an API that reports the temperature in a city:

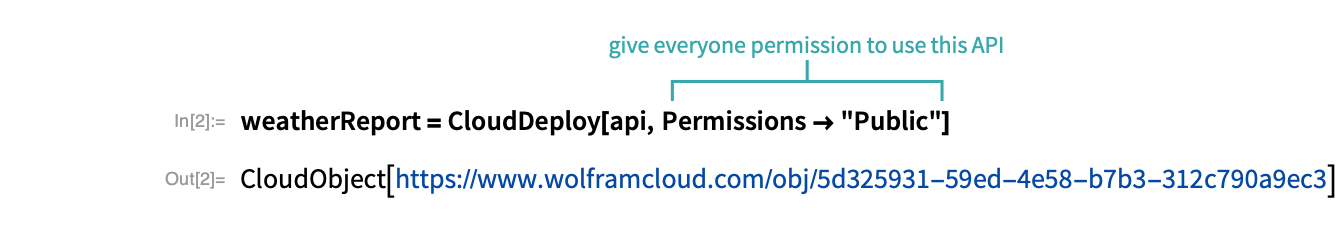
Deploy the API
Deploy the API to the Wolfram Cloud:
Generate a report using the API
Provide the name of a city as an argument to the API to generate a report for that city:
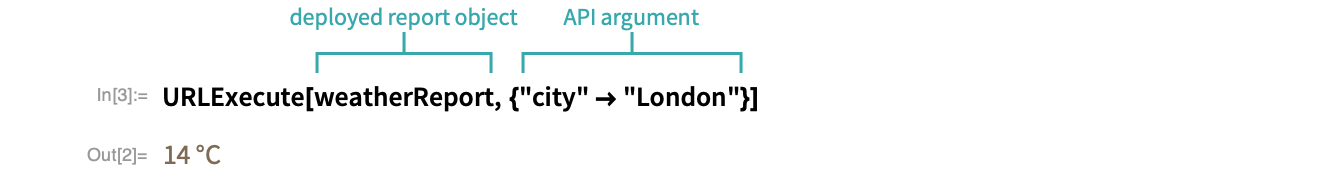
- Numerical output with units is returned as a Quantity.
With Formatting and Default Values...
Start with a basic report API
This API gives an unformatted report of the temperature in a city:
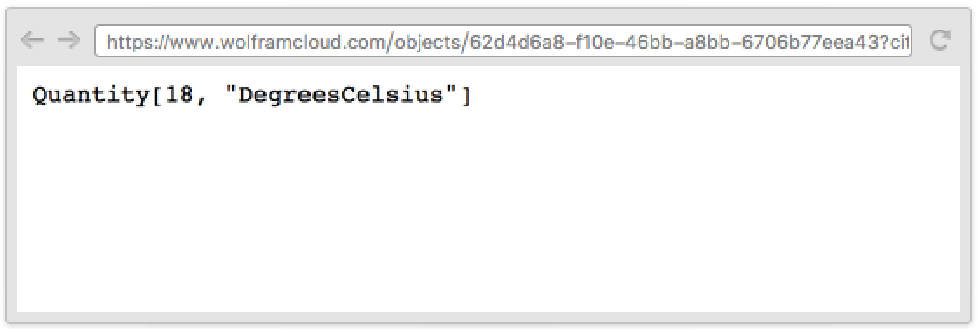
Click the URL in the CloudObject output and append “city=London” to the URL in the browser to get the temperature in London:
Add a default value
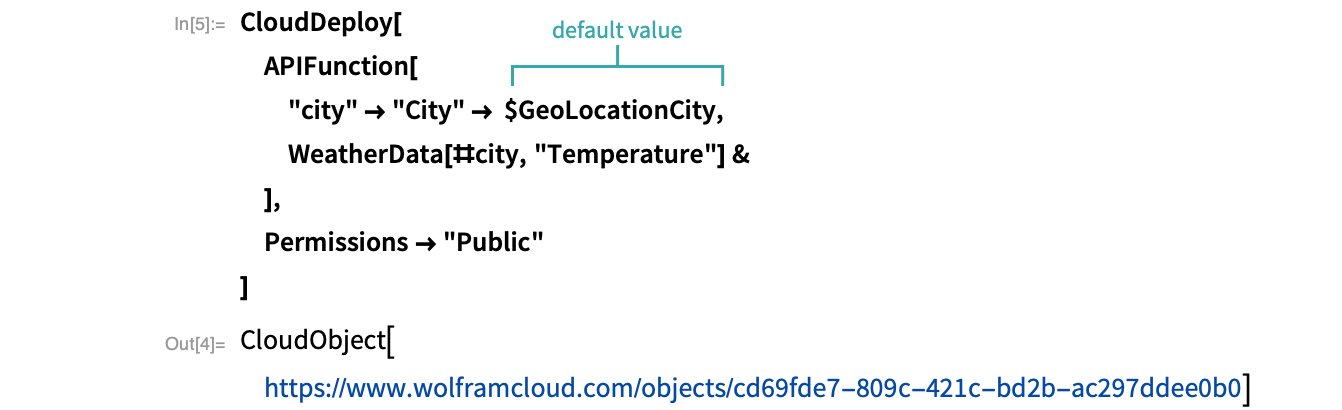
Specify a default value for “city” of $GeoLocationCity so that when the API is used without an argument, it defaults to your city:
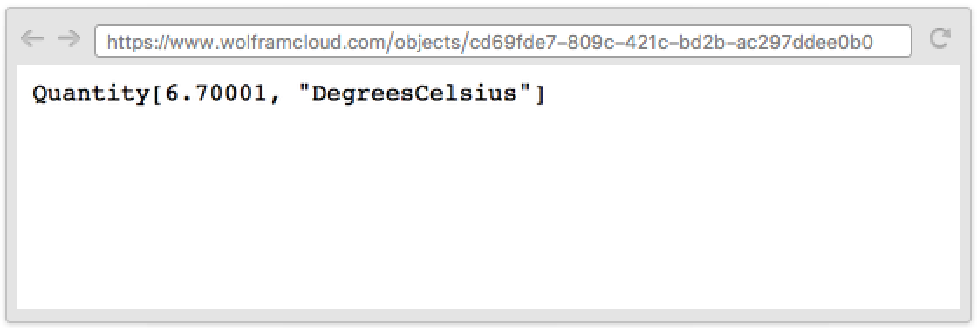
Now clicking the URL in the CloudObject output immediately gives you the temperature in your city, without your having to specify it explicitly in the URL:
Add explanatory headers and text
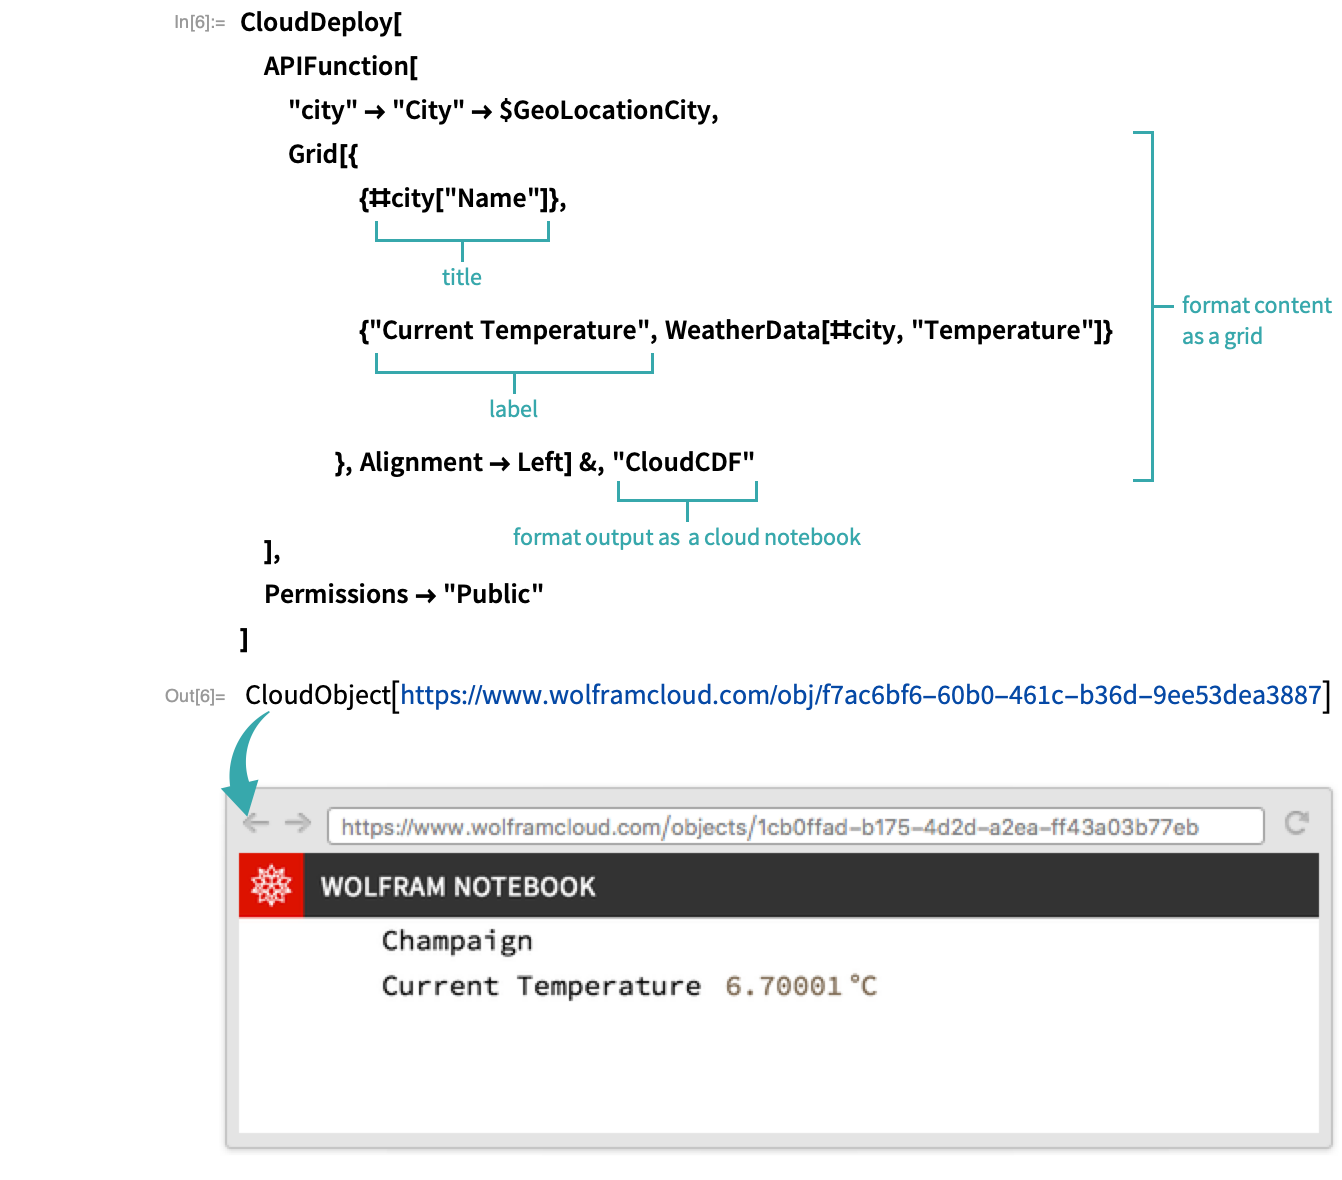
Add a title and label to the report contents, organizing the information in a grid. Specify "CloudCDF" as the output format to get a report as a notebook in the cloud:
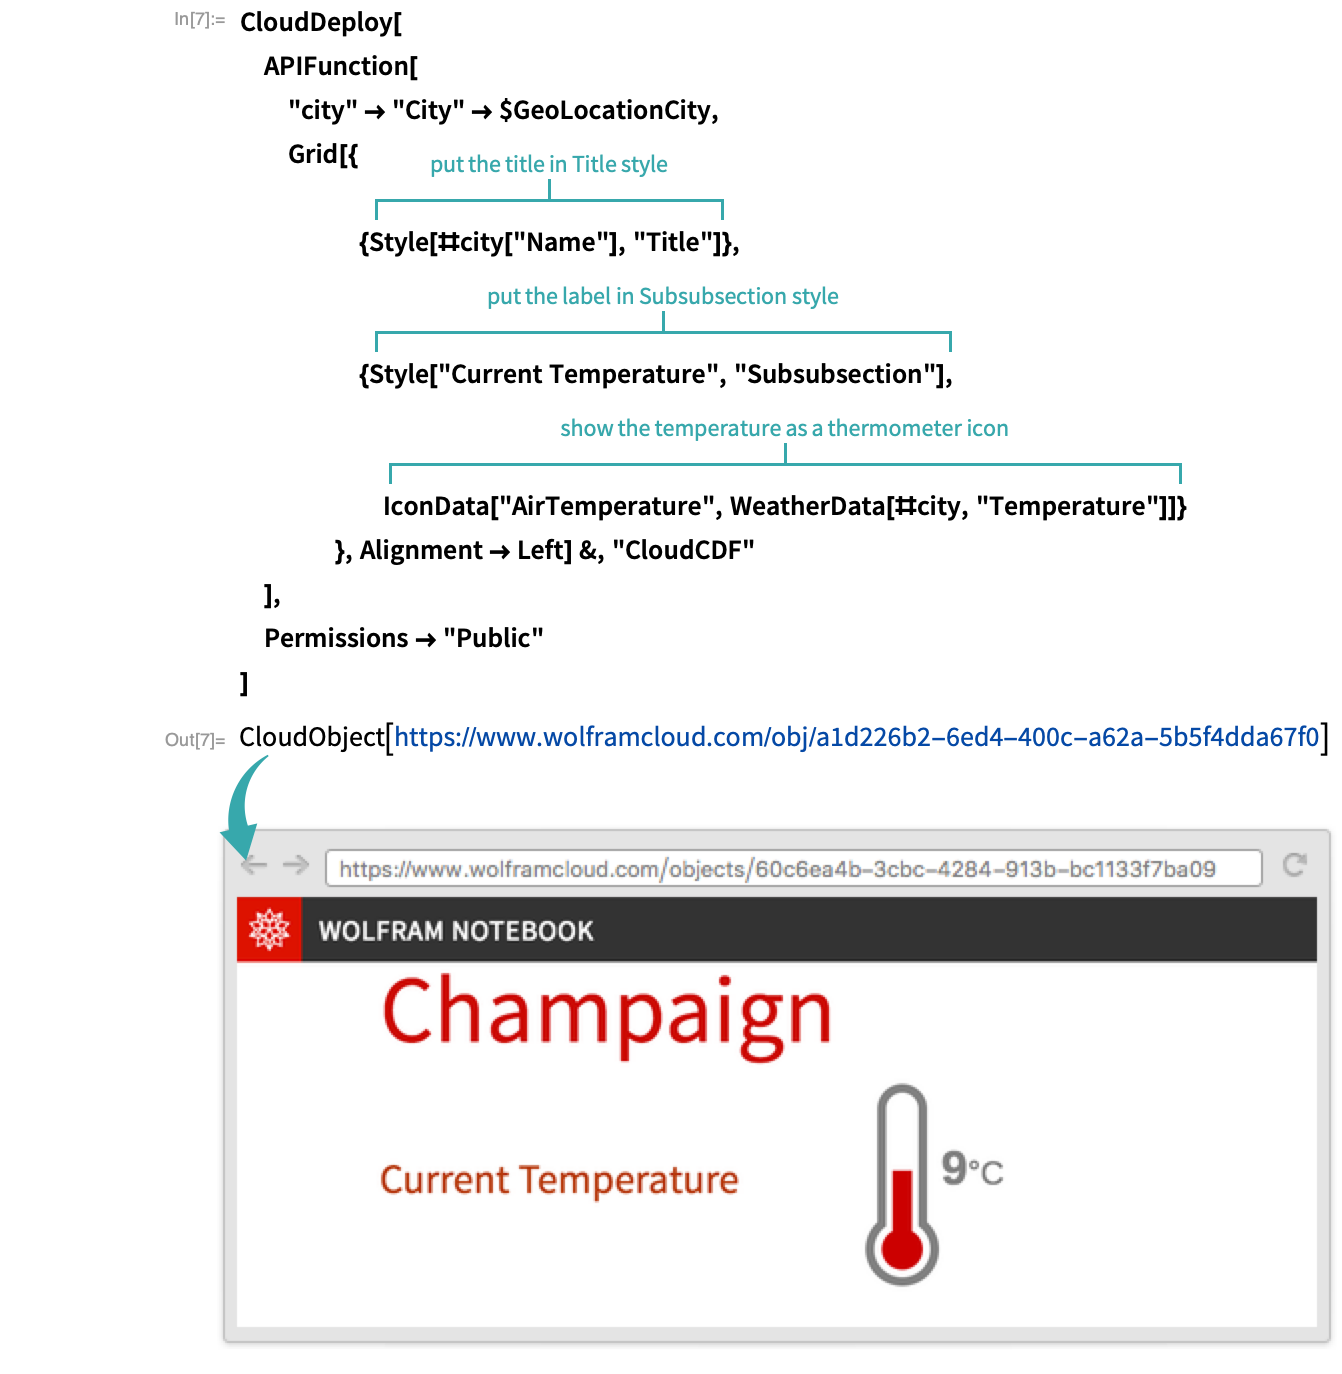
Add styling and graphics to the report
Add Style directives and a thermometer icon to the report to make it more readable: