How to | Rotate, Zoom, and Pan Graphics
One of the most powerful aspects of graphics in the Wolfram System is their interactivity. Rotating, zooming, and panning your graphics allows for a more complete visualization experience by letting you understand images from every angle and present them from the very best viewpoint.
Selected examples from the video:
Evaluate the following command to produce a 3D graphic that you can use for rotating, zooming, and panning:
Plot3D[Im[ArcSin[(x + I y) ^ 4]], {x, -2, 2}, {y, -2, 2}, Mesh -> None, PlotStyle -> Directive[Yellow, Specularity[White, 20], Opacity[0.8]], ExclusionsStyle -> {None, Red}]To rotate a 3D graphic, mouse over the graphic until the cursor changes to indicate that rotation is possible, then click and drag.
When rotation is possible, the cursor will look like this:
Rotating from side to side moves the graphic around the ![]() axis, while rotating up and down makes the
axis, while rotating up and down makes the ![]() axis tumble. This corresponds to changing the ViewPoint option.
axis tumble. This corresponds to changing the ViewPoint option.
You can enable other actions by using modifier keys. As with rotating, the mouse is used to drive these interactions.
For example, press ![]() to enable zooming. When zooming is enabled, the cursor over a 3D graphic will look like this:
to enable zooming. When zooming is enabled, the cursor over a 3D graphic will look like this:
Zooming interactively corresponds to changing the ViewAngle option.
You can also translate the graphic by panning. Press ![]() to enable panning. When panning is enabled, the cursor over a 3D graphic will look like this:
to enable panning. When panning is enabled, the cursor over a 3D graphic will look like this:
With panning enabled, press and hold the mouse button and drag to translate the position of the graphic. This corresponds to changing the 2D component of the ViewCenter option.
Some graphics, such as those generated by ParametricPlot3D, offer an additional rotation mode when the cursor is positioned in the corner of the graphic.
As before, evaluate the following command to generate a 3D graphic that you can use to try out this additional rotation mode:
ParametricPlot3D[{{4 + (3 + Cos[v])Sin[u], 4 + (3 + Cos[v])Cos[u], 4 + Sin[v]}, {8 + (3 + Cos[v])Cos[u], 3 + Sin[v], 4 + (3 + Cos[v])Sin[u]}}, {u, 0, 2Pi}, {v, 0, 2Pi}, PlotStyle -> {Red, Green}]Position your cursor in the corner of the graphic to enable the additional rotation mode, as shown in this screen shot:
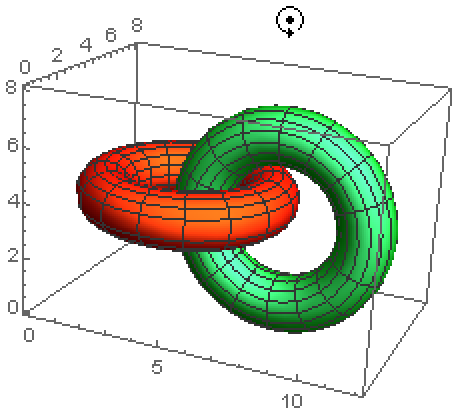
Now press and hold the mouse button, then drag in a circular motion. This corresponds to changing the ViewVertical option.
Combining these interactive methods for viewing 3D graphics is an effective way to visualize specific regions of interest in your graphics.