

HjorthDistribution
HjorthDistribution[m,s,f]
位置母数 m,尺度母数 s,形状母数 f のHjorth分布を表す.
詳細
- HjorthDistributionは,信頼性解析における故障のさまざまなクラスのモデル化に適用されてきた分布である.
- Hjorth分布における値
 についての生存関数は,
 については
 ,それ以外の場合は
 である.
- HjorthDistribution[m,s,f]の m および s は任意の正の実数でよく,f は任意の非負の実数でよい.
- HjorthDistribution[m,s,f]の m,s および f は,m*s および m*f が無次元となる任意の数量でよい. »
- HjorthDistributionは,Mean,CDF,RandomVariate等の関数で使うことができる.
例題
すべて開く すべて閉じる例 (3)
Plot[Table[PDF[HjorthDistribution[.8, 4, f], x], {f, {0.1, 0.5, 1.2}}]//Evaluate, {x, 0, 3}, PlotRange -> All, Filling -> Axis]Plot[Table[PDF[HjorthDistribution[m, 8, 1], x], {m, {0.1, 0.5, 1.2}}]//Evaluate, {x, 0, 1}, PlotRange -> All, Filling -> Axis]PDF[HjorthDistribution[m, s, f], x]Plot[Table[CDF[HjorthDistribution[.8, .1, f], x], {f, {0.1, 0.5, 1.2}}]//Evaluate, {x, 0, 3}, Filling -> Axis]Plot[Table[CDF[HjorthDistribution[m, 8, 1], x], {m, {0.1, 0.5, 1.2}}]//Evaluate, {x, 0, 3}, PlotRange -> All, Filling -> Axis]CDF[HjorthDistribution[m, s, f], x]Mean[HjorthDistribution[m, s, f]]Variance[HjorthDistribution[2, 47, 1 / 3]]N[%]スコープ (6)
data = RandomVariate[HjorthDistribution[2, 3, 0.1], 10 ^ 4];Show[Histogram[data, {0, 10, 0.5}, "PDF"],
Plot[PDF[HjorthDistribution[2, 3, 0.1], x], {x, 0, 10}, PlotStyle -> Thick]]sample = RandomVariate[HjorthDistribution[4, 7, 0.5], 10 ^ 3];edist = EstimatedDistribution[sample, HjorthDistribution[4, 7, f]]サンプルの密度ヒストグラムを推定分布の確率密度関数と比較する:
Show[Histogram[sample, {0, 10, 0.5}, "PDF"], Plot[PDF[edist, x], {x, 0, 10}, PlotStyle -> Thick]]FormulaGrid[list_, type_] := Grid[...]FormulaGrid[Table[Moment[HjorthDistribution[m, s, f], k], {k, 3}], M]Moment[HjorthDistribution[m, s, f], r]FormulaGrid[Table[CentralMoment[HjorthDistribution[m, s, f], k], {k, 3}], CM]FormulaGrid[Table[FactorialMoment[HjorthDistribution[m, s, f], k], {k, 3}], M]FormulaGrid[Table[Cumulant[HjorthDistribution[m, s, f], k], {k, 3}], CM]Plot[Table[HazardFunction[HjorthDistribution[m, 1, 5], x], {m, {0.7, 1.4, 4}}]//Evaluate, {x, 0, 10}, Filling -> Axis]Plot[Table[HazardFunction[HjorthDistribution[3, s, 5], x], {s, {0.1, 1, 10}}]//Evaluate, {x, 0, 10}, Filling -> Axis]Plot[Table[HazardFunction[HjorthDistribution[3, 2, f], x], {f, {0.1, 1, 3}}]//Evaluate, {x, 0, 10}, Filling -> Axis]HazardFunction[HjorthDistribution[m, s, f], x]Plot[Table[Quantile[HjorthDistribution[2, 5, f], q], {f, {2, 3, 6}}]//Evaluate, {q, 0, 1}, Filling -> Axis]母数で一定してQuantityを使うとQuantityDistributionが与えられる:
lifetime𝒟 = HjorthDistribution[Quantity[98.3, "Months"], Quantity[41, 1 / "Months"], Quantity[4.5, 1 / "Months"]]Median[lifetime𝒟]アプリケーション (5)
寿命がHjorthDistributionに従うデバイスがある.このデバイスの信頼性を求める:
SurvivalFunction[HjorthDistribution[m, s, f], t]Mean[HjorthDistribution[m, s, f]]hf[m_, s_, f_] := HazardFunction[HjorthDistribution[m, s, f], t]bathtub = hf[2, 5, 2];
incr = hf[1.7, 1 / 7, 2];
decr = Limit[hf[m, 2, 2], m -> Infinity];
const = Limit[Limit[hf[m, s, 2], m -> Infinity], s -> 0];Plot[{bathtub, incr, decr, const}, {t, 0, 8}, PlotLegends -> {"bathtub", "increasing", "decreasing", "constant"}]ある部品の故障は,母数が 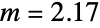 ,
 ,
 のHjorthDistributionで説明することができる.この部品が最初の1年以内に故障する確率を求める:
𝒟 = QuantityDistribution[HjorthDistribution[2.17, 9.03, 0.17], "Years"];Probability[x ≤ Quantity[1, "Year"], x𝒟]Plot[PDF[𝒟, Quantity[t, "Years"]], {t, 0, 8}, Filling -> Axis]Quantity[First@FindArgMax[QuantityMagnitude@PDF[𝒟, Quantity[t, "Years"]], t], "Years"]Mean[𝒟]この部品が90%の安全性で故障を免れるのはどのくらいの期間であるかを求める:
InverseSurvivalFunction[𝒟, 0.9]NProbability[x ≥ Quantity[3, "Years"]x ≥ Quantity[2, "Years"], x𝒟]これと類似する独立した30個の部品の故障時のシミュレーションを行う:
ListPlot[{RandomVariate[𝒟, 30], {{0, Mean[𝒟]}, {30, Mean[𝒟]}}}, Joined -> {False, True}, Filling -> Axis, AxesLabel -> Automatic]生産過程における品質変化のランダム性のために,ある電子装置の部品は初期故障率が高くなっている.この部品の寿命は,母数が  ,
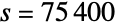 ,
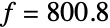 のHjorthDistributionでモデル化できる.ハザード関数をプロットする:
𝒟 = QuantityDistribution[HjorthDistribution[6, 75400, 800.8], "Years"];Plot[HazardFunction[𝒟, Quantity[t, "Years"]], {t, 0, 2}, Filling -> Axis]Mean[𝒟]Probability[t ≤ Quantity[1, "Year"], t𝒟]早い時期の故障を避けるため,この装置は「バーンイン」期間中は応力水準で運転される.期間後は1年目の故障確率が半減する「バーンイン」期間を求める:
eqn = (CDF[𝒟, Quantity[1, "Years"] + Quantity[bp, "Years"]] - CDF[𝒟, Quantity[bp, "Years"]]) / (1 - CDF[𝒟, Quantity[bp, "Years"]]) == CDF[𝒟, Quantity[1, "Years"]] / 2;Solve[{eqn, 0 < bp < 1}, bp]//QuietburnIn = Quantity[bp /. First[%], "Years"]UnitConvert[burnIn, "Days"]「バーンイン」期間に故障を免れた後の,この装置の期待される寿命を求める:
NExpectation[tt ≥ burnIn, t𝒟]maxRel = Quantity[ArgMin[{HazardFunction[𝒟, Quantity[t, "Years"]], t > 0}, t], "Years"]これと類似した装置の独立した50の部品について故障時のシミュレーションを行う:
ListPlot[{RandomVariate[𝒟, 50], {{0, Mean[𝒟]}, {50, Mean[𝒟]}}, {{0, maxRel}, {50, maxRel}}}, Joined -> {False, True, True}, Filling -> Axis, AxesLabel -> Automatic, PlotLegends -> {"Simulated", "Mean", "'Infant mortality' zone"}]独立した3つの部品からなる比較的単純な機械系がある.部品の2つはタイプAで1つはタイプBである.測定された故障時(単位:日)は次のようになる:
compA = WeightedData[Automatic, {{2.981404513903204, 0.5168657254928053, 4.817574310667597,
   2.251404494427119, 2.600964244987795, 3.9249944934780108, 4.692482778918926, 2.573280108286907,
   3.986933723430509, 4.06761198577694, 4.521085806658003, 6.70 ...  1, 1, 1, 1, 1, 1, 1, 1, 1, 1, 1, 1, 1, 1, 1, 1, 1, 1, 1, 1, 1, 1, 1, 1, 1,
   1, 1, 1, 1, 1, 1, 1, 1, 1, 1, 1, 1, 1, 1, 1, 1, 1, 1, 1, 1, 1, 1, 1, 1, 1, 1, 1, 1, 1, 1, 1, 1,
   1, 1, 1, 1, 1, 1, 1, 1, 1, 1, 1, 1, 1, 1, 1, 1, 1, 1, 1, 1, 1, 1}}];
compB = WeightedData[Automatic, {{30.325585961084265, 27.513700329498764, 28.010248120775593,
   10.90353777134251, 27.52007434803306, 46.19838803147495, 56.50179419020349, 35.98911572744762,
   47.62033758291881, 49.76020651274327, 82.22210996662847, 35 ...  1, 1, 1, 1, 1, 1, 1, 1, 1, 1, 1, 1, 1, 1, 1, 1, 1, 1, 1, 1, 1, 1, 1, 1, 1,
   1, 1, 1, 1, 1, 1, 1, 1, 1, 1, 1, 1, 1, 1, 1, 1, 1, 1, 1, 1, 1, 1, 1, 1, 1, 1, 1, 1, 1, 1, 1, 1,
1, 1, 1, 1, 1, 1, 1, 1, 1, 1, 1, 1, 1, 1, 1, 1, 1, 1, 1, 1, 1, 1}}];HjorthDistributionを仮定して,両方の部品についての推定分布を求める:
estimateA = EstimatedDistribution[compA, HjorthDistribution[m, s, f]]estimateB = EstimatedDistribution[compB, HjorthDistribution[m, s, f]]Show[Histogram[{compA, compB}, 20, "PDF"], Plot[{PDF[estimateB, t], PDF[estimateA, t]}, {t, 0, 90}, PlotRange -> All, PlotStyle -> Thick, PlotLegends -> {"B", "A"}]]この系は,各タイプの部品が1つずつ動いていれば稼働する.この系の信頼性を求める:
dist = ReliabilityDistribution[(Subscript[a, 1]∨Subscript[a, 2])∧b, {{Subscript[a, 1], estimateA}, {Subscript[a, 2], estimateA}, {b, estimateB}}];Plot[SurvivalFunction[dist, t], {t, 0, 10}, Filling -> Axis]Mean[dist]Probability[t <= 3, tdist]独立した3つの部品からなる比較的単純な機械系がある.部品の2つはタイプAで1つはタイプBである.この系は,各タイプの部品が1つずつ動いていれば稼働する.各部品の故障時は次の分布に従う:
distA = QuantityDistribution[HjorthDistribution[2.7, 1.34, 0.001], "Days"];
distB = QuantityDistribution[HjorthDistribution[31, 0.02, 0.002], "Days"];
タイプBの部品が故障する前にタイプAの部品が両方とも故障する確率を求める:
NProbability[a1 < b∧a2 < b, {a1distA, a2distA, bdistB}]タイプAの部品は,故障するたびにすぐに交換される.タイプBの部品が故障する前に必要となるタイプAの部品の平均数を求める:
Floor[2Mean[distB] / Mean[distA]]distExt[j_] := ReliabilityDistribution[Or@@Table[Subscript[a, i], {i, j}]∧b, Table[{Subscript[a, i], distA}, {i, j}]~Join~{{b, distA}}];means = Table[{j, Mean[distExt[j]]}, {j, 2, 10}];Grid[Prepend[means, {"# of components A", "Expected lifetime"}], Alignment -> Bottom, Frame -> All, Background -> {{None, None}, {LightGray, None}}]ListPlot[means, Filling -> Axis, AxesLabel -> Automatic]特性と関係 (5)
Hjorth分布は,正の因数によるスケーリングの下では閉じている:
TransformedDistribution[k * u, uHjorthDistribution[m, s, f]]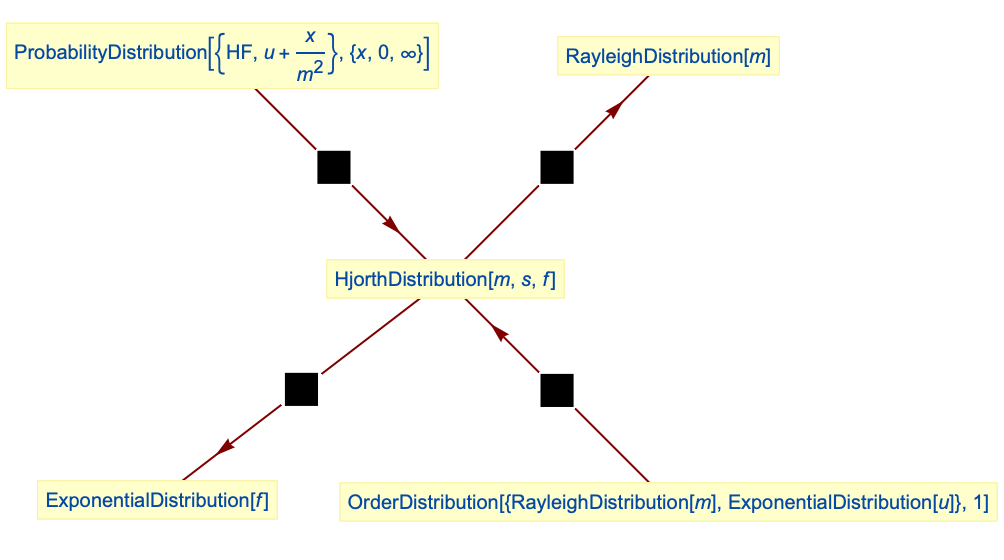
Hjorth分布を簡約するとRayleighDistributionになる:
PDF[HjorthDistribution[m, s, 0], x]PDF[RayleighDistribution[m], x]Simplify[% - %%]Hjorth分布は,初期故障率がGammaDistributionに従う線形ハザード率のParameterMixtureDistributionとして得ることができる:
lhr[u_, m_] := ProbabilityDistribution[{"HF", u + x / m ^ 2}, {x, 0, ∞}]𝒟 = ParameterMixtureDistribution[lhr[u, m], uGammaDistribution[f / s, s]];CDF[𝒟, x]CDF[HjorthDistribution[m, s, f], x]Simplify[% - %%]線形ハザード率分布は,ExponentialDistributionおよびRayleighDistributionのOrderDistributionとして得ることができる:
distOrd = OrderDistribution[{RayleighDistribution[m], ExponentialDistribution[u]}, 1];Simplify[PDF[lhr[u, m], x] - PDF[distOrd, x], Assumptions -> x > 0]ExponentialDistributionはHjorth分布の極限ケースである:
Limit[Limit[PDF[HjorthDistribution[m, s, f], x], s -> 0], m -> ∞]PDF[ExponentialDistribution[f], x]Simplify[% - %%]考えられる問題 (5)
HjorthDistributionは,m あるいは s が正の実数でなければ定義されない:
Mean[HjorthDistribution[3 + I, 1, 2]]
HjorthDistributionは,f が非負の実数ではない場合は定義されない:
Mean[HjorthDistribution[3, 1, -2]]
記号出力に無効なパラメータを代入すると,意味のない結果が与えられる:
Mean[HjorthDistribution[m, s, f]] /. {m -> 2, s -> 1 - I, f -> -1}//NCharacteristicFunction[HjorthDistribution[m, s, f], t]CharacteristicFunction[HjorthDistribution[1.3, 3.2, 4], .5]CharacteristicFunction[HjorthDistribution[13 / 10, 32 / 10, 4], 1 / 2]N[%]Hjorth分布のモーメントの閉じた形を使うと,パラメータによっては数値的な不安定さを招くことがある:
mom = Moment[HjorthDistribution[1, 1 / 10, 5], 10]N[%]厳密ではないパラメータを使ってモーメントの数値近似を求める:
Moment[HjorthDistribution[1, 0.1, 5], 10]Block[{$MaxExtraPrecision = 100}, N[mom /. {m -> 1, s -> 1 / 10, f -> 5, r -> 10}, 16]//Re]おもしろい例題 (1)
dist = HjorthDistribution[1.3, s, 1 / 4];cdf = Function[{x, s}, Evaluate[CDF[dist, x]]];
ql = {0.025, 0.10, 0.25, 0.5, 0.75, 0.90, 0.975};
cl = Table[ColorData["Rainbow"][q], {q, Join[{0.0}, ql]}];Legended[Plot3D[PDF[dist, x], {x, 0, 4}, {s, 0.01, 10}, PlotTheme -> "Marketing", MeshFunctions -> {cdf}, Mesh -> {ql}, MeshStyle -> GrayLevel[0.8], MeshShading -> cl, AxesLabel -> Automatic, BaseStyle -> Opacity[0.9], ImageSize -> 400, PlotRange -> All, PlotPoints -> 50], BarLegend["Rainbow", ql, LegendLabel -> "prob"]]テキスト
Wolfram Research (2017), HjorthDistribution, Wolfram言語関数, https://reference.wolfram.com/language/ref/HjorthDistribution.html.
CMS
Wolfram Language. 2017. "HjorthDistribution." Wolfram Language & System Documentation Center. Wolfram Research. https://reference.wolfram.com/language/ref/HjorthDistribution.html.
APA
Wolfram Language. (2017). HjorthDistribution. Wolfram Language & System Documentation Center. Retrieved from https://reference.wolfram.com/language/ref/HjorthDistribution.html