

ZTest
詳細とオプション
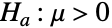
- ZTestは,帰無仮説
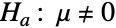
 と対立仮説
 で検定を行う.
-


data 

{data1,data2} 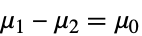
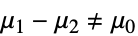
- ただし,μiは dataiの母平均である.
- デフォルトで確率値あるいは
 値が返される.
 値が小さいということは,
 が真である可能性は少ないということである.
- dspec のデータは,一変量{x1,x2,…}あるいは多変量{{x1,y1,…},{x2,y2,…},…}になりうる.
- 1つのデータ集合について,引数 σ2は,任意の正の実数,あるいは data の次元に等しい次元を持つ正定値行列でよい.
- 2つのデータ集合について,引数 σ2は,任意の正の実数,dspec の次元に等しい次元を持つ正定値行列,あるいは2つのそのような数字か行列のいずれかでよい.
- 引数 μ0は,実数,あるいはデータの次元に等しい長さを持つ実ベクトルでよい.
- ZTestは,data が正規分布に従い,分散が既知でデータから推定されないと仮定する.
- 分散あるいは共分散の行列が与えられない場合には,ZTestはサンプル推定値を既知の分散あるいは共分散として扱う.
- ZTest[dspec,σ2,μ0,"HypothesisTestData"]は,形式 htd["property"]を使って追加の検定結果と特性を抽出するのに使えるHypothesisTestDataオブジェクト htd を返す.
- ZTest[dspec,σ2,μ0,"property"]を使って"property"の値を直接与えることができる.
- 検定結果のレポートに関連する特性
-
"DegreesOfFreedom" 検定の自由度 "PValue"  値のリスト
"PValueTable"  値のフォーマットされた表
"TestData" 検定統計と  値のペアのリスト
"TestDataTable"  値と検定統計のフォーマット化された表
"TestStatistic" 検定統計のリスト "TestStatisticTable" 検定統計のフォーマット化された表 - 既知の分散 σ2が与えられていない場合には,ZTestは,サンプル分散が一変量データの既知の分散であると仮定して
 検定を行い,サンプル共分散が多変量データの既知の共分散であると仮定してHotellingの
 検定を行う.
- オプション
-
AlternativeHypothesis "Unequal" 対立仮説のための不等式 SignificanceLevel 0.05 診断とレポートの切捨て VerifyTestAssumptions All どの仮定を確かめるのか - 位置の検定については,
 のときに限り
 が拒絶されるように切捨て
 が選ばれる."TestConclusion"および"ShortTestConclusion"の特性に使われる
 の値は,SignificanceLevelオプションで制御される.この値
 は,正規性,等分散,対称性の検定を含む仮定の診断検定にも使われる.デフォルトで
 は0.05に設定される.
- ZTestにおけるVerifyTestAssumptionsの名前付き設定
-
"Normality" すべてのデータが正規分布に従うことを確かめる
例題
すべて開く すべて閉じる例 (4)
data = RandomVariate[NormalDistribution[], 100];ZTest[data, 1]SmoothHistogram[data]Mean[data]既知の分散が4と16であると仮定して2つの母集団の平均を比べる:
data1 = RandomVariate[NormalDistribution[0, Sqrt[4]], 1000];
data2 = RandomVariate[NormalDistribution[2, Sqrt[16]], 1000];ZTest[{data1, data2}, {4, 16}]SmoothHistogram[{data1, data2}]data1 = RandomVariate[MultinormalDistribution[{1, 2, 3}, IdentityMatrix[3]], 1000];
data2 = RandomVariate[MultinormalDistribution[{1, 2, 3.1}, IdentityMatrix[3]], 2500];ZTest[{data1, data2}, IdentityMatrix[3]]data = RandomVariate[MultinormalDistribution[{3, 2, 1}, IdentityMatrix[3]], 10^2];Mean[data] - {1, 2, 3}ZTest[data, IdentityMatrix[3], {1, 2, 3}]スコープ (17)
検定 (14)
data = RandomVariate[NormalDistribution[], 100];ZTest[data, 1]既知の分散を Automaticに設定することは,サンプル分散を使うことに等しい:
data = RandomVariate[NormalDistribution[], 100];ZTest[data, Variance[data]]ZTest[data, Automatic]2つの群について1つの共通の分散を指定するか,分散のリストを与えるかする:
data1 = RandomVariate[NormalDistribution[0, 1], 100];
data2 = RandomVariate[NormalDistribution[0, 1.5], 100];ZTest[{data1, data2}, 1]ZTest[{data1, data2}, {1, 1.5^2}]data1 = RandomVariate[BinormalDistribution[.5], 100];
data2 = RandomVariate[BinormalDistribution[.25], 100];ZTest[{data1, data2}, Covariance[BinormalDistribution[.5]]]ZTest[{data1, data2}, {Covariance[BinormalDistribution[.5]], Covariance[BinormalDistribution[.25]]}]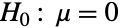
data1 = RandomVariate[NormalDistribution[0, 1], 500];
data2 = RandomVariate[NormalDistribution[3, 1], 500];
ZTest[data1, 1]
TTest[data2, 1]Automaticを使うことは,ゼロの平均について検定することと同じである:
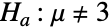
data = RandomVariate[NormalDistribution[0, 1], 500];ZTest[data, 1, 0]ZTest[data, 1, Automatic]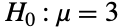
data1 = RandomVariate[NormalDistribution[3, 1], 500];
data2 = RandomVariate[NormalDistribution[0, 1], 200];
ZTest[data1, 1, 3]
ZTest[data2, 1, 3]多変量母集団の平均ベクトルがゼロベクトルであるかどうかを検定する:
data = RandomVariate[MultinormalDistribution[{.1, 0, -.05, 0}, IdentityMatrix[4]], 10^3];ZTest[data, IdentityMatrix[4]]ZTest[data, IdentityMatrix[4], {0.1, 0, -.05, 0}]

data1 = RandomVariate[NormalDistribution[0, 1], 100];
data2 = RandomVariate[NormalDistribution[1, 1], 150];
data3 = RandomVariate[NormalDistribution[0, 2], 130];
ZTest[{data1, data2}, {1, 1}]
ZTest[{data1, data3}, {1, 4}]

data1 = RandomVariate[NormalDistribution[3, 1], 135];
data2 = RandomVariate[NormalDistribution[0, 1], 100];ZTest[{data1, data2}, 1, 3]ZTest[{data2, data1}, 1, 3]2つの多変量母集団の平均差分ベクトルがゼロベクトルであるかどうかを検定する:
data1 = RandomVariate[MultinormalDistribution[{.5, 0, -.5, 0}, IdentityMatrix[4]], 122];data2 = RandomVariate[MultinormalDistribution[{-.5, 0, .5, 0}, IdentityMatrix[4]], 135];ZTest[{data1, data2}, IdentityMatrix[4]]ZTest[{data1, data2}, IdentityMatrix[4], {1, 0, -1, 0}]繰り返し特性を抽出するためにHypothesisTestDataオブジェクトを作成する:
data = RandomVariate[NormalDistribution[], {2, 10^4}];ℋ = ZTest[data, 1, 0, "HypothesisTestData"];ℋ["Properties"]HypothesisTestDataオブジェクトから特性を抽出する:
data = RandomVariate[NormalDistribution[], {2, 10^4}];ℋ = ZTest[data, 1, 0, "HypothesisTestData"];
ℋ["PValue"]ℋ["TestStatistic"]data = RandomVariate[NormalDistribution[], {2, 10^4}];ℋ = ZTest[data, 1, 0, "HypothesisTestData"];
ℋ["PValue", "TestStatistic"]レポート (3)
data = RandomVariate[NormalDistribution[], {2, 20}];ℋ = ZTest[data, 1, 0, "HypothesisTestData"];ℋ["TestDataTable"]data = RandomVariate[NormalDistribution[], {1000, 25}];res = Table[Quiet@ZTest[i, 1, 0, "TestData"], {i, data}];ListPlot[res, FrameLabel -> {"Z", "p-value"}, Frame -> True, PlotRange -> All]
data = RandomVariate[NormalDistribution[], {2, 10^2}];ℋ = ZTest[data, 1, 0, "HypothesisTestData"];ℋ["PValueTable"]
ℋ["PValue"]ℋ["TestStatisticTable"]ℋ["TestStatistic"]オプション (9)
AlternativeHypothesis (3)
data = RandomVariate[NormalDistribution[], 100];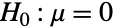
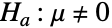
ZTest[data, 1, 0, AlternativeHypothesis -> "Unequal"]ZTest[data, 1, 0, AlternativeHypothesis -> Automatic]data = RandomVariate[NormalDistribution[], 100];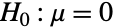
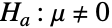
ZTest[data, 1, 0, AlternativeHypothesis -> "Unequal"]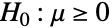
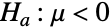
ZTest[data, 1, 0, AlternativeHypothesis -> "Less"]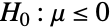
ZTest[data, 1, 0, AlternativeHypothesis -> "Greater"]data1 = RandomVariate[NormalDistribution[2.9, 1], 1000];
data2 = RandomVariate[NormalDistribution[0, 1], 1000];Mean[data1] - Mean[data2]



ZTest[{data1, data2}, 2, 3, AlternativeHypothesis -> "Less"]



ZTest[{data1, data2}, 2, 2.9, AlternativeHypothesis -> "Less"]SignificanceLevel (2)
data = BlockRandom[SeedRandom[2];RandomVariate[StudentTDistribution[3], 50]];ZTest[data, 3, 0, SignificanceLevel -> .0001]ZTest[data, 3, 0]
有意水準は"TestConclusion"と"ShortTestConclusion"にも使われる:
BlockRandom[SeedRandom[1];data = RandomVariate[NormalDistribution[0, 1], 100]];Mean[data]ℋ1 = ZTest[data, 1, .2, "HypothesisTestData", SignificanceLevel -> .1];ℋ2 = ZTest[data, 1, .2, "HypothesisTestData", SignificanceLevel -> .005];ℋ1["TestConclusion"]//TraditionalFormℋ2["TestConclusion"]//TraditionalFormℋ1["ShortTestConclusion"]ℋ2["ShortTestConclusion"]VerifyTestAssumptions (4)
data1 = RandomVariate[NormalDistribution[0, 1], 100];
data2 = RandomVariate[NormalDistribution[0, 2], 100];ZTest[{data1, data2}, {1, 4}, 0, VerifyTestAssumptions -> None]ZTest[{data1, data2}, {1, 4}, 0, VerifyTestAssumptions -> "Normality"]ZTest[{data1, data2}, {1, 4}, 0, VerifyTestAssumptions -> All]data = RandomVariate[CauchyDistribution[0, 1], 100];ZTest[data, 1, 0, VerifyTestAssumptions -> None]ZTest[data, 1, 0, VerifyTestAssumptions -> All]
data = RandomVariate[MultinormalDistribution[{0, 0, 0}, IdentityMatrix[3]], 10 ^ 4];ZTest[data, IdentityMatrix[3], Automatic, "TestDataTable", VerifyTestAssumptions -> All]//AbsoluteTimingZTest[data, IdentityMatrix[3], Automatic, "TestDataTable", VerifyTestAssumptions -> None]//AbsoluteTimingシミュレーションを行う場合は,診断検定を行わないようにすると有益であることが多い:
data = RandomVariate[NormalDistribution[], {1000, 100}];AbsoluteTiming[T = Quiet@ZTest[#, 1, Automatic, "TestStatistic"]& /@ data;]検定の仮定は意図的に有効になっているので,時間が大幅に節約できる:
AbsoluteTiming[T2 = ZTest[#, 1, Automatic, "TestStatistic", VerifyTestAssumptions -> None]& /@ data;]SmoothHistogram[{T, T2}]アプリケーション (1)
ある工場が2つの別々のラインで10インチのヒューズケーシングを作っている.これらのケーシングの長さは,0.005平方インチの既知の分散を持つ.品質管理検定で,25個のケーシングを2つのラインのそれぞれからランダムに選ぶ.10インチからの有意偏差がある場合には,ラインは閉鎖され,再調整される:
sample1 = QuantityArray[{9.9001, 9.878, 9.982, 9.9628, 10.0053, 10.1056, 10.0212, 10.0037, 9.905, 9.898, 10.052, 10.0076, 9.9747, 10.0453, 9.9844, 9.9881, 10.0139, 9.9870, 10.0779, 10.1126, 10.0445, 9.9927, 9.9901, 10.0117, 9.9705}, "Inches"];sample2 = QuantityArray[{10.0711, 10.1043, 10.0809, 10.0456, 10.0241, 10.1772, 10.0078, 10.2123, 10.0523, 10.1894, 10.1357, 10.1753, 10.1479, 10.2104, 10.085, 10.1268, 10.0214, 10.1708, 10.0627, 10.0506, 10.0398, 10.0476, 10.1446, 10.0742, 10.1573}, "Inches"];SmoothHistogram[{sample1, sample2}//QuantityMagnitude]第1ラインは期待通りに作動するが,第2ラインを再調整する必要がある:
ZTest[sample1, Quantity[0.005, "Inches"^2], Quantity[10, "Inches"]]ZTest[sample2, Quantity[0.005, "Inches"^2], Quantity[10, "Inches"]]工場の機械が長期使用されるとより長いケーシングを製造することが知られているとする.片側対立仮説"Greater"が適切である:
ZTest[sample1, Quantity[0.005, "Inches"^2], Quantity[10, "Inches"], AlternativeHypothesis -> "Greater"]ZTest[sample2, Quantity[0.005, "Inches"^2], Quantity[10, "Inches"], AlternativeHypothesis -> "Greater"]特性と関係 (6)
n = 100;σ = 2;μ0 = .5;data = RandomVariate[NormalDistribution[0, σ], n];μ = Mean[data]z = (μ - μ0/Sqrt[σ^2 / n]) において,検定統計はNormalDistribution[0,1]に従う:
pvalue = 2SurvivalFunction[NormalDistribution[], Abs@z]ZTest[data, σ^2, μ0, "TestDataTable"]n = 100;Σ = {{1, -.25}, {-.25, 2}};μ0 = {.5, 2};data = RandomVariate[MultinormalDistribution[{1, 2}, Σ], n];μ = Mean[data]z = n(μ - μ0).Inverse[Σ].(μ - μ0) において,zChiSquareDistribution[p](p はデータの次元)である:
dim = Dimensions[data][[2]];SurvivalFunction[ChiSquareDistribution[dim], z]ZTest[data, Σ, μ0, "TestDataTable"]分散が指定されていない場合は,検定統計は,TTestのそれに等しい:
data = RandomVariate[NormalDistribution[], 100];ZTest[data, Automatic, 0, "TestStatistic"]//QuietTTest[data, 0, "TestStatistic"]
ZTest[data, Automatic, 0]//QuietTTest[data]μ0 = 1;data = RandomVariate[NormalDistribution[], {1000, 10}];pZ = ZTest[#, 1, μ0, VerifyTestAssumptions -> None]& /@ data;pT = TTest[#, μ0, VerifyTestAssumptions -> None]& /@ data;Probability[z < t, {z, t}EmpiricalDistribution[Transpose[{pZ, pT}]]]ZTestは,入力がTimeSeriesのときにのみ値に使うことができる:
ts = TemporalData[TimeSeries, {{{1.224578634529677, 0.47929635789978015, 0.6572781300178168,
    0.21496048742669355, 0.7299608014554928, -0.2495111111278263, -1.3286551762002712,
    0.552725018274874, 0.19272112205837066, 1.1809144012420882, -1.1671 ... 40938613662046, 1.052394590214582, 0.9345044123980388, 0.38537803109557855,
    -0.48660931166089394, -0.71203560340161}}, {{0, 100, 1}}, 1, {"Continuous", 1},
{"Discrete", 1}, 1, {ValueDimensions -> 1, ResamplingMethod -> None}}, False, 10.1];ZTest[ts]ZTest[ts["Values"]]ZTestは,入力がTemporalDataのときは,すべての値に同時に使うことができる:
td = TemporalData[Automatic, {{{-0.25275046867718637, -0.7175779198306353, -1.9370139837317764,
    0.006665621735740701, -0.3730807122324292, 0.6740106823161018, 0.8562214990564344,
    0.955785083955732, 1.7020898014886303, 1.8523009430646802, 0.244 ... 3951759101545, -1.1611722313627828, 1.1602446901533021,
    1.1052173095128992, 1.1089143920161917, -0.13837156328402}}, {{0, 100, 1}}, 2,
  {"Continuous", 2}, {"Discrete", 1}, 1, {ValueDimensions -> 1, ResamplingMethod -> None}}, False,
10.1];ZTest[td]data = td["ValueList"]//Flatten;
ZTest[data]{data1, data2} = td["ValueList"];ZTest[{data1, data2}]考えられる問題 (2)
サンプル分散が使われると,検定統計はNormalDistribution[0,1]に従わない:
data = RandomVariate[NormalDistribution[], 10];ZTest[data, Automatic, 0, "TestDataTable"]サンプル分散が使われると,TTestは適切な  値を与える:
TTest[data, 0, "TestDataTable"]データはNormalDistributionに従わなければならない:
data = RandomVariate[StudentTDistribution[3], 100];ZTest[data, 3, 0, "TestDataTable"]
データが正規分布に従わない場合は,中央値に基づく検定を使う:
SignTest[data, 0, "TestDataTable"]SignedRankTest[data, 0, "TestDataTable"]LocationTestは適切な検定を自動的に選択する:
LocationTest[data, 0, "TestDataTable"]おもしろい例題 (1)

data1 = RandomVariate[NormalDistribution[], {250, 100}];
data2 = RandomVariate[NormalDistribution[1, 2], {250, 100}];T1 = MapThread[ZTest[{#1, #2}, 1, 0, "TestStatistic", VerifyTestAssumptions -> None]&, {data1, data2}];T2 = MapThread[ZTest[{#1, #2}, 1, 2, "TestStatistic", VerifyTestAssumptions -> None]&, {data1, data2}];SmoothHistogram[{T1, T2}, Filling -> Axis, PlotLegends -> {"SubscriptBox[H, 0]は真", "SubscriptBox[H, 0]は偽"}]テキスト
Wolfram Research (2010), ZTest, Wolfram言語関数, https://reference.wolfram.com/language/ref/ZTest.html.
CMS
Wolfram Language. 2010. "ZTest." Wolfram Language & System Documentation Center. Wolfram Research. https://reference.wolfram.com/language/ref/ZTest.html.
APA
Wolfram Language. (2010). ZTest. Wolfram Language & System Documentation Center. Retrieved from https://reference.wolfram.com/language/ref/ZTest.html