"LLE" (Machine Learning Method)
- Method for DimensionReduction, DimensionReduce, FeatureSpacePlot and FeatureSpacePlot3D.
- Reduce the dimension of data using a locally linear embedding.
Details & Suboptions
- "LLE", which stands for locally linear embedding, is a nonlinear neighborhood-preserving dimensionality reduction method.
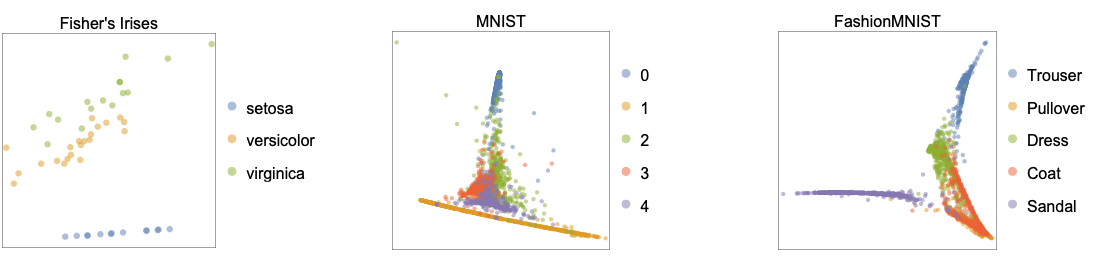
- "LLE" is able to learn nonlinear manifolds; however, it can fail if data has high-density variations and tends to collapse large portions of the data close together.
- The following plots (see FeatureSpacePlot) show two-dimensional embeddings learned by the "LLE" method applied to the benchmark datasets Fisher's Irises, MNIST and FashionMNIST:
- "LLE" seeks to find a low-dimensional embedding that locally preserves the intrinsic geometry (such as angles and relative distances) of the data. To do so, "LLE" first defines the neighborhood of each data point by its
 nearest neighbors. Then, it computes the optimal "reconstruction weights" Wij by minimizing the reconstruction error (xj is a neighbor of xi): ∑ Ni=1xi-∑jWijxj2, subject to the constraint ∑jWij=1 (this constraint enforces the invariance of Wij to rotations, rescalings and translations of the data). Once Wij are computed, the lower-dimensional embeddings
  are computed by minimizing the embedding cost: ∑ Ni=1yi-∑jWijyj2.
 - "LLE" attempts to have the same reconstruction weights in the original and embedding space, which is why the local geometric properties of the data points are approximately preserved.
- The following suboption can be given:
-
"NeighborsNumber" Automatic number of nearest neighbors 
Examples
open all close allBasic Examples (1)
Create and visualize a "Swiss roll" dataset:
SeedRandom[123];
data = Table[Insert[AngleVector[1 + {2, 8} * RandomReal[]], RandomReal[], 2], 1500];ListPointPlot3D[data, BoxRatios -> {1, 1, 1}, PlotStyle -> Directive[PointSize -> Large]]Train a nonlinear dimension reducer using "LLE" on the dataset to map to two-dimensional space:
reducer = DimensionReduction[data, 2, Method -> "LLE"]Find and visualize the data coordinates in the reduced space:
reducedpts = reducer[data];
ListPlot[Style[#, Hue[First[#] / 5]] & /@ reducedpts, AspectRatio -> 1, PlotStyle -> Directive[PointSize -> Small]]
Visualize the dataset in the original space, with each point colored according to its reduced variable:
ListPointPlot3D[Style[#, Hue[First[reducer[#]] / 5]] & /@ data, PlotStyle -> Directive[PointSize -> Large], BoxRatios -> {1, 1, 1}]Scope (1)
Dataset Visualization (1)
Load the Fisher Iris dataset from ExampleData and perform a train/test split:
SeedRandom[1234];
iris = ExampleData[{"MachineLearning", "FisherIris"}, "Data"];
{itrain, itest} = TakeDrop[RandomSample[iris], 100];
Generate a reducer function using "LLE" with the features of each training example:
diris = DimensionReduction[itrain[[All, 1]], 2, Method -> "LLE", PerformanceGoal -> "Quality"]Group test examples by their species:
byspecies = GroupBy[itest, Last -> First];Reduce the dimension of the features:
byspecies = diris /@ byspecies;Visualize the reduced dataset:
ListPlot[Values[byspecies], PlotLegends -> Keys[byspecies], PlotStyle -> Directive[PointSize[0.03], Opacity[0.5]], AspectRatio -> 1, Frame -> True]Options (1)
"NeighborsNumber" (1)
Generate a dataset of different head poses from 3D geometry data with random viewpoints:
SeedRandom[1234];
cc = RandomPoint[Circle[{0, 0}, 0.8, {Pi, 2Pi}], 50];
pp = Flatten[Table[{cc[[i, 1]], cc[[i, 2]], j}, {i, 1, Length@cc}, {j, -0.8, 0.8, 0.2}], 1];
vp = RandomSample[pp, 60];
obj = ExampleData[{"Geometry3D", "Beethoven"}];
poses = Table[Show[obj, ViewPoint -> vp[[i]]], {i, 1, Length@vp}];
imgs = Table[Rasterize[poses[[i]],   ImageResolution -> 64, ImageSize -> 50, Background -> None], {i, 1, Length@poses}];
Visualize different head poses:
RandomSample[imgs, 10]Reduce the dataset to a two-dimensional representation by specifying the "NeighborsNumber" in the neighborhood graph for performing the locally linear embedding:
red = DimensionReduce[imgs, 2, Method -> {"LLE", "NeighborsNumber" -> 9}];Visualize the original images in the reduced space, in which the up-down and front-side poses are disentangled:
Graphics[MapThread[Inset[#1, #2, {0, 0}, 0.55, Background -> None]&, {imgs, red}], ImageSize -> 300, ImagePadding -> 35, Frame -> False, AspectRatio -> 1]