


AxisObject
AxisObject[path]
is a Graphics primitive that represents an axis with a quantitative scale along the path path.
AxisObject[path,scale]
uses the scale specified by scale.
Details and Options
- AxisObject[…] represents a generalized axis that can be placed in arbitrary graphics.
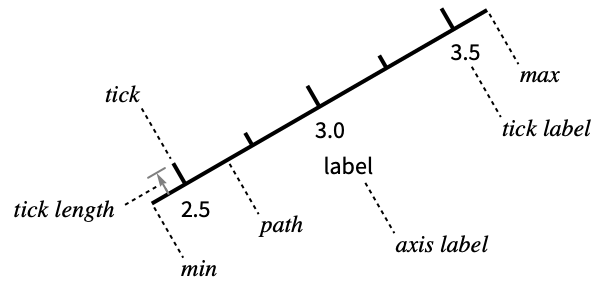
- An axis consists of a path, which determines where the axis is drawn; the scale, which controls how coordinates in the graphic are mapped to values along the path; and options that affect the detailed appearance of the axis, ticks and labels.
- Possible settings for path include:
-
{pt1,pt2} axis through the points pt1 and pt2 {"Horizontal",y0} horizontal axis through 
{"Horizontal",y0,{xmin,xmax}} horizontal axis from  to
to 
{"Vertical",x0} vertical axis through 
{"Vertical",x0,{ymin,ymax}} vertical axis from  to
to 
InfiniteLine[{pt1,pt2}] infinite axis through points pt1 and pt2 InfiniteLine[pt,v] infinite axis passing through the point pt in the direction v Line[{pt1,pt2}] finite axis from point pt1 to point pt2 Line[{pt1,…,ptn}] curve axis from point pt1 to point ptn HalfLine[{pt1,pt2}] half-axis from the point pt1 through pt2 HalfLine[pt,v] half-axis from point pt in the direction v BSplineCurve[…] axis along the given B-spline curve BezierCurve[…] axis along the given Bézier curve Circle[…] axis along the given circle or arc - Infinite forms of axes draw to the edges of the graphic.
- By default, "Horizontal" and "Vertical" axes use the natural scale where the axis values correspond to the vertical and horizontal components of the underlying graphics coordinates.
- Possible settings for scale include:
-
{val1,val2} use val1 at the start of the axis and val2 at the end {loc1val1,loc2val2} use val1 and val2 at locations loc1 and loc2 - For infinite axes, the "start" and "end" points are taken to be pt1 and pt2.
- For "Horizontal" and "Vertical" axes, the locations loci can be specified as x and y coordinates.
- The locations loci used to define the value scale for an axis do not have to be visually present in the graphic.
- If the location loci is not on the axis, it will be projected to the nearest point that is.
- Possible options for AxisObject are:
-
AxisLabel None how to label the axis AxisStyle {} how to style the axis path BaseStyle {} general style for the axis LabelStyle {} how to style labels RotateLabel False how to rotate axis labels TickDirection Automatic on which side of the axis to place ticks TickLabelOrientation None how to rotate tick labels TickLabelPositioning Automatic where to place tick labels TickLabels Automatic how to label ticks TickLengths Automatic how long to draw ticks TickPositions Automatic where to place ticks along the axis Ticks Automatic individual ticks TicksStyle {} how to style ticks - Settings for tick and label options are generally either of the form optspec, which uses spec for all the ticks and labels, or of the form opt{spec1,…,specn}, where the speci correspond to collections of settings for corresponding collections of ticks and labels.
- Axes are typically drawn with two sets of ticks: "major" ticks that are longer and have labels and "minor" ticks that are shorter and unlabeled.
- By default, axis labels are placed at the end of the axis.
- AxisLabelPlaced[label,pos] can be used to specify where the axis label should be placed.
- Placed can use the following positions pos:
-
"Start" the start of the axis "End" the end of the axis Center centered along the axis Above,Below,Before,After placed relative to the axis - Possible settings for speci for TickPositions are:
-
Automatic automatically compute ticks n use approximately n ticks {dx} use ticks that are multiples of dx {min,max,dx} use ticks from min to max in steps of dx {{t1,t2,…,tm}} use specific ticks ti - Possible settings for speci for TickLabels are:
-
Automatic automatically label ticks All include labels None omit labels {lab1,lab2,…,labm} use labi to label position ti - The Automatic setting for TickLabels is All for spec1 and None otherwise.
- The settings for speci in TickLengths are:
-
Automatic automatic lengths None omit the tick marker Scaled[s] use a scaled length Offset[s] use an absolute length "Major" use the default length for major ticks "Minor" use the default length for minor ticks Tiny,Small,Medium,Large named lengths - TickDirectiondir specifies in what direction dir the ticks should be drawn relative to the axis.
-

Automatic automatically chosen direction 
"Inward" toward the center of the graphic 
"Outward" away from the center of the graphic 
"InwardOutward" crosses over axis 
Left to the left 
Right to the right 
Up toward the top 
Down toward the bottom - TickLabelPositioningpos specifies the position pos where tick labels should be drawn relative to the tick.
- Possible settings for pos include:
-
"Base" at the base of the tick where it meets the axis 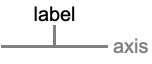
"Tip" at the tip of the tick 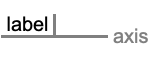
Before end of the label before the tick 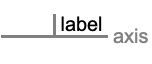
After start of the label after the tick - Possible settings for RotateLabel and TickLabelOrientation include:
-
None, "Horizontal" do not rotate labels "Vertical" rotate labels 90° counterclockwise "Parallel" rotate labels to be parallel to the axis "Perpendicular" rotate labels to be perpendicular to the axis θ rotate labels counterclockwise from horizontal by angle 
Examples
open all close allBasic Examples (4)
Graphics[AxisObject[{"Horizontal", 0}], PlotRange -> {{-2, 2}, {-1, 1}}]Limit the axis so that ![]() is between
is between ![]() and 1:
and 1:
Graphics[AxisObject[{"Horizontal", 0, {-1, 1}}], PlotRange -> {{-2, 2}, {-1, 1}}]Construct several vertical axes:
Graphics[{AxisObject[{"Vertical", 1, {0, 1}}], AxisObject[{"Vertical", 2, {0, 2}}], AxisObject[{"Vertical", 3, {0, 3}}]}, PlotRange -> {{0, 3}, {0, 3}}]Construct an axis that is 0 at the point ![]() and 1 at the point
and 1 at the point ![]() :
:
Graphics[AxisObject[Line[{{-1, -1}, {2, 2}}]], Frame -> True, PlotRange -> 3]Scope (9)
Axis Placement and Scales (6)
Use a finite line for an axis:
Graphics[AxisObject[Line[{{-1, -1}, {1, 1}}]], PlotRange -> 2]Graphics[AxisObject[Line[{{-1, -1}, {1, 1}}], {0, 10}], PlotRange -> 2]Use an infinite line through two points, whose values are 0 and 10:
Graphics[AxisObject[InfiniteLine[{{-1, -1}, {1, 1}}], {0, 10}], PlotRange -> 2]Use a point and direction to define the infinite line:
Graphics[AxisObject[InfiniteLine[{-1, -1}, {1, 1}], {0, 10}], PlotRange -> 2]Use a half-line through two points:
Graphics[AxisObject[HalfLine[{{0, 0}, {1, 1}}], {0, 10}], PlotRange -> 2]Use a point and direction to define the half-line:
Graphics[AxisObject[HalfLine[{0, 0}, {1, 1}], {0, 10}], PlotRange -> 2]Use a Bézier curve as the path for an axis:
Graphics[AxisObject[BezierCurve[{{-1, -1}, {-1, 1}, {1, 1}}]], PlotRange -> 2]Change the values at the endpoints:
Graphics[AxisObject[BezierCurve[{{-1, -1}, {-1, 1}, {1, 1}}], {0, 10}], PlotRange -> 2]Use a B-spline curve as the path for an axis:
Graphics[AxisObject[BSplineCurve[{{-1, -1}, {-1, 1}, {1, 1}}]], PlotRange -> 2]Change the values at the endpoints:
Graphics[AxisObject[BSplineCurve[{{-1, -1}, {-1, 1}, {1, 1}}], {0, 10}], PlotRange -> 2]Construct an axis along an arbitrary curve:
Graphics[AxisObject[Line[Table[{t Cos[t], t Sin[t]}, {t, 0, 5Pi, 0.1}]]]]Specify the values at the endpoints:
Graphics[AxisObject[Line[Table[{t Cos[t], t Sin[t]}, {t, 0, 5Pi, 0.1}]], {0, 10}]]Tick Placement (3)
Use approximately five ticks on the axis:
Graphics[AxisObject[{"Horizontal", 0, {-5, 5}}, TickPositions -> {5}]]Further subdivide the axis into approximately five minor ticks per major interval:
Graphics[AxisObject[{"Horizontal", 0, {-5, 5}}, TickPositions -> {5, 5}]]Place ticks at positions from ![]() to 5 in steps of 1:
to 5 in steps of 1:
Graphics[AxisObject[{"Horizontal", 0, {-5, 5}}, TickPositions -> {{-5, 5, 1}}]]Include minor ticks at multiples of 0.2:
Graphics[AxisObject[{"Horizontal", 0, {-5, 5}}, TickPositions -> {{-5, 5, 1}, {-5, 5, 0.2}}]]Place ticks at specific locations:
Graphics[AxisObject[{"Horizontal", 0, {-5, 5}}, TickPositions -> {{{-5, -2, -1, 0, 1, 2, 5}}}]]Include minor ticks at multiples of 1:
Graphics[AxisObject[{"Horizontal", 0, {-5, 5}}, TickPositions -> {{{-5, -2, -1, 0, 1, 2, 5}}, {-5, 5, 1}}, TickLabels -> {All, None}]]Options (39)
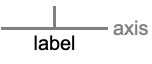
AxisLabel (4)
The label is placed at the end of the axis by default:
Graphics[AxisObject[Line[{{0, 0}, {10, 10}}], {0, 10}, AxisLabel -> "hello"]]Graphics[AxisObject[Line[{{0, 0}, {10, 10}}], {0, 10}, AxisLabel -> Placed["hello", "Start"]]]Place the label close to the axis above or below it:
{Graphics[AxisObject[Line[{{0, 0}, {10, 10}}], {0, 10}, AxisLabel -> Placed["hello", Above]]], Graphics[AxisObject[Line[{{0, 0}, {10, 10}}], {0, 10}, AxisLabel -> Placed["hello", Below]]]}{Graphics[AxisObject[Line[{{0, 0}, {10, 10}}], {0, 10}, AxisLabel -> Placed["hello", Before]]], Graphics[AxisObject[Line[{{0, 0}, {10, 10}}], {0, 10}, AxisLabel -> Placed["hello", After]]]}Center the label along the axis:
Graphics[AxisObject[Line[{{0, 0}, {10, 10}}], {0, 10}, AxisLabel -> Placed["hello", Center]]]Rotate the label to be parallel to the axis:
Graphics[AxisObject[Line[{{0, 0}, {10, 10}}], {0, 10}, AxisLabel -> Placed["hello", Center], RotateLabel -> "Parallel"]]AxisStyle (3)
AxisStyle affects only the style of the axis path:
Graphics[AxisObject[Line[{{0, 0}, {10, 10}}], {0, 10}, AxisStyle -> Blue]]AxisStyleTransparent will hide the axis curve, leaving only the ticks and labels:
Graphics[AxisObject[Line[{{0, 0}, {10, 10}}], {0, 10}, AxisStyle -> Transparent]]AxisStyle inherits from the overall base style for the axis:
Graphics[AxisObject[Line[{{0, 0}, {10, 10}}], {0, 10}, AxisStyle -> Thick, BaseStyle -> Red]]BaseStyle (3)
Graphics[AxisObject[Line[{{0, 0}, {10, 10}}], {0, 10}, BaseStyle -> Red]]AxisStyle affects only the style of the axis path:
Graphics[AxisObject[Line[{{0, 0}, {10, 10}}], {0, 10}, AxisStyle -> Blue, BaseStyle -> Red]]TicksStyle affects the style of the ticks, including their labels:
Graphics[AxisObject[Line[{{0, 0}, {10, 10}}], {0, 10}, TicksStyle -> Blue, BaseStyle -> Red]]LabelStyle (4)
LabelStyle affects only the style of the labels:
Graphics[AxisObject[Line[{{0, 0}, {10, 10}}], {0, 10}, LabelStyle -> Blue]]Graphics[AxisObject[Line[{{0, 0}, {10, 10}}], {0, 10}, LabelStyle -> Blue, BaseStyle -> Red]]Use LabelStylesize to specify the font size for the labels:
Graphics[AxisObject[Line[{{0, 0}, {10, 10}}], {0, 10}, LabelStyle -> 16]]Specify a font and font size for the labels:
Graphics[AxisObject[Line[{{0, 0}, {10, 10}}], {0, 10}, LabelStyle -> {FontFamily -> "Times", 15}]]LabelStyle inherits from the overall base style for the axis:
Graphics[AxisObject[Line[{{0, 0}, {10, 10}}], {0, 10}, LabelStyle -> 16, BaseStyle -> Red]]TickDirection (4)
By default, ticks point up and to the right:
Graphics[{AxisObject[Line[{{-2, -3}, {2, -3}}], {0, 10}], AxisObject[Line[{{-2, 3}, {2, 3}}], {0, 10}], AxisObject[Line[{{-3, -2}, {-3, 2}}], {0, 10}], AxisObject[Line[{{3, -2}, {3, 2}}], {0, 10}]}]Point all the ticks toward the center of the graphic:
Graphics[{AxisObject[Line[{{-2, -3}, {2, -3}}], {0, 10}, TickDirection -> "Inward"], AxisObject[Line[{{-2, 3}, {2, 3}}], {0, 10}, TickDirection -> "Inward"], AxisObject[Line[{{-3, -2}, {-3, 2}}], {0, 10}, TickDirection -> "Inward"], AxisObject[Line[{{3, -2}, {3, 2}}], {0, 10}, TickDirection -> "Inward"]}]Point all the ticks away from the center of the graphic:
Graphics[{AxisObject[Line[{{-2, -3}, {2, -3}}], {0, 10}, TickDirection -> "Outward"], AxisObject[Line[{{-2, 3}, {2, 3}}], {0, 10}, TickDirection -> "Outward"], AxisObject[Line[{{-3, -2}, {-3, 2}}], {0, 10}, TickDirection -> "Outward"], AxisObject[Line[{{3, -2}, {3, 2}}], {0, 10}, TickDirection -> "Outward"]}]Use ticks that point to the left or right:
Graphics[{AxisObject[Line[{{-1, -1}, {-1, 1}}], {0, 10}, TickDirection -> Right], AxisObject[Line[{{1, -1}, {1, 1}}], {0, 10}, TickDirection -> Left]}]Use ticks that point up or down:
Graphics[{AxisObject[Line[{{-1, -1}, {1, -1}}], {0, 10}, TickDirection -> Up], AxisObject[Line[{{-1, 1}, {1, 1}}], {0, 10}, TickDirection -> Down]}]TickLabels (3)
Ticks are automatically labeled by default:
Graphics[AxisObject[Line[{{0, 0}, {10, 10}}], {0, 10}, TickLabels -> Automatic]]Use automatic labels for the first collection of ticks and no labels for the second:
Graphics[AxisObject[Line[{{0, 0}, {10, 10}}], {0, 10}, TickPositions -> {{0, 10, 2}, {1, 9, 2}}, TickLabels -> {All, None}]]Reverse the labeling of tick collections:
Graphics[AxisObject[Line[{{0, 0}, {10, 10}}], {0, 10}, TickPositions -> {{0, 10, 2}, {1, 9, 2}}, TickLabels -> {None, All}]]Use specific labels for each tick:
Graphics[AxisObject[Line[{{0, 0}, {10, 10}}], {0, 10}, TickPositions -> {{0, 10, 1}}, TickLabels -> {CharacterRange["a", "k"]}]]TickLabelOrientation (5)
Tick labels are horizontal by default:
Graphics[AxisObject[Line[{{0, 0}, {10, 10}}], {0, 10}, TickLabelOrientation -> "Horizontal"]]Rotate the labels 90° so that they read bottom to top:
Graphics[AxisObject[Line[{{0, 0}, {10, 10}}], {0, 10}, TickLabelOrientation -> "Vertical"]]Rotate the labels so that the text is parallel to the axis:
Graphics[AxisObject[Line[{{0, 0}, {10, 10}}], {0, 10}, TickLabelOrientation -> "Parallel"]]Rotate the labels so that the text is perpendicular to the axis:
Graphics[AxisObject[Line[{{0, 0}, {10, 10}}], {0, 10}, TickLabelOrientation -> "Perpendicular"]]Rotate the labels by an arbitrary angle:
Graphics[AxisObject[Line[{{0, 0}, {10, 0}}], {0, 10}, TickLabelOrientation -> 45Degree]]TickLabelPositioning (2)
Tick labels are placed at the base of the tick by default:
Graphics[{AxisObject[Line[{{0, 2}, {10, 2}}], {0, 10}, TickDirection -> Down], AxisObject[Line[{{0, -2}, {10, -2}}], {0, 10}, TickDirection -> Up]}]Place the labels at the tip of the tick:
Graphics[{AxisObject[Line[{{0, 2}, {10, 2}}], {0, 10}, TickDirection -> Down, TickLabelPositioning -> "Tip"], AxisObject[Line[{{0, -2}, {10, -2}}], {0, 10}, TickDirection -> Up, TickLabelPositioning -> "Tip"]}]TickLengths (3)
Use the default lengths for major and minor ticks:
Graphics[AxisObject[Line[{{0, 0}, {10, 10}}], {0, 10}]]Use a scaled length for all the ticks:
Graphics[AxisObject[Line[{{0, 0}, {10, 10}}], {0, 10}, TickLengths -> 0.1]]Use different tick lengths for different collections of ticks:
Graphics[AxisObject[Line[{{0, 0}, {10, 10}}], {0, 10}, TickLengths -> {0.2, 0.1}]]TickPositions (5)
Use approximately six ticks along the axis:
Graphics[AxisObject[Line[{{0, 0}, {10, 10}}], {0, 10}, TickPositions -> {6}]]Graphics[AxisObject[Line[{{0, 0}, {10, 10}}], {0, 10}, TickPositions -> {6, 6}]]Use ticks at integer positions along the axis:
Graphics[AxisObject[Line[{{0, 0}, {10, 10}}], {0, 10}, TickPositions -> {{1}}]]Specify the lower and upper bounds for the ticks:
Graphics[AxisObject[Line[{{0, 0}, {10, 10}}], {0, 10}, TickPositions -> {{0, 5, 1}}]]Give a list of specific tick locations for the axis:
Graphics[AxisObject[Line[{{0, 0}, {10, 10}}], {0, 10}, TickPositions -> {{{1, 2, 3, 5, 7, 10}}}]]TicksStyle (3)
TicksStyle styles both the tick marks and labels:
Graphics[AxisObject[Line[{{0, 0}, {10, 10}}], {0, 10}, TicksStyle -> Blue]]Use different styles for different collections of ticks:
Graphics[AxisObject[Line[{{0, 0}, {10, 10}}], {0, 10}, TickPositions -> {{0, 10, 2}, {1, 9, 2}}, TickLengths -> 0.1, TicksStyle -> {Red, Blue}]]TicksStyle inherits from the overall base style for the axis:
Graphics[AxisObject[Line[{{0, 0}, {10, 10}}], {0, 10}, TicksStyle -> Thick, BaseStyle -> Red]]Applications (2)
Create a ruler labeled down to the quarter-inch:
Graphics[AxisObject[{"Horizontal", 0, {0, 12}}, {0, 5}, TickPositions -> {{0, 6, 1}, {0.5, 6, 1}, {0.25, 6, 0.5}, {0.125, 6, 0.25}}, TickLabels -> {Automatic, Automatic, Automatic, None}, TickLengths -> {0.75, 0.6, 0.4, 0.3}, TickDirection -> Up, TickLabelPositioning -> "Tip", AxisLabel -> Placed["INCH", {0.0, {1.1, 1.2}}], RotateLabel -> 270 °]]Use three axes to construct a frame for ternary plots:
ternaryFrame = Graphics[{
AxisObject[Line[{{1, 0}, {0, 0}}], {0, 100}, AxisLabel -> Placed["Component A", {0.5, {0.5, 2.5}}], RotateLabel -> Automatic, TickDirection -> "Inward"], AxisObject[Line[{{0, 0}, {0.5, Sqrt[3] / 2.}}], {0, 100}, AxisLabel -> Placed["Component B", {0.5, {0.5, -2.0}}], RotateLabel -> 60Degree, TickDirection -> "Inward"], AxisObject[Line[{{0.5, Sqrt[3] / 2.}, {1, 0}}], {0, 100}, AxisLabel -> Placed["Component C", {0.5, {0.5, -2.0}}], RotateLabel -> -60Degree, TickDirection -> "Inward"]}, PlotRange -> {{0, 1}, {0, 1}}]ternary[{x_, y_, z_}] := Normalize[{x, y, z}, Total].{{0, 0}, {0.5, Sqrt[3] / 2.}, {1, 0}}data = Table[Tooltip[Point[ternary[{x, y, z}]], {x, y, z}], {x, 0, 100, 25}, {y, 0, 100, 25}, {z, 0, 100, 25}];Show[Graphics[{Blue, data}], ternaryFrame]Text
Wolfram Research (2021), AxisObject, Wolfram Language function, https://reference.wolfram.com/language/ref/AxisObject.html.
CMS
Wolfram Language. 2021. "AxisObject." Wolfram Language & System Documentation Center. Wolfram Research. https://reference.wolfram.com/language/ref/AxisObject.html.
APA
Wolfram Language. (2021). AxisObject. Wolfram Language & System Documentation Center. Retrieved from https://reference.wolfram.com/language/ref/AxisObject.html