HistogramPointDensity[pdata]
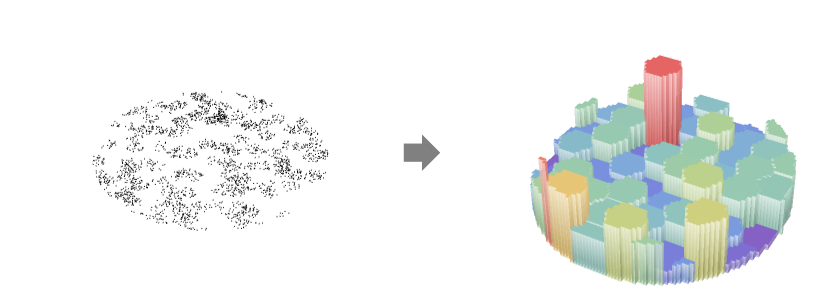
ヒストグラム点密度関数  を点データ pdata について推定する.
HistogramPointDensity[pdata,bspec]
ヒストグラム点密度関数  を bspec によるヒストグラムビン指定で推定する.
HistogramPointDensity[bdata,…,…]
ヒストグラム点密度関数  をビン分割されたデータ bdata について推定する.
HistogramPointDensity[pproc,…,…]
ヒストグラム点密度関数  を点過程 pproc について計算する.


HistogramPointDensity
HistogramPointDensity[pdata]
ヒストグラム点密度関数  を点データ pdata について推定する.
HistogramPointDensity[pdata,bspec]
ヒストグラム点密度関数  を bspec によるヒストグラムビン指定で推定する.
HistogramPointDensity[bdata,…,…]
ヒストグラム点密度関数  をビン分割されたデータ bdata について推定する.
HistogramPointDensity[pproc,…,…]
ヒストグラム点密度関数  を点過程 pproc について計算する.
詳細とオプション
- 点密度は点強度としても知られている.
- HistogramPointDensityは,点
 の数が観測領域
 の長さ,面積,体積によってどのように変わるかを記述する関数
 を与える.領域上の積分は点の総数
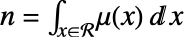 である.
- HistogramPointDensityは分割に基づいた点密度の推定器である.平滑化の制御にはビン指定 bspec が使われる.
- ヒストグラム点密度は,一般に,非同次ポアソン(Poisson)過程または非同次性の測度を定義するために使われる.
- HistogramPointDensityは,密度関数を繰り返し評価するために使えるPointDensityFunctionを返す.
- 点 pdata は次の形式でよい.
-
{p1,p2,…} 点 pi GeoPosition[…],GeoPositionXYZ[…],… 地理的な点 SpatialPointData[…] 観測領域がある空間点集合 {pts,reg} 点集合 pts と観測領域 reg - 観測領域 reg は,与えられていない場合はRipleyRassonRegionを使って自動的に計算される.
- ビン分割データ bdata はSpatialBinnedPointDataの形であると想定される.
- 点過程 pproc は次の形式でよい.
-
proc 厳密な式による点過程 proc {proc,reg} シミュレーションに基づいた点過程 proc と観測領域 reg - 観測領域 reg はパラメータフリーの全次元で,SpatialObservationRegionQで調べられるような有界領域である.
- 次の代数的・地理的ビン指定 bspec を使うことができる.
-
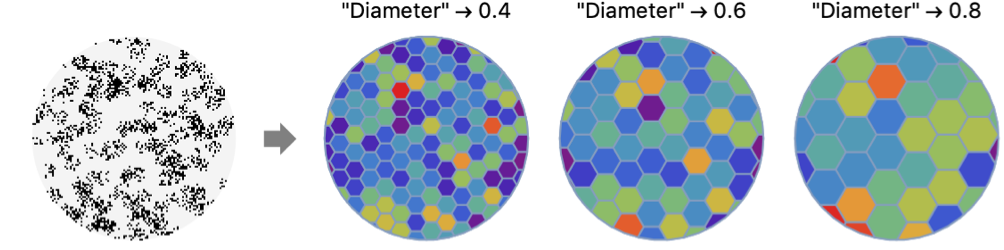
MeshRegion[…] セルがある明示的なMeshRegion "ObservationMesh" 観測領域の離散化 {reg1,reg2, ...} 不連続領域の明示的なリスト shape 次元に依存する代数的形状 {shape,"Count"n} 約 n 個に集約されたビン {shape,"Measure"ν} 近似測度 ν の集約されたビン {shape,"Diameter"d} 近似直径 d の集約されたビン - 次は,shape の可能な設定である.
-
"Triangle" 2Dの三角形ビン "Square" 2Dの正方形ビン "Hexagon" 2Dの六角形ビン - 幾何学ビンは,bspec を座標ごとに与えることで作ることもできる.
-
n n 個のビンを使う {w} 幅 w のビンを使う {min,max,w} 幅 w(min から max まで)のビンを使う {{b1,b2,…}} ビン[b1,b2),[b2,b3),…を使う Automatic ビン幅を自動的に決定する "name" 名前付きのビン分割メソッドを使う fw fw を適用して明示的なビン指定{b1,b2,…}を得る {xspec,yspec,…} x, y 等の異なる指定を与える - 次は,使用可能な名前付きビン分割メソッドである.
-
"FreedmanDiaconis" 四分位範囲の2倍をサンプルサイズの立方根で割った値 "Knuth" 区分一様モデルの平衡尤度と事前確率 "Scott" 平均二乗誤差を漸近的に最小化する "Sturges" データ長に基づいてビン数を計算する "Wand" 1レベルの再帰的近似Wandビン分割 - ビンはすべて観測領域と交差するように切り取られる.
例題
すべて開く すべて閉じる例 (2)
SpatialPointDataを作成する:
spd = SpatialPointData[RandomReal[1, {300, 2}]];μ = HistogramPointDensity[spd]μ[{.3, .5}]DiscretePlot3D[μ[{x, y}], {x, 0, .95, .05}, {y, 0, .95, .05}, ExtentSize -> Full, ColorFunction -> "Rainbow"]data = GeoPosition[{{57.38695860758024, -2.082019036397938}, {64.51592745731402, 45.824927190648225},
{56.6010212397469, -6.240526809704691}, {51.60678874558969, 57.27710883880354},
{45.30573867042673, 15.472775964257096}, {47.62531221069711, 33.091 ... 064113254605, 6.294616072872941}, {70.14917097063635, 58.711274282407935},
{53.9133525034849, 51.235121204775595}, {47.95050112387477, 50.208632516820614},
{45.978247255215074, 0.000929944545532635}, {61.154927383569934, 53.20226357948661}}];μ = HistogramPointDensity[data, "Hexagon"]μ["DensityVisualization"]スコープ (5)
同次一変量SpatialPointDataを作成する:
reg = Rectangle[{0, 0}, {3, 3}];
data = SpatialPointData[RandomPoint[reg, 200], reg]μ1 = HistogramPointDensity[data, "Triangle"]μ2 = HistogramPointDensity[data, "Hexagon"]sample = RandomPoint[reg, 5 * 10 ^ 3];vals1 = μ1[sample];vals2 = μ2[sample];max = Max[{vals1, vals2}];
colors1 = ColorData["Rainbow"] /@ (vals1 / max);
colors2 = ColorData["Rainbow"] /@ (vals2 / max);ListPlot[MapThread[Style[#1, #2]&, {sample, #}], AspectRatio -> 1, PlotStyle -> PointSize[Medium]]& /@ {colors1, colors2}data = RandomPointConfiguration[MaternPointProcess[10, 50, .1, 2], Rectangle[]];ListPlot[data, AspectRatio -> Automatic]μ = HistogramPointDensity[data]Show[ContourPlot[μ[{x, y}], {x, 0, 1}, {y, 0, 1}, ContourStyle -> None, ColorFunction -> "SolarColors"], ListPlot[data, PlotStyle -> Black]]reg = Disk[{0, 0}, 3];
data = RandomPointConfiguration[HardcorePointProcess[10, r = 0.2, 2], reg, Method -> {Automatic, "LengthOfRun" -> 10 ^ 4}];ListPlot[data, AspectRatio -> Automatic]さまざまなビンの直径についてのデータからヒストグラム点密度を計算する:
diams = {r, 2r, 3r};
μ = HistogramPointDensity[data, {"Square", "Diameter" -> #}]& /@ diams;Table[Show[ContourPlot[μ[[k]][{x, y}], {x, -3, 3}, {y, -3, 3}, ContourStyle -> None, ColorFunction -> "PearlColors", PlotLabel -> Row[{"bandwidth = ", diams[[k]]}]], ListPlot[data, PlotStyle -> Black]], {k, 3}]sp = SpatialPointData[RandomReal[1, {50, 2}], Rectangle[]];mesh = [image];polygonlist = MeshPrimitives[mesh, 2];pfs = Table[HistogramPointDensity[sp, type], {type, {"MeshRegion", "AggregatedMeshRegion", "Hexagon", "Square", "Triangle", mesh, polygonlist}}];types = {"MeshRegion", "AggregatedMeshRegion", "Hexagon", "Square", "Triangle", "mesh", "polygonlist"};MapThread[Show[Labeled[#1["DensityVisualization"], #2], ImageSize -> 110]&, {pfs, types}]pts = SpatialPointData@RandomGeoPosition[Entity["Country", "Italy"], 100];GeoListPlot[pts["Points"]]pfs = Table[HistogramPointDensity[pts, type], {type, {"MeshRegion", "AggregatedMeshRegion", "Hexagon", "Square", "Triangle"}}];GraphicsRow@Table[Show[pf["DensityVisualization"], ImageSize -> 100], {pf, pfs}]//Quietアプリケーション (1)
tab = Tabular[ResourceData["NYC Rat Sightings"]]ColumnKeys[tab]地理位置を抽出し,欠落しているものは削除してSpatialPointDataを作成する:
pts = DeleteMissing[Normal[tab[All, "GeoLocation"]]];locs = SpatialPointData[pts]density = HistogramPointDensity[locs]ニューヨーク市におけるネズミの目撃情報が多い地域を,以下の場所のサンプルで可視化する:
pos = RandomSample[pts, 3000];
vals = density[pos];PointValuePlot[pos -> vals, ColorFunction -> "Rainbow", PlotStyle -> PointSize[Small], GeoBackground -> "VectorMonochrome"]特性と関係 (1)
HistogramPointDensityはビンの高さ指定が"Intensity"であるHistogramと関連している:
data1 = RandomPointConfiguration[PoissonPointProcess[100, 1], Interval[{-1, 1}]];μ1 = HistogramPointDensity[data1, {.1}]密度関数と同じビン幅の強度Histogramを比較する:
Show[Histogram[data1, {.1}, "Intensity"], Plot[μ1[{x}], {x, -1, 1}]]data2 = RandomPointConfiguration[PoissonPointProcess[100, 2], Rectangle[]];ListPlot[data2]μ2 = HistogramPointDensity[data2, {.1}]密度関数のプロットとデータのHistogram3Dを比較する:
μplot = DiscretePlot3D[μ2[{x, y}], {x, 0, 1, .1}, {y, 0, 1, .1}, ExtentSize -> Right, ColorFunction -> "Rainbow", PlotRange -> {{0, 1}, {0, 1}, All}];h = Histogram3D[data2, {.1}, "Intensity", ColorFunction -> (ColorData["Rainbow"][Rescale[#, {0, 1}, {0.25, 1}]]&)];{μplot, h}テキスト
Wolfram Research (2020), HistogramPointDensity, Wolfram言語関数, https://reference.wolfram.com/language/ref/HistogramPointDensity.html.
CMS
Wolfram Language. 2020. "HistogramPointDensity." Wolfram Language & System Documentation Center. Wolfram Research. https://reference.wolfram.com/language/ref/HistogramPointDensity.html.
APA
Wolfram Language. (2020). HistogramPointDensity. Wolfram Language & System Documentation Center. Retrieved from https://reference.wolfram.com/language/ref/HistogramPointDensity.html