-
See Also
- PointDensityFunction
- HistogramPointDensity
- SmoothPointDensity
- InhomogeneousPoissonPointProcess
- SpatialPointData
- HistogramDistribution
- GeoHistogram
- GeoSmoothHistogram
- DensityHistogram
- SmoothDensityHistogram
- SmoothKernelDistribution
- KernelMixtureDistribution
- HistogramList
- Histogram
- Histogram3D
- VoronoiMesh
- Related Guides
-
-
See Also
- PointDensityFunction
- HistogramPointDensity
- SmoothPointDensity
- InhomogeneousPoissonPointProcess
- SpatialPointData
- HistogramDistribution
- GeoHistogram
- GeoSmoothHistogram
- DensityHistogram
- SmoothDensityHistogram
- SmoothKernelDistribution
- KernelMixtureDistribution
- HistogramList
- Histogram
- Histogram3D
- VoronoiMesh
- Related Guides
-
See Also
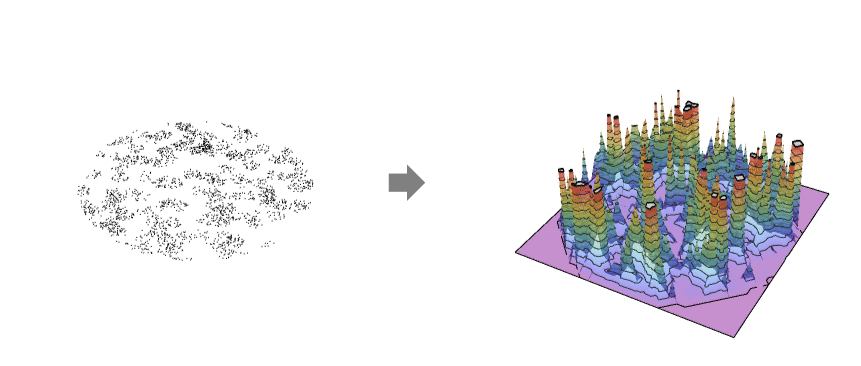
PointDensity[pdata]
estimates the point density function ![]() from point data pdata.
from point data pdata.
PointDensity[pdata,pmethod]
estimates the point density function ![]() with the partition method pmethod.
with the partition method pmethod.
PointDensity[bdata,…]
estimates the point density function ![]() from binned data bdata.
from binned data bdata.
PointDensity[pproc,…]
computes the density function ![]() for point process pproc.
for point process pproc.


PointDensity
PointDensity[pdata]
estimates the point density function ![]() from point data pdata.
from point data pdata.
PointDensity[pdata,pmethod]
estimates the point density function ![]() with the partition method pmethod.
with the partition method pmethod.
PointDensity[bdata,…]
estimates the point density function ![]() from binned data bdata.
from binned data bdata.
PointDensity[pproc,…]
computes the density function ![]() for point process pproc.
for point process pproc.
Details and Options


- Point density is also known as point intensity.
- The point density
 gives a function that describes how the number of points
  varies per length, area and volume in the observation region ℛ. The integral over the region is the total number of points
  .
. - PointDensity gives a partition-based estimator that adapts to the point collection in how the partition is formed, effectively using a cell per point.
- The resulting point density function typically looks very noisy. To get a smoothed version of the point density, use HistogramPointDensity or SmoothPointDensity.
- Point density is typically used to define an inhomogeneous Poisson process or a measure of inhomogeneity.
- PointDensity returns a PointDensityFunction that can be used to evaluate the density function repeatedly.
- The point data pdata can have the following forms:
-
{p1,p2,…} points pi GeoPosition[…],GeoPositionXYZ[…],… geographic points SpatialPointData[…] spatial point collection {pts,reg} point collection pts and observation region reg - If the observation region reg is not given, a region automatically computed using RipleyRassonRegion.
- For the point intensity estimation from the binned data bdata, which is assumed to be SpatialBinnedPointData, the points are simulated uniformly in each bin.
- The point process pproc can have the following forms:
-
proc a point process proc with exact formulas {proc,reg} a point process proc and observation region reg based on simulation - The observation region reg should be a parameter-free, full-dimensional and bounded region as tested by SpatialObservationRegionQ.
- The partition method pmethod can be used:
-
"Delaunay" Delaunay cells from point data; gives a piecewise linear density function (default) "Voronoi" Voronoi cells from point data; gives a piecewise-constant density function {"Voronoi",n} aggregate cells so that approximately n cells remain, based on the smallest cells first

Examples
open all close allBasic Examples (3)
Create a SpatialPointData:
Visualize the intensity estimation:
Calculate PointDensity on the surface of the Earth:
Visualize the density function using random locations:
Create density for an InhomogeneousPoissonPointProcess from data:
Compute the point intensity function:
Define an InhomogeneousPoissonPointProcess with the computed point density:
Scope (7)
Point Data (4)
Create a homogeneous univariate SpatialPointData:
Compute the point intensity function using different partition methods:
Visualize using a random point sample:
Create an inhomogeneous univariate SpatialPointData:
Compare the point density function with the smooth kernel density method:
The point density of clustered data:
Compute the point density from data:
Point Processes (3)
The point density function for PoissonPointProcess is constant in every dimension:
The point density function for InhomogeneousPoissonPointProcess:
The point density function for BinomialPointProcess on a ball:
Applications (1)
Get the data of rat sightings in New York City:
List column keys to find locations column:
Extract geo locations, delete missing and create SpatialPointData:
Visualize the areas of prevalence of rat sightings in NYC on a sample of the locations:
See Also
PointDensityFunction HistogramPointDensity SmoothPointDensity InhomogeneousPoissonPointProcess SpatialPointData HistogramDistribution GeoHistogram GeoSmoothHistogram DensityHistogram SmoothDensityHistogram SmoothKernelDistribution KernelMixtureDistribution HistogramList Histogram Histogram3D VoronoiMesh
Related Guides
History
Text
Wolfram Research (2020), PointDensity, Wolfram Language function, https://reference.wolfram.com/language/ref/PointDensity.html.
CMS
Wolfram Language. 2020. "PointDensity." Wolfram Language & System Documentation Center. Wolfram Research. https://reference.wolfram.com/language/ref/PointDensity.html.
APA
Wolfram Language. (2020). PointDensity. Wolfram Language & System Documentation Center. Retrieved from https://reference.wolfram.com/language/ref/PointDensity.html
BibTeX
@misc{reference.wolfram_2025_pointdensity, author="Wolfram Research", title="{PointDensity}", year="2020", howpublished="\url{https://reference.wolfram.com/language/ref/PointDensity.html}", note=[Accessed: 07-February-2026]}
BibLaTeX
@online{reference.wolfram_2025_pointdensity, organization={Wolfram Research}, title={PointDensity}, year={2020}, url={https://reference.wolfram.com/language/ref/PointDensity.html}, note=[Accessed: 07-February-2026]}