

PlotHighlighting
Details
- PlotHighlighting adds highlighting to plot elements to aid the understanding of plots.
- Interactive highlighting that depends on the cursor positions is useful for exploring features in a plot, while static highlighting features at specific locations are useful for explaining features to others.
- Possible highlighting effects for PlotHighlighting include:
-
Automatic automatically highlight plot elements All highlight plot elements None do not highlight plot elements style use color, thickness, etc. to style elements effect use a given effect to highlight plot elements Placed[effect,pos] statically highlight the plot at a given position {effect1,..} use multiple forms of highlighting - PlotHighlightingAutomatic highlights plot elements unless there are already elements like tooltips, labels, callouts or other interactive behaviors that would interfere.
- PlotHighlightingAll highlights plot elements even in the presence of other elements.
- Possible highlighting effects effect can be:
-
"name" use a named highlighting effect {comp1,comp2,…} combine components compi into a single effect {comp,<param1val1>} use component comp with parametrized settings - Position specifications pos vary by function. Common forms of positions include:
-
x, {x} effect at {x,y} with y chosen automatically {x,y} effect at {x,y} {pos1,pos2,…} multiple positions posi - Common highlighting effects include:
-
style highlight the indicated curve 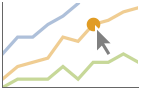
"Ball" highlight the indicated point in a curve 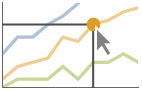
"Dropline" highlight the indicated point in a curve with droplines to the axes 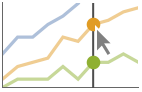
"XSlice" highlight all points along a vertical slice 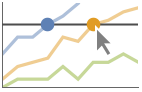
"YSlice" highlight all points along a horizontal slice - The highlighting specification {comp1,comp2,…} uses the individual component effects compi to construct an overall effect.
- The compi can be a named string "comp" or a named string combined with an association of parameters {"comp",<"param1"value1,…>}.
- Point-based effect components comp include:
-

"IndicatedPoint" label the cursor position 
"NearestPoint" draw a ball at the point closest to the cursor 
"XNearestPoint" draw a ball at the point or points closest to the cursor in the x direction 
"YNearestPoint" draw a ball at the point or points closest to the cursor in the y direction - The above component effects all take the param "Style".
- Components comp that draw reference lines include:
-
"Crosshairs" free-form cross hairs following the cursor 
"XYDroplines" droplines from the cursor to the axes or frames 
"XLine" vertical line spanning the graphic 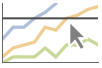
"YLine" horizontal line spanning the graphic 
"XDropline" vertical droplines from the cursor to the axes or frames 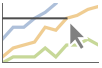
"YDropline" horizontal droplines from the cursor to the axes or frames - The above component effects all take the param "Style".
- Label-based effect components include:
-
"XYLabel" label the cursor position 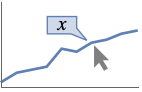
"XLabel" label the x coordinate of the cursor position 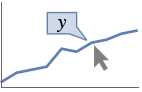
"YLabel" label the y coordinate of the cursor position 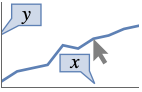
"XYAxisLabels" label the coordinates along the axes or frame 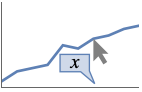
"XAxisLabel" label the x coordinate along the axis or frame 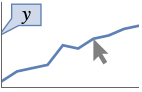
"YAxisLabel" label the y coordinate along the axis or frame - The label component effects all take the same parameters as Callout:
-
Appearance Automatic overall style of the callout Background Automatic style of the label background CalloutMarker None marker to use for the anchor position apos CalloutStyle Automatic style to use for strokes and knockouts Frame Automatic frame of the label box FrameMargins Automatic margins to leave inside the frame LabelStyle {} style to use for the label LeaderSize Automatic length and angle to use for the leader RoundingRadius 0 radius for rounded corners - Applicable highlighting effects vary by function and environment and are documented for each function.
Examples
open all close allBasic Examples (5)
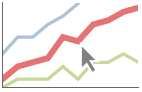
Mouse over a curve to show coordinates and a marker point with the default Automatic highlighting:
Plot[2 Sin[x] + x, {x, 0, 15}]Mouse over a curve to have it highlight with the given style:
ListLinePlot[IconizedObject[«random walks»], PlotHighlighting -> Directive[StandardPurple, Thick], PlotStyle -> Directive[...]]Mouse over a curve to show the coordinates and droplines to the axes:
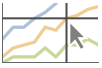
Plot[{Cos[x]x, Sin[x]x}, {x, 0, 10}, PlotHighlighting -> "Dropline"]Use Placed to add static highlights to the curves at the position ![]() :
:
Plot[{Sin[x] + x / 2, Sin[x] + x}, {x, 0, 10}, Filling -> {1 -> {2}}, PlotHighlighting -> Placed["Dropline", 6]]Use PlotHighlightingNone to disable all highlighting effects:
Plot[2 Sin[x] + x, {x, 0, 15}, PlotHighlighting -> None]Scope (19)
Named Effects (6)
Use the "Ball" effect to show a point labeled with the coordinates:
Plot[Sin[x], {x, 0, 2Pi}, PlotHighlighting -> "Ball"]Plot[Sin[x], {x, 0, 2Pi}, PlotHighlighting -> Placed["Ball", 2]]Use the "Dropline" effect to show a point labeled with the coordinates and droplines to the axes:
ListLinePlot[{...}, PlotHighlighting -> "Dropline"]Place a fixed highlight at ![]() and
and ![]() :
:
ListLinePlot[{...}, PlotHighlighting -> Placed["Dropline", {{5}, {8}}]]Use the "XSlice" effect to show a vertical line and ![]() labels:
labels:
StackedListPlot[IconizedObject[«data»], PlotHighlighting -> "XSlice"]Place a fixed highlight at ![]() and
and ![]() :
:
StackedListPlot[IconizedObject[«data»], PlotHighlighting -> Placed["XSlice", 7]]Use the "YSlice" effect to show a horizontal line and ![]() labels:
labels:
ParametricPlot[{(Cos[t] - 1)Cos[t], (Cos[t] - 1)Sin[t]}, {t, 0, 2Pi}, PlotHighlighting -> "YSlice"]ParametricPlot[{(Cos[t] - 1)Cos[t], (Cos[t] - 1)Sin[t]}, {t, 0, 2Pi}, PlotHighlighting -> Placed["YSlice", {0.5}]]The default highlighting effects are also disabled when other labels are present:
{Plot[Callout[2 Sin[x] + x, "label", 8], {x, 0, 15}], Plot[Tooltip[2 Sin[x] + x], {x, 0, 15}]}PlotHighlightingAll will include the default highlighting, but may interfere with other elements:
{Plot[Callout[2 Sin[x] + x, "label", 8], {x, 0, 15}, PlotHighlighting -> All], Plot[Tooltip[2 Sin[x] + x], {x, 0, 15}, PlotHighlighting -> All]}Highlighted[…,None] can be used to remove highlighting from specific elements:
Plot[{Sin[x], Highlighted[Cos[x], None]}, {x, 0, 10}]Component Effects (13)
"IndicatedPoint" shows a point when the mouse position is close to a plot element:
Plot[{-1, 1}, {t, 0, 2 Pi}, PlotHighlighting -> "IndicatedPoint"]Use a red point for the highlight:
Plot[{-1, 1}, {t, 0, 2 Pi}, PlotHighlighting -> {"IndicatedPoint", <|"Style" -> Red|>}]"NearestPoint" always selects a point, regardless of distance:
Plot[{-1, 1}, {t, 0, 2 Pi}, PlotHighlighting -> "NearestPoint"]Use a red point for the highlight:
Plot[{-1, 1}, {t, 0, 2 Pi}, PlotHighlighting -> {"NearestPoint", <|"Style" -> Red|>}]"XNearestPoint" shows all the points that share the same ![]() value as the mouse position:
value as the mouse position:
Plot[{x - 1, x, x + 1}, {x, 0, 1}, PlotHighlighting -> "XNearestPoint"]Use a red point for the highlight:
Plot[{x - 1, x, x + 1}, {x, 0, 1}, PlotHighlighting -> {"XNearestPoint", <|"Style" -> Red|>}]"YNearestPoint" shows all the points that share the same ![]() value as the mouse position:
value as the mouse position:
Plot[{x ^ 2, x ^ 4, x ^ 6}, {x, -3, 3}, PlotHighlighting -> "YNearestPoint", IconizedObject[«…»]]Use a red point for the highlight:
Plot[{x ^ 2, x ^ 4, x ^ 6}, {x, -3, 3}, PlotHighlighting -> {"YNearestPoint", <|"Style" -> Red|>}, IconizedObject[«…»]]"Crosshairs" draws vertical and horizontal infinite lines at the mouse position:
Plot[BesselJ[1, x], {x, 0, 20}, PlotHighlighting -> "Crosshairs"]Plot[BesselJ[1, x], {x, 0, 20}, PlotHighlighting -> {"Crosshairs", <|"Style" -> Directive[Orange, Dashed]|>}]"XYDropline" draws droplines to the axes:
Plot[BesselJ[1, x], {x, 0, 20}, PlotHighlighting -> "XYDroplines"]Plot[BesselJ[1, x], {x, 0, 20}, PlotHighlighting -> {"XYDroplines", <|"Style" -> Directive[Thick, Red]|>}]"XLine" and "YLine" draw vertical and horizontal lines across the plot:
{ParametricPlot[{t Cos[t], t Sin[t]}, {t, 0, 2Pi}, PlotHighlighting -> "XLine"], ParametricPlot[{t Cos[t], t Sin[t]}, {t, 0, 2Pi}, PlotHighlighting -> "YLine"]}"XDropline" and "YDropline" draw vertical and horizontal lines across the plot:
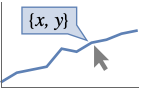
{ParametricPlot[{t Cos[t], t Sin[t]}, {t, 0, 2Pi}, PlotHighlighting -> "XDropline"], ParametricPlot[{t Cos[t], t Sin[t]}, {t, 0, 2Pi}, PlotHighlighting -> "YDropline"]}"XYLabel" labels the plot elements with the coordinates:
ParametricPlot[{2Cos[x], Sin[2x]}, {x, 0, 20}, PlotHighlighting -> "XYLabel"]ListPlot[IconizedObject[«data»], PlotHighlighting -> "XYLabel"]"XYAxisLabel" labels the axes with the coordinates of the mouse position:
ParametricPlot[{2Cos[x], Sin[2x]}, {x, 0, 20}, PlotHighlighting -> "XYAxisLabels"]ListPlot[IconizedObject[«data»], PlotHighlighting -> "XYAxisLabels"]"XLabel" shows the ![]() coordinate corresponding to the mouse position or indicated
coordinate corresponding to the mouse position or indicated ![]() value:
value:
Plot[x ^ 2, {x, 0, 10}, PlotHighlighting -> Placed["XLabel", 64]]"YLabel" shows the ![]() coordinate corresponding to the mouse position or indicated
coordinate corresponding to the mouse position or indicated ![]() value:
value:
Plot[x ^ 2, {x, 0, 10}, PlotHighlighting -> Placed["YLabel", 8]]Label effects take Callout options as styling parameters:
Plot[Sin[x ^ 2] + x, {x, 0, 5}, PlotHighlighting -> {"XYLabel", <|Appearance -> "Corners", CalloutStyle -> StandardRed, Background -> GrayLevel[0.6], LabelStyle -> White|>}]Plot[Sin[x ^ 2] + x, {x, 0, 5}, PlotHighlighting -> Placed[{"XYLabel", <|Appearance -> "Corners", CalloutStyle -> StandardRed, Background -> GrayLevel[0.6], LabelStyle -> White|>}, 1.25]]Create a custom effect by combining different components:
Plot[Sin[x ^ 2] + x, {x, 0, 5}, PlotHighlighting -> {"XNearestPoint", "XDropline", "YLabel"}]Style the different elements in the effect:
Plot[Sin[x ^ 2] + x, {x, 0, 5}, PlotHighlighting -> {{"XNearestPoint", <|"Style" -> StandardRed|>}, {"XDropline", <|"Style" -> Directive[StandardRed, Dashed]|>}, {"YLabel", <|CalloutStyle -> StandardRed, Background -> StandardGray|>}}]Use the effect as a static highlight:
Plot[Sin[x ^ 2] + x, {x, 0, 5}, PlotHighlighting -> Placed[{{"XNearestPoint", <|"Style" -> StandardRed|>}, {"XDropline", <|"Style" -> Directive[StandardRed, Dashed]|>}, {"YLabel", <|CalloutStyle -> StandardRed, Background -> StandardGray|>}}, 3.75]]Text
Wolfram Research (2023), PlotHighlighting, Wolfram Language function, https://reference.wolfram.com/language/ref/PlotHighlighting.html.
CMS
Wolfram Language. 2023. "PlotHighlighting." Wolfram Language & System Documentation Center. Wolfram Research. https://reference.wolfram.com/language/ref/PlotHighlighting.html.
APA
Wolfram Language. (2023). PlotHighlighting. Wolfram Language & System Documentation Center. Retrieved from https://reference.wolfram.com/language/ref/PlotHighlighting.html