

SpatialPointData
SpatialPointData[points]
points で与えられる空間点配置を表す.
SpatialPointData[points,reg]
領域 reg 内の点集合を表す.
SpatialPointData[pointsvals,…]
値 vals と場所 points を関連付ける.
SpatialPointData[points<key1vals1,…>,…]
キーと値の連想 keyivalsiを関連付ける
SpatialPointData[{p1data1,p2data2,…},…]
関連付けられた値{data1,data2,…}がある空間点集合{p1,p2,…}を表す.
SpatialPointData[{points1,points2,…},…]
空間点の複数の集合を表す.
SpatialPointData[{points1anns1,points2anns2,…},…]
注釈を含む複数の空間点集合を表す.
詳細とオプション
- 空間的な点集合は空間点パターンとしても知られている.
- 空間的な点配置は観測領域 reg を含む点の集合で,各点についての注釈が含まれることもある.
- 点配置は任意の次元でよい.典型的な1Dの点には,顧客の到着やサーバージョブの到着等の時間内の事象がある.典型的な2Dの点には,サンプル内のセルの位置,木の位置,犯罪または病気の位置等がある.典型的な3Dの点には,星や銀河団の位置,コンクリートの集合体の位置,材料の欠陥の位置等がある.
-
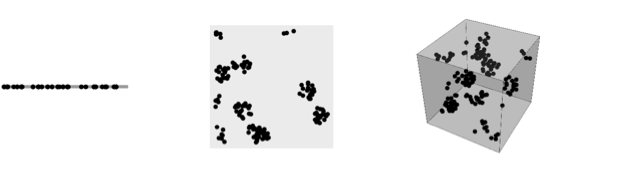
- 点 points は以下の形式でよい.
-
{p1,p2,…} 幾何学的な点 pi∈d GeoPosition[…],GeoPositionXYZ[…],… 地理的な点 - 点配置についての正しい統計を生成するためには,観測領域 reg は重要である.
-
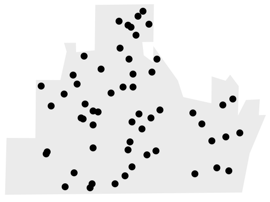
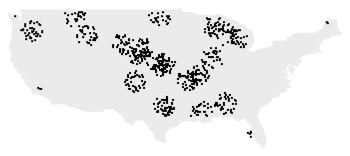
- 観測領域 reg が与えられていない場合は,RipleyRassonRegionを使って領域が自動的に計算される.
- 観測領域 reg は,SpatialObservationRegionQでテストできるようなパラメータがない全次元の有界な領域で なければならない.
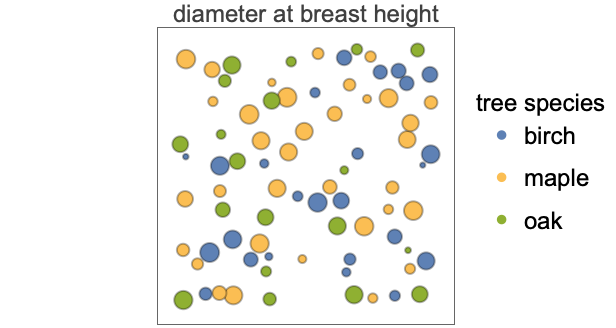
- 空間点には,各点に関連した追加的な情報を与える注釈があってもよい.これらは,通常は,マークおよび共変量と呼ばれる.
- よく使われるマークには,胸高における樹径と樹種があり,よく使われる共変量には樹木の場合の高さである.
- 次は,注釈の特性である.
-
"Annotations" 最初の点配置の注釈 {"Annotations",n} n 番目の点配置の注釈 "AnnotationsList" すべての点配置の注釈のリスト {…,"key"} 指定されたキー"key"の注釈を返す - 注釈は,AnnotationKeys,Annotate,AnnotationValue等の関数を使って取り出したり加えたりできる.
- 以下は基本的な特性である.
-
"Summary" データ情報の表 "Dimension" 点座標の次元性 "ObservationRegion" 観測領域 "RegionMeasure" 観測領域の寸法 "ConfigurationCount" 点配置の数 "Points" 最初の配置の点座標 "PointsList" すべての配置の点座標 "PointCount" 最初の点配置中の点の数 "PointCountList" すべての点配置に含まれる点の数 "MeanPointCount" すべての点配置についての点の平均数 "MeanPointDensity" すべての点配置についての点の平均密度 "FryPlot" 方向性がある散布図 - SpatialPointData[sdata,newreg]は,新たな観測領域が newreg ともとの観測領域の共通部分である,もとの空間点データの部分集合を作る.
- SpatialPointDataは,HistogramPointDensity,RipleyK,SpatialRandomnessTest等の関数と一緒に使うことができる.
例題
すべて開く すべて閉じる例 (2)
一変量SpatialPointDataを作る:
SpatialPointData[RandomReal[1, {10, 1}]]NumberLinePlot[%]多変量SpatialPointData:
SpatialPointData[RandomReal[1, {20, 2}]]ListPlot[%]GeoPositionのリストに対してSpatialPointDataを作る:
data = {Entity["City", {"Houston", "Texas", "UnitedStates"}], Entity["City", {"Austin", "Texas", "UnitedStates"}], Entity["City", {"Dallas", "Texas", "UnitedStates"}], Entity["City", {"SanAntonio", "Texas", "UnitedStates"}]};tx = Entity["AdministrativeDivision", {"Texas", "UnitedStates"}];spd = SpatialPointData[data, tx]GeoListPlot[spd, GeoRange -> tx]スコープ (22)
基本的な用法 (8)
reg = Interval[{0, 1}];sample = RandomVariate[BetaDistribution[2, 1 / 3], 10 ^ 3];spd = SpatialPointData[Partition[sample, 1], reg]NumberLinePlot[spd, PlotStyle -> PointSize[Tiny]]res = Disk[{0, 1}, 4];sample = RandomPoint[res, 10 ^ 3];spd = SpatialPointData[sample, res]ListPlot[spd, AspectRatio -> 1]points = N@PolyhedronData["Dodecahedron", "Vertices"];spd = SpatialPointData[points, PolyhedronData["Dodecahedron", "MeshRegion"]]Show[spd["ObservationRegion"], Graphics3D[{Black, PointSize[.035], Point[points]}]]異なるデータ点の間のすべてのベクトルをプロットすることでハードコア半径を識別する:
sample = RandomPointConfiguration[HardcorePointProcess[10 ^ 4, .1, 2], Rectangle[]]ベクトルのプロットはフライ(Fry)プロットと呼ばれるもので,空間点データから直接抽出することができる:
sample["FryPlot"]ランダムな測地点からSpatialPointDataを構築する:
geodata = RandomGeoPosition["World", 100]data = SpatialPointData[geodata, GeoBoundsRegion[{{-90, 90}, {-180, 180}}]]GeoListPlot[data]cities = Entity["Country", "UnitedStates"]["LargestCities"];国の多角形で指定された領域でSpatialPointDataを作る:
data = SpatialPointData[cities, Entity["Country", "UnitedStates"]]GeoListPlot[data]GeoElevationDataを使ってメキシコ上の構造格子を取得する:
data = GeoElevationData[Entity["Country", "Mexico"], Automatic, "GeoPosition", GeoZoomLevel -> 1]First[data]//Dimensionspoints = MapAt[Flatten[#, 1]&, data, 1]spd = SpatialPointData[points -> <|"Elevation" -> points["Elevation"]|>, Entity["Country", "Mexico"]]GeoListPlot[spd]ResourceObjectからデータを得る:
obj = ResourceObject["Sample Data: Lansing Woods"]data = ResourceData[obj]ListPlot[data]領域 (3)
SpatialPointDataは点が発生する観測領域について定義される:
points = RandomReal[1, {3, 10, 2}];spd = SpatialPointData[points, Rectangle[]]spd["Properties"]spd["ObservationRegion"]new = SpatialPointData[points, Rectangle[{0, 0}, {.5, .5}]]new["ObservationRegion"]観測領域は,指定されていなければRipley–Rasson推定器(凸包の膨張)で推定される:
spd = SpatialPointData[RandomReal[1, {100, 2}]]Show[RegionPlot[spd["ObservationRegion"]], ListPlot[spd]]pts = RandomReal[1, {10, 2}];
spd = SpatialPointData[pts, Rectangle[{0, 0}, {1, 1}]];newreg1 = Rectangle[{0, 0}, {2, .5}];spd1 = SpatialPointData[spd, newreg1];spd1["ObservationRegion"]RegionPlot[{spd["ObservationRegion"], newreg1, spd1["ObservationRegion"]}, PlotLegends -> {"original observation region", "newreg1", "new observation region"}]新たな領域よりも大きい新たな空間点データを再構築によって作る:
newreg2 = Rectangle[{0, 0}, {1, 2}];spd2 = SpatialPointData[spd["Points"], newreg2]spd2["ObservationRegion"]spd2["ObservationRegion"] === newreg2RegionPlot[{spd["ObservationRegion"], newreg2}, PlotLegends -> {"original observation region", "new observation region"}]変換 (3)
SpatialPointDataを平行移動する:
spd = SpatialPointData[RandomReal[{-1, 1}, {100, 2}], Disk[]]fn = TranslationTransform[{2, .5}];
spd1 = fn[spd];Show[RegionPlot[{spd["ObservationRegion"], spd1["ObservationRegion"]}, PlotLegends -> {"Original Region", "Transformed Region"}], ListPlot[{spd["Points"], spd1["Points"]}], AspectRatio -> Automatic]SpatialPointDataを回転させる:
spd = SpatialPointData[RandomReal[2, {100, 2}], Rectangle[{0, 0}, {2, 1}]]fn = RotationTransform[π / 2];
spd1 = fn[spd]Show[RegionPlot[{spd["ObservationRegion"], spd1["ObservationRegion"]}, PlotLegends -> {"Original Region", "Transformed Region"}], ListPlot[{spd["Points"], spd1["Points"]}], AspectRatio -> Automatic]SpatialPointDataをスケールし直す:
spd = SpatialPointData[RandomReal[1, {100, 2}]]fn = ScalingTransform[{1 / 2, 2 / 3}];
spd1 = fn[spd]Show[RegionPlot[{spd["ObservationRegion"], spd1["ObservationRegion"]}, PlotLegends -> {"Original Region", "Transformed Region"}], ListPlot[{spd["Points"], spd1["Points"]}], AspectRatio -> Automatic]注釈 (6)
{names, pos} = Transpose[EntityValue[Entity["Country", "Ireland"]["LargestCities"], {"Name", "Position"}]];data = SpatialPointData[GeoPosition[pos] -> <|"Name" -> names|>]data[{"Annotations", "Name"}]AnnotationKeys[data]AnnotationValue[data, "Name"]loc = MapThread[Tooltip[#1, #2]&, {Thread@pos, names}];
GeoListPlot[loc, GeoRange -> Entity["Country", "Ireland"]["Polygon"]]data = {{41.69, 28.88}, {3.61, 16.75}, {493.6, 158.08}, {172.3, 52.17}, {509.57, 460.5}, {241.47, 82.14}, {299.61, 286.61}, {7.28, 387.6}, {429.98, 92.94}, {142.01, 195.63}};
annotations = { {"on", "off", "on", "on", "off", "off", "on", "on", "off", "off"}, {275.9, 241.2, 256., 442.9, 209.4, 260.4, 348.8, 315.2, 275.3, 317.8}};spd = SpatialPointData[data -> annotations]spd["Annotations"]spd[{"Annotations", "Keys"}]Show[spd["ObservationRegion"], PointValuePlot[spd, PlotLegends -> Automatic]]data = {{41.69, 28.88}, {3.61, 16.75}, {493.6, 158.08}, {172.3, 52.17}, {509.57, 460.5}, {241.47, 82.14}, {299.61, 286.61}, {7.28, 387.6}, {429.98, 92.94}, {142.01, 195.63}};
status = {"on", "off", "on", "on", "off", "off", "on", "on", "off", "off"};areas = {275.9, 241.2, 256., 442.9, 209.4, 260.4, 348.8, 315.2, 275.3, 317.8};spd = SpatialPointData[data -> <|"Cell Status" -> status, "Area" -> areas|>]spd[{"Annotations", "Keys"}]spd["Annotations"]spd[{"Annotations", "Cell Status"}]spd[{"Annotations", "Area"}]data = {{41.69, 28.88}, {3.61, 16.75}, {493.6, 158.08}, {172.3, 52.17}, {509.57, 460.5}, {241.47, 82.14}, {299.61, 286.61}, {7.28, 387.6}, {429.98, 92.94}, {142.01, 195.63}};
status = {"on", "off", "on", "on", "off", "off", "on", "on", "off", "off"};
types = RandomChoice[{"S", "R", "W"}, 10];areas = {275.9, 241.2, 256., 442.9, 209.4, 260.4, 348.8, 315.2, 275.3, 317.8};
thick = {1.2, 4.3, 1.5, 2.3, .9, .13, .98, .34, .7, 1.3};spd = SpatialPointData[data -> <|"Cell Status" -> status, "Area" -> areas, "Type" -> types, "Thicknes" -> thick|>]spd["Summary"]SparseArrayを使ってパターンの部分集合に注釈を割り当てる:
spd = SpatialPointData[RandomReal[1, {100, 2}] -> SparseArray[Thread[RandomChoice[Range[100], 20] -> 1], 100]]spd["Annotations"]ListPlot[spd["Annotations"][1]]GeoPositionで定義された空間データに注釈を加える:
geodata = GeoPosition@
	Transpose[{RandomReal[{-80, 80}, 10], RandomReal[{-180, 180}, 10]}];
annotations = { "status" -> {"on", "off", "on", "on", "off", "off", "on", "on", "off", "off"}, "value" -> {275.9, 241.2, 256., 442.9, 209.4, 260.4, 348.8, 315.2, 275.3, 317.8}};spd = SpatialPointData[geodata -> annotations, GeoBoundsRegion[{{-90, 90}, {-180, 180}}]]spd[{"Annotations"}]PointValuePlot[spd, {1 -> "Shape", 2 -> "Size"}, ColorFunction -> "BlueGreenYellow", PlotLegends -> Automatic]配置 (2)
pts = RandomReal[1, {10, 2}];
reg = Rectangle[{0, 0}, {1, 1}];colors = RandomChoice[ColorData[97, "ColorList"], 10];
diameters = {.1, .1, .1, .2, .2, .2, .3, .3, .3, .3};spd = SpatialPointData[{pts -> {"color" -> colors, "diameter" -> diameters}, pts -> {"index" -> Range[10]}}, reg]spd[{"Configuration", 1}]%["Summary"]spd[{"Configuration", {2, 1}}]%["Summary"]spd[{"Configuration", {1, 2, 1}}]%["Summary"]すべての点は位置を個々のSpatialPointDataオブジェクトとして抽出する:
spd = SpatialPointData[{RandomReal[1, {10, 2}], RandomReal[1, {12, 2}], RandomReal[1, {19, 2}]}]spd["ConfigurationList"]アプリケーション (8)
data = GeoPosition[«1»];GeoGraphics[Point[data]]アメリカ合衆国本土の醸造所のみでSpatialPointDataを作成する:
spd = SpatialPointData[data, EntityValue[GeoVariant[Entity["Country", "UnitedStates"], "DefaultMapArea"], "Polygon"]]GeoGraphics[Point[spd]]img = [image];ImageMeasurements[img, "Dimensions"]data = SpatialPointData[ImageKeypoints[img]]Show[img, RegionPlot[data["ObservationRegion"]], ListPlot[data, PlotStyle -> Red], AspectRatio -> Divide@@Most[ImageMeasurements[img, "Dimensions"]]]data = SpatialPointData[GeoPosition[EntityClass["NuclearReactor", "Operational"]["Position"]] -> {"Name" -> EntityClass["NuclearReactor", "Operational"]["Name"]}, GeoBoundsRegion[{{-90, 90}, {-180, 180}}]]GeoListPlot[data]parks = {...};parks//Lengthpos = Map[WikipediaData[#, "GeoPosition"]&, parks];lat = MinMax[pos[[All, 1, 1]]]lon = MinMax[pos[[All, 1, 2]]]region = GeoBoundsRegion[{lat, lon}]SpatialPointDataを定義する:
USparks = SpatialPointData[GeoPosition[pos], region]PointValuePlot[USparks, Axes -> False, PlotStyle -> Yellow, GeoBackground -> GeoStyling["Satellite", Opacity[.8]], AspectRatio -> .75]parks = SpatialPointData[GeoPosition[{{44.35, -68.21666667}, {38.68333, -109.56667}, {43.75, -102.5}, {29.25, -103.25},
{25.46944444, -80.18611111}, {38.56666667, -107.71666667}, {37.6283, -112.16766},
{38.16691, -109.75966}, {38.2, -111.16666667}, {32.17527778, -104 ... 89}, {32.25, -110.5},
{36.56471, -118.77337}, {38.53333333, -78.35}, {46.96666667, -103.45},
{18.33333333, -64.73333333}, {48.5, -92.88333333}, {43.55635, -103.47865}, {61, -142},
{44.6, -110.5}, {37.85, -119.55}, {37.20262, -112.98785}}] -> {"Area" -> StructuredArray[QuantityArray, {58}, StructuredArray`StructuredData[QuantityArray,
{74.04950209409239, 119.31513925749647, 381.2635262915919, 1251.8616004686503,
270.27677625484813, 48.04857964535431, 55.99417403548851, 527.5153243204484, 37 ... 2.88006903320968, 631.3503886270221,
310.97509513103995, 110.07890532864783, 22.95237679384096, 340.72146295896226,
44.212506050904075, 20588.075726757837, 3468.5433678823215, 1189.5203262536681,
229.06750175120817}, "Miles"^2, {{1}}]], "Name" -> {...}}]AnnotationKeys[parks]PointValuePlot[parks, "Size"]data = SpatialPointData[GeoPosition[{{41.393745, -89.566491}, {41.393737, -89.559088}, {40.550486, -88.060516},
{40.561286, -88.061514}, {39.065123, -88.674501}, {41.389193, -87.772914}, {42.48088, -88.99612},
{38.59651, -88.967736}, {39.352261, -89.644688}, {39.189 ... 189, -89.5971},
{39.864834, -89.594745}, {39.422809, -87.661666}, {38.548123, -89.773096}, {38.7849, -89.702307},
{38.095086, -88.913791}, {38.549088, -89.763343}, {38.788362, -89.688869},
{38.030752, -88.923769}, {41.21407, -90.330727}}] -> "Status" -> {...}, Entity["AdministrativeDivision", {"Illinois", "UnitedStates"}]]data["Annotations"]Legended[PointValuePlot[data], PointLegend[...]]locations = GeoPosition[{{41.393745, -89.566491}, {41.393737, -89.559088}, {40.550486, -88.060516},
{40.561286, -88.061514}, {39.065123, -88.674501}, {41.389193, -87.772914}, {42.48088, -88.99612},
{38.59651, -88.967736}, {39.352261, -89.644688}, {39.189 ... 189, -89.5971},
{39.864834, -89.594745}, {39.422809, -87.661666}, {38.548123, -89.773096}, {38.7849, -89.702307},
{38.095086, -88.913791}, {38.549088, -89.763343}, {38.788362, -89.688869},
{38.030752, -88.923769}, {41.21407, -90.330727}}];status = {...};
vending = {...};
accessibility = {...};
names = {...};areas = SpatialPointData[locations -> <|"Status" -> status, "Vending" -> vending, "Accessibility" -> accessibility, "Name" -> names|>]areas[{"Annotations", "Keys"}]使用可能な場所を,マウスオーバーで名前が表示されるようにして可視化する:
loc = MapThread[...];
legend = PointLegend[...];
Legended[GeoGraphics[{PointSize[.025], loc}, GeoProjection -> "Mercator", GeoRange -> Quantity[200, "Miles"]], legend]state = Entity["AdministrativeDivision", {"Oklahoma", "UnitedStates"}];data = EarthquakeData[state["Polygon"], 4, {{2010, 1, 1}, Today}, "Position"]
spd = SpatialPointData[GeoPosition[data["Values"]], state["Polygon"]]GeoGraphics[{Polygon[state], Point[spd]}]特性と関係 (2)
うまく定義されたSpatialPointDataの特性についてクエリを行う:
data = {{41.69, 28.88}, {133.61, 36.75}, {693.6, 38.08}, {172.3, 52.17}, {509.57, 60.5}, {211.47, 82.14}, {299.61, 86.61}, {567.28, 87.6}, {729.98, 92.94}, {42.01, 95.63}};
dmarks = {"on", "off", "on", "on", "off", "off", "on", "on", "off", "off"};cmarks = {275.9, 241.2, 256., 442.9, 209.4, 260.4, 348.8, 315.2, 275.3, 317.8};spd = SpatialPointData[data -> {"Cell Type" -> dmarks, "Area" -> cmarks}]spd["Properties"]spd /@ {"ObservationRegion", "PointCount"}spd["Association"]reg = Rectangle[{-4, -4}, {4, 4}];sample = RandomPointConfiguration[PoissonPointProcess[10, 2], reg]ListPlot[sample, AspectRatio -> 1]reg1 = Disk[{0, 2}, 2];
sample["PointCount", reg1]reg2 = Rectangle[{-4, -3}, {1, -1}];
sample["PointCount", reg2]Show[RegionPlot[{reg1, reg2}, PlotRange -> {{-4, 4}, {-4, 4}}], ListPlot[sample], Axes -> True]テキスト
Wolfram Research (2020), SpatialPointData, Wolfram言語関数, https://reference.wolfram.com/language/ref/SpatialPointData.html.
CMS
Wolfram Language. 2020. "SpatialPointData." Wolfram Language & System Documentation Center. Wolfram Research. https://reference.wolfram.com/language/ref/SpatialPointData.html.
APA
Wolfram Language. (2020). SpatialPointData. Wolfram Language & System Documentation Center. Retrieved from https://reference.wolfram.com/language/ref/SpatialPointData.html