"MultidimensionalScaling" (Machine Learning Method)
- Method for DimensionReduction, DimensionReduce, FeatureSpacePlot and FeatureSpacePlot3D.
- Reduce the dimension of data using a metric multidimensional scaling.
Details & Suboptions
- "MultidimensionalScaling" is a nonlinear distance-based dimensionality reduction method. The method attempts to find a low-dimensional embedding of data using a transformation that preserves the pairwise distances.
- "MultidimensionalScaling" is able to learn nonlinear manifolds; however, it can be slow when the number of examples is large.
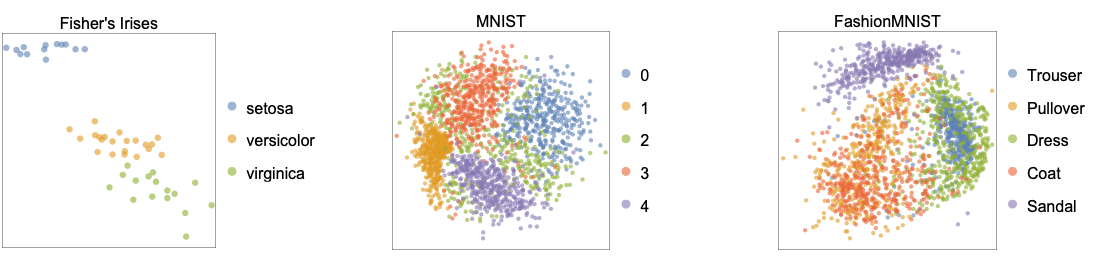
- The following plots show two-dimensional embeddings learned by the "MultidimensionalScaling" method applied to the benchmarking datasets Fisher's Irises, MNIST and FashionMNIST:
- Given the distance matrix
") of data points in the original space, "MultidimensionalScaling" attempts to find the lower-dimensional embeddings
of data points in the original space, "MultidimensionalScaling" attempts to find the lower-dimensional embeddings  , such that distances in the lower-dimensional space match the distances between data points in the original space,
  yi-yj
yi-yj ≈
≈ ") . The lower-dimensional embeddings
. The lower-dimensional embeddings  are computed by minimizing the embedding cost: ∑i,j [
 yi-yj
yi-yj -
- ") ]2.
]2. - The following suboptions can be given:
-
MaxIterations Automatic maximum number of optimization steps "MinRelativeChange" Automatic minimum relative change of the cost value to continue the optimization process
Examples
open all close allBasic Examples (2)
Reduce the dimension of random vectors using the "MultidimensionalScaling" method:
SeedRandom[1234];
vectors = RandomReal[1, {10, 4}];
DimensionReduce[vectors, Method -> "MultidimensionalScaling"]
Create and visualize a "Swiss roll" dataset:
SeedRandom[12];
data = Table[Insert[AngleVector[1 + {2, 8} * RandomReal[]], RandomReal[], 2], 500];ListPointPlot3D[data, BoxRatios -> {1, 1, 1}, Rule[...]]Train a nonlinear dimension reducer using "MultidimensionalScaling" on the dataset to map to two-dimensional space:
reducer = DimensionReduction[data, 2, Method -> "MultidimensionalScaling"]Find and visualize the data coordinates in the reduced space:
reducedpts = reducer[data];
ListPlot[Style[#, Hue[First[#] / 10]] & /@ reducedpts, ...]
Visualize the dataset in the original space, with each point colored according to its reduced variable:
ListPointPlot3D[Style[#, Hue[First[reducer[#]] / 10]] & /@ data, PlotStyle -> Directive[PointSize -> Large], BoxRatios -> {1, 1, 1}]Scope (1)
Dataset Visualization (1)
Load the Fisher Iris dataset from ExampleData:
iris = ExampleData[{"MachineLearning", "FisherIris"}, "Data"];RandomSample[iris, 5]Generate a reducer function using "MultidimensionalScaling" with the features of each example:
diris = DimensionReduction[iris[[All, 1]], 2, Method -> "MultidimensionalScaling"]Group the examples by their species:
byspecies = GroupBy[iris, Last -> First];Reduce the dimension of the features:
byspecies = diris /@ byspecies;Visualize the reduced dataset:
ListPlot[Values[byspecies], PlotLegends -> Keys[byspecies], ...]Options (1)
MaxIterations (1)
mnist = RandomSample[ResourceData["MNIST"][[All, 1]], 100];Reduce the dimension of images using "MultidimensionalScaling":
features = DimensionReduce[mnist, Method -> "MultidimensionalScaling"];Find the reduced features using a different MaxIterations option:
features2 = DimensionReduce[mnist, Method -> {"MultidimensionalScaling", MaxIterations -> 100}];Visualize the obtained features and compare the results:
Show[{ListPlot[List /@ features, Rule[...]],
	ListPlot[List /@ features2, Rule[...]]}]