



ImageWaveformPlot
ImageWaveformPlot[image]
image の波形をプロットする.
ImageWaveformPlot[image,colorspace]
colorspace 内の image の波形をプロットする.
ImageWaveformPlot[image,channel]
指定された channel の波形をプロットする.
詳細とオプション
- ImageWaveformPlotは,画像あるいは動画のフレームの明るさや色を評価して調整するために使われることが多い.
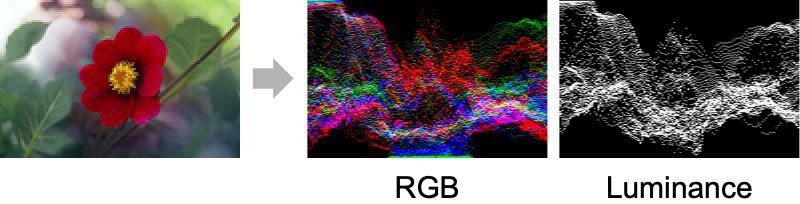
- 画像の波形において,列は画像の列に,行は画素のレベルに,点の強度はそのレベルにおける点の数に相当する.
- ImageHistogramを使って画像全体のヒストグラムを計算し,ImageVectorscopePlotを使って色相と彩度を評価調整する.
- 次の colorspace 指定が使える.
-
"RGB" 赤,緑,青(デフォルト) "CMYK" シアン,マゼンタ,黄,黒 "HSB" 色相,彩度,明度 "XYZ" CIE  色空間のチャンネル
"LAB" CIE  色空間のチャンネル
"LCH" CIE 

 色空間のチャンネル
"LUV" CIE  色空間のチャンネル
Automatic 画像の色空間のチャンネル - channel は以下のように指定できる.
-
"I" グレーレベル(強度) "L" Labの輝度チャンネル "R","G","B" RGBからの赤,緑,青 "C","M","Y","K" CMYKからのシアン,マゼンタ,黄,黒 "H","S","V" HSBからの色相,彩度,明度(の値) "Average" すべてのチャンネルの平均 "A" アルファチャンネル - 透明度がある画像については,アルファチャンネルが対応する画素の重みとして使われる.
- ImageWaveformPlotにはGraphicsと同じオプションに以下の追加・変更を加えたものが使える. [全オプションのリスト]
-
AspectRatio 1/GoldenRatio 整列に使うグラフィックス中のデフォルトの点 Frame True プロットの周りに枠を置くかどうか GridLines Automatic 描画する格子線 Masking All 関心領域 MaxPlotPoints Automatic 表示するサンプルの最大数 PlotLayout "Overlaid" 使用するレイアウト PlotRange Automatic 含める値の範囲 ScalingFunctions Automatic レベル数のスケーリング方法 - 次は,PlotLayoutの可能な設定である.
-
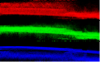
"Column" 列のチャンネルの波形 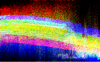
"Overlaid" 重ねられたチャンネルの波形 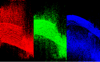
"Row" 行のチャンネルの波形(RGBパレード)
全オプションのリスト
例題
すべて開く すべて閉じるスコープ (3)
オプション (40)
AspectRatio (4)
ImageWaveformPlot[[image]]AspectRatio1を使ってプロットの幅と高さを等しくする:
ImageWaveformPlot[[image], AspectRatio -> 1]AspectRatioAutomaticは,プロット範囲から割合を決定する:
ImageWaveformPlot[[image], AspectRatio -> Automatic]AspectRatioFullは,他の構造物内にぴったり納まるように高さと幅を調整する:
plot = ImageWaveformPlot[[image], AspectRatio -> Full];{Framed[Pane[plot, {50, 100}]], Framed[Pane[plot, {100, 100}]], Framed[Pane[plot, {100, 50}]]}Axes (3)
デフォルトで,ImageWaveformPlotは軸ではなく枠を使う:
ImageWaveformPlot[[image]]ImageWaveformPlot[[image], Frame -> False, Axes -> True]{ImageWaveformPlot[[image], Frame -> False, Axes -> {True, False}], ImageWaveformPlot[[image], Frame -> False, Axes -> {False, True}]}AxesLabel (3)
ImageWaveformPlot[[image], Frame -> False, Axes -> True]

ImageWaveformPlot[[image], Frame -> False, Axes -> True, AxesLabel -> y]ImageWaveformPlot[[image], Frame -> False, Axes -> True, AxesLabel -> {x, y}]AxesOrigin (2)
AxesStyle (4)
ImageWaveformPlot[[image], "CMYK", Frame -> False, Axes -> True, AxesStyle -> Red]ImageWaveformPlot[[image], "CMYK", Frame -> False, Axes -> True, AxesStyle -> {{Thick, Brown}, {Thick, Blue}}]ImageWaveformPlot[[image], "CMYK", Frame -> False, Axes -> True, AxesStyle -> Green, TicksStyle -> Blue]ImageWaveformPlot[[image], "CMYK", Frame -> False, Axes -> True, AxesStyle -> Green, LabelStyle -> Blue]Frame (4)
ImageWaveformPlotは,デフォルトで,枠を使う:
ImageWaveformPlot[[image], "CMYK"]ImageWaveformPlot[[image], "CMYK", Frame -> False]ImageWaveformPlot[[image], "CMYK", Frame -> {{True, True}, {False, False}}]ImageWaveformPlot[[image], "CMYK", Frame -> {{True, False}, {True, False}}]FrameLabel (4)
ImageWaveformPlot[[image], "CMYK", Frame -> True, FrameLabel -> {"label"}]ImageWaveformPlot[[image], "CMYK", Frame -> True, FrameLabel -> {"bottom", "left"}]ImageWaveformPlot[[image], "CMYK", Frame -> True, FrameLabel -> {{"left", "right"}, {"bottom", "top"}}]ImageWaveformPlot[[image], "CMYK", Frame -> True, FrameLabel -> {{"left", "right"}, {"bottom", "top"}}, LabelStyle -> Directive[Bold, StandardGray]]FrameStyle (2)
FrameTicksStyle (3)
デフォルトで,枠目盛と枠目盛ラベルには枠と同じスタイルが使われる:
ImageWaveformPlot[[image], "CMYK", Frame -> True, FrameStyle -> Directive[Red]]ImageWaveformPlot[[image], "CMYK", Frame -> True, FrameStyle -> Directive[Red], FrameTicks -> All, FrameTicksStyle -> Directive[Blue, Thick]]ImageWaveformPlot[[image], "CMYK", Frame -> True, FrameStyle -> Directive[Red], FrameTicks -> All, FrameTicksStyle -> {{Directive[Orange, Thick], Blue}, {Directive[Orange, Thick], Green}}]ImageSize (7)
Tiny,Small,Medium,Largeのような名前付きにスタイルを使う:
{ImageWaveformPlot[[image], ImageSize -> Tiny], ImageWaveformPlot[[image], ImageSize -> Small]}{ImageWaveformPlot[[image], ImageSize -> 150], ImageWaveformPlot[[image], AspectRatio -> 1.5, ImageSize -> 150]}{ImageWaveformPlot[[image], ImageSize -> {Automatic, 150}], ImageWaveformPlot[[image], AspectRatio -> 2, ImageSize -> {Automatic, 150}]}{ImageWaveformPlot[[image], ImageSize -> UpTo[200]], ImageWaveformPlot[[image], AspectRatio -> 2, ImageSize -> UpTo[200]]}グラフィックスの幅と高さを指定して,必要な場合はスペースで充填する:
ImageWaveformPlot[[image], ImageSize -> {200, 200}, Background -> StandardGray]AspectRatioFullとすると,使用可能なスペースが塗り潰される:
ImageWaveformPlot[[image], AspectRatio -> Full, ImageSize -> {200, 200}, Background -> StandardGray]{ImageWaveformPlot[[image], ImageSize -> {UpTo[150], UpTo[100]}], ImageWaveformPlot[[image], AspectRatio -> 2, ImageSize -> {UpTo[150], UpTo[100]}]}ImageSizeFullを使ってオブジェクトの使用可能なスペースを塗り潰す:
Framed[Pane[ImageWaveformPlot[[image], ImageSize -> Full, Background -> StandardGray], {200, 100}]]Framed[Pane[ImageWaveformPlot[[image], AspectRatio -> Full, ImageSize -> {Scaled[0.5], Scaled[0.5]}, Background -> StandardGray], {200, 100}]]Masking (2)
i = [image];ImageWaveformPlot[i]ImageWaveformPlot[i, Masking -> [image]]i = [image];ImageWaveformPlot[i]これは,画像のアルファチャンネルをマスクとして使うことと等価である:
ImageWaveformPlot[RemoveAlphaChannel@i, Masking -> AlphaChannel@i]透明度とマスクの両方がある場合は,対応する画素値が乗算される:
ImageWaveformPlot[i, Masking -> AlphaChannel@i]PlotLayout (1)
テキスト
Wolfram Research (2020), ImageWaveformPlot, Wolfram言語関数, https://reference.wolfram.com/language/ref/ImageWaveformPlot.html.
CMS
Wolfram Language. 2020. "ImageWaveformPlot." Wolfram Language & System Documentation Center. Wolfram Research. https://reference.wolfram.com/language/ref/ImageWaveformPlot.html.
APA
Wolfram Language. (2020). ImageWaveformPlot. Wolfram Language & System Documentation Center. Retrieved from https://reference.wolfram.com/language/ref/ImageWaveformPlot.html