


ImageHistogram
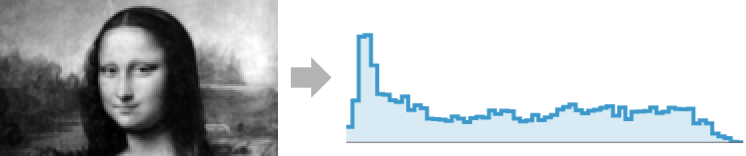
ImageHistogram[image]
plots a histogram of the pixel levels for each channel in image.
ImageHistogram[image,bspec]
uses bin specification bspec.
ImageHistogram[image,bspec,range]
plots the histogram of the pixel values in the given range.
Details and Options
- An image histogram is a graphical representation of the color distribution in an image.
- ImageHistogram works with arbitrary grayscale and multichannel 2D and 3D images.
- For RGB images, ImageHistogram by default displays the channels using red, green, and blue.
- Binning specification bspec can be any of the following:
-
n n equally spaced bins Automatic automatic choice of binning All return tally of all available pixel values "Byte" 256 levels after converting data values to a "Byte" type - By default, for binary images two bins are used; otherwise, 128 bins are used.
- The range can be of the following forms:
-
Automatic automatic ranges depending on the color space All include all values {All,max} include values below max {min,All} include values above min {min,max} include values between min and max - The following defaults are used for range depending on the image color space. The ranges are chosen to include the subspace of the "RGB" color space.
-
"Grayscale","RGB","CMYK","HSB" {0,1} "XYZ" {0,1} "LAB" {-1.13,1} "LCH" {0,1.3} "LUV" {-1.26,1.76} - ImageHistogram accepts options of ListPlot, with the following additions and changes: [List of all options]
-
Appearance Automatic detailed appearance of the histogram AspectRatio 1/3 ratio of height to width Axes False whether to draw axes Filling Axis how to fill in stems for each point Frame True whether to include a frame FrameTicks None frame ticks InterpolationOrder 0 the polynomial degree of curves used in joining data points Joined True whether to join bars Method "IncludeOutOfRange" method to use PlotRangePadding None how much to pad the range of values - Possible settings for Appearance are:
-
"RGB" show RGB channel values and overlapping colors "Separated" make separate histograms for each channel "Stacked" stack values for each channel "Transparent" show channels overlapping, using transparency - Possible settings for Method include:
-
"IncludeOutOfRange" values below range in first bin and values above range in last bin "ExcludeOutOfRange" do not count out-of-range values
List of all options
Examples
open all close allBasic Examples (4)
Scope (3)
By default, the number of displayed histogram levels is 128:
i = [image];
ImageHistogram[i]ImageHistogram[i, 8]ImageHistogram[i, All]Restore integer values of the image and display all 256 bins:
ImageHistogram[i, "Byte"]The default histogram range specification for a grayscale image is 0 to 1:
i = [image];
ImageHistogram[i, 64]
Use range specification All to plot the histogram from the minimum to maximum value in the image:
ImageHistogram[i, 64, All]Use a narrow range specification:
ImageHistogram[i, 64, {0.2, 0.7}]ImageHistogram[i, 64, {-1, 2}]Histogram of a 4-channel image:
ImageHistogram[ColorConvert[[image], "CMYK"], Appearance -> "Separated"]ImageHistogram[ColorConvert[[image], "LAB"]]ImageHistogram[ColorConvert[[image], "LCH"]]ImageHistogram[ColorConvert[[image], "LUV"]]Options (70)
Appearance (2)
Use additive colors to represent overlapping regions of histograms of an RGB image:
i = [image];ImageHistogram[i, Appearance -> "Transparent"]Show separate histograms for each color channel:
ImageHistogram[i, Appearance -> "Separated"]Stack the color channels vertically:
ImageHistogram[i, Appearance -> "Stacked"]For non-RGB images, default plotting colors are used for all appearances:
i = ColorConvert[[image], "LAB"];Transparent histogram of a Lab image:
ImageHistogram[i, Appearance -> "Transparent"]ImageHistogram[i, Appearance -> "Stacked"]ImageHistogram[i, Appearance -> "Separated"]AspectRatio (3)
By default, the function uses a fixed height to width ratio for the plot:
ImageHistogram[Import["ExampleData/turtle.jpg"]]Make the height the same as the width with AspectRatio1:
ImageHistogram[Import["ExampleData/turtle.jpg"], AspectRatio -> 1]AspectRatioFull adjusts the height and width to tightly fit inside other constructs:
plot = ImageHistogram[Import["ExampleData/turtle.jpg"], AspectRatio -> Full];{Framed[Pane[plot, {80, 100}]], Framed[Pane[plot, {100, 100}]], Framed[Pane[plot, {100, 50}]]}Axes (4)
By default, ImageHistogram uses a frame instead of axes:
ImageHistogram[Import["ExampleData/turtle.jpg"]]ImageHistogram[Import["ExampleData/turtle.jpg"], Frame -> False, Axes -> True]Use AxesOrigin to specify where the axes intersect:
ImageHistogram[Import["ExampleData/turtle.jpg"], Frame -> False, Axes -> True, AxesOrigin -> {0.2, 0}]Turn each axis on individually:
{ImageHistogram[Import["ExampleData/turtle.jpg"], Frame -> False, Axes -> {True, False}], ImageHistogram[Import["ExampleData/turtle.jpg"], Frame -> False, Axes -> {False, True}]}AxesLabel (3)
No axes labels are drawn by default:
ImageHistogram[Import["ExampleData/turtle.jpg"], Frame -> False, Axes -> True]ImageHistogram[Import["ExampleData/turtle.jpg"], Frame -> False, Axes -> True, AxesLabel -> "pixels"]ImageHistogram[Import["ExampleData/turtle.jpg"], Frame -> False, Axes -> True, AxesLabel -> {"level", "pixels"}]AxesOrigin (2)
The position of the axes is determined automatically:
ImageHistogram[Import["ExampleData/turtle.jpg"], Frame -> False, Axes -> True]Specify an explicit origin for the axes:
ImageHistogram[Import["ExampleData/turtle.jpg"], Frame -> False, Axes -> True, AxesOrigin -> {0.4, 0}]AxesStyle (4)
Change the style for the axes:
ImageHistogram[Import["ExampleData/turtle.jpg"], Frame -> False, Axes -> True, AxesStyle -> Red]Specify the style of each axis:
ImageHistogram[Import["ExampleData/turtle.jpg"], Frame -> False, Axes -> True, AxesStyle -> {{Thick, Red}, {Thick, Blue}}]Use different styles for the ticks and the axes:
ImageHistogram[Import["ExampleData/turtle.jpg"], Frame -> False, Axes -> True, AxesStyle -> Green, TicksStyle -> Red]Use different styles for the labels and the axes:
ImageHistogram[Import["ExampleData/turtle.jpg"], Frame -> False, Axes -> True, AxesStyle -> {{Red, Thick}, Magenta}, LabelStyle -> Orange]Frame (5)
ImageHistogram uses a frame by default:
ImageHistogram[Import["ExampleData/turtle.jpg"]]Use FrameFalse to turn off the frame:
ImageHistogram[Import["ExampleData/turtle.jpg"], Frame -> False]Draw a frame on the left and right edges:
ImageHistogram[Import["ExampleData/turtle.jpg"], Frame -> {{True, True}, {False, False}}]Draw a frame on the left and bottom edges:
ImageHistogram[Import["ExampleData/turtle.jpg"], Frame -> {{True, False}, {True, False}}]Turn off the frame and use axes instead:
ImageHistogram[Import["ExampleData/turtle.jpg"], Frame -> False, Axes -> True]FrameLabel (4)
Place a label along the bottom frame of a plot:
ImageHistogram[Import["ExampleData/turtle.jpg"], Frame -> True, FrameLabel -> {"label"}]Frame labels are placed on the bottom and left frame edges by default:
ImageHistogram[Import["ExampleData/turtle.jpg"], Frame -> True, FrameLabel -> {"bottom", "left"}]Place labels on each of the edges in the frame:
ImageHistogram[Import["ExampleData/turtle.jpg"], Frame -> True, FrameLabel -> {{"left", "right"}, {"bottom", "top"}}]Use a customized style for both labels and frame tick labels:
ImageHistogram[Import["ExampleData/turtle.jpg"], Frame -> True, FrameLabel -> {{"left", "right"}, {"bottom", "top"}}, LabelStyle -> Directive[Bold, StandardGreen]]FrameStyle (2)
Specify the style of the frame:
ImageHistogram[Import["ExampleData/turtle.jpg"], Frame -> True, FrameStyle -> Directive[StandardGreen, Thick]]Specify the style for each frame edge:
ImageHistogram[Import["ExampleData/turtle.jpg"], Frame -> True, FrameStyle -> {{Directive[StandardGreen, Thick], Red}, {Directive[Gray, Thick], Blue}}]FrameTicks (8)
Frame ticks are placed automatically by default:
ImageHistogram[Import["ExampleData/turtle.jpg"]]ImageHistogram[Import["ExampleData/turtle.jpg"], FrameTicks -> None]Use frame ticks on the bottom edge:
ImageHistogram[Import["ExampleData/turtle.jpg"], FrameTicks -> {{None, None}, {True, None}}]Use All to include tick labels on all edges:
ImageHistogram[Import["ExampleData/turtle.jpg"], FrameTicks -> All]Place tick marks at specific positions:
ImageHistogram[Import["ExampleData/turtle.jpg"], FrameTicks -> {{{5000, 10000, 15000}, None}, {{.1, .55, .9}, None}}]Draw frame tick marks at the specified positions with specific labels:
ImageHistogram[Import["ExampleData/turtle.jpg"], FrameTicks -> {{{{5000, a}, {10000, b}, {15000, c}}, None}, {{{.1, d}, {.55, e}, {.9, f}}, None}}]Specify the lengths for tick marks as a fraction of the graphics size:
ImageHistogram[Import["ExampleData/turtle.jpg"], FrameTicks -> {{{{5000, a, .05}, {10000, b, .05}, {15000, c, .05}}, None}, {{{.1, d, .05}, {.55, e, .15}, {.9, f, .01}}, None}}]Use different sizes in the positive and negative directions for each tick mark:
ImageHistogram[Import["ExampleData/turtle.jpg"], FrameTicks -> {{{{200, a, {.05, .15}}, {10000, b, {.05, .1}}, {15000, c, {.05, .05}}}, None}, {Automatic, None}}]Specify a style for each frame tick:
ImageHistogram[Import["ExampleData/turtle.jpg"], FrameTicks -> {{{{200, a, {.05, .15}, Darker@Green}, {400, b, {.05, .1}, Directive[Red, Thick, Dashed]}, {600, c, {.05, .05}, Directive[Green, Thick, Dashed]}}, None}, {Automatic, None}}]FrameTicksStyle (3)
By default, the frame ticks and frame tick labels use the same styles as the frame:
ImageHistogram[Import["ExampleData/turtle.jpg"], Frame -> True, FrameStyle -> Directive[Red]]Specify an overall style for the ticks, including the labels:
ImageHistogram[Import["ExampleData/turtle.jpg"], Frame -> True, FrameStyle -> Directive[Red], FrameTicks -> All, FrameTicksStyle -> Directive[Blue, Thick]]Use different styles for the different frame edges:
ImageHistogram[Import["ExampleData/turtle.jpg"], Frame -> True, FrameStyle -> Directive[Red], FrameTicks -> All, FrameTicksStyle -> {{Directive[Magenta, Thick], Blue}, {Directive[Magenta, Thick], Green}}]ImageSize (7)
Use named sizes such as Tiny, Small, Medium and Large:
{ImageHistogram[Import["ExampleData/turtle.jpg"], ImageSize -> Tiny], ImageHistogram[Import["ExampleData/turtle.jpg"], ImageSize -> Small]}Specify the width of the plot:
{ImageHistogram[Import["ExampleData/turtle.jpg"], ImageSize -> 150], ImageHistogram[Import["ExampleData/turtle.jpg"], AspectRatio -> 1.5, ImageSize -> 150]}Specify the height of the plot:
{ImageHistogram[Import["ExampleData/turtle.jpg"], ImageSize -> {Automatic, 100}], ImageHistogram[Import["ExampleData/turtle.jpg"], AspectRatio -> 2, ImageSize -> {Automatic, 100}]}Allow the width and height to be up to a certain size:
{ImageHistogram[Import["ExampleData/turtle.jpg"], ImageSize -> UpTo[200]], ImageHistogram[Import["ExampleData/turtle.jpg"], AspectRatio -> 2, ImageSize -> UpTo[200]]}Specify the width and height for a graphic, padding with space if necessary:
ImageHistogram[Import["ExampleData/turtle.jpg"], ImageSize -> {200, 200}, Background -> StandardOrange]Setting AspectRatioFull will fill the available space:
ImageHistogram[Import["ExampleData/turtle.jpg"], AspectRatio -> Full, ImageSize -> {200, 200}, Background -> StandardOrange]Use maximum sizes for the width and height:
{ImageHistogram[Import["ExampleData/turtle.jpg"], ImageSize -> {UpTo[150], UpTo[100]}], ImageHistogram[Import["ExampleData/turtle.jpg"], AspectRatio -> 2, ImageSize -> {UpTo[150], UpTo[100]}]}Use ImageSizeFull to fill the available space in an object:
Framed[Pane[ImageHistogram[Import["ExampleData/turtle.jpg"], ImageSize -> Full, Background -> StandardOrange], {200, 100}]]Specify the image size as a fraction of the available space:
Framed[Pane[ImageHistogram[Import["ExampleData/turtle.jpg"], ImageSize -> {Scaled[0.5], Scaled[0.5]}, Background -> StandardOrange], {200, 100}]]InterpolationOrder (2)
Joined (1)
Method (1)
PlotLegends (4)
By default, no legend is shown:
ImageHistogram[[image]]ImageHistogram[[image], Appearance -> "Stacked", PlotLegends -> "Expressions"]ImageHistogram[[image], Appearance -> "Stacked", PlotLegends -> {"red channel", "green channel", "blue channel"}]Using Appearance"RGB", there are seven segments and therefore legends to show:
ImageHistogram[[image], Appearance -> "RGB", PlotLegends -> "Expressions"]PlotRange (1)
Use PlotRange->Automatic for automatically determining the plot range:
i = [image];ImageHistogram[i, PlotRange -> Automatic]PlotRange->All includes the entire histogram:
ImageHistogram[i, PlotRange -> All]Modify the plot range to better visualize the distribution of higher intensities:
ImageHistogram[i, PlotRange -> {0, 100}, Frame -> False, Axes -> True]PlotTheme (3)
ImageHistogram[[image], PlotTheme -> "Minimal"]Add horizontal grid lines to the plot:
ImageHistogram[[image], PlotTheme -> "Minimal", GridLines -> {None, Automatic}]Use a theme with dark background in a high-contrast color scheme:
ImageHistogram[[image], PlotTheme -> "Marketing"]Ticks (7)
Ticks are placed automatically in each chart:
ImageHistogram[Import["ExampleData/turtle.jpg"], Frame -> False, Axes -> True]Use TicksNone to draw axes without any tick marks:
ImageHistogram[Import["ExampleData/turtle.jpg"], Frame -> False, Axes -> True, Ticks -> None]ImageHistogram[Import["ExampleData/turtle.jpg"], Frame -> False, Axes -> True, Ticks -> {Range[0, 1, .25], Range[0, 20000, 6000]}]Place tick marks at specific positions:
ImageHistogram[Import["ExampleData/turtle.jpg"], Frame -> False, Axes -> True, Ticks -> {{.1, .55, .9}, {5000, 10000, 15000}}]Draw tick marks at the specified positions with the specified labels:
ImageHistogram[Import["ExampleData/turtle.jpg"], Frame -> False, Axes -> True, Ticks -> {{{.1, a}, {.55, b}, {.9, c}}, {{5000, d}, {10000, e}, {15000, f}}}]Specify the lengths for ticks as a fraction of graphics size:
ImageHistogram[Import["ExampleData/turtle.jpg"], Frame -> False, Axes -> True, Ticks -> {{{.1, a, Automatic}, {.55, b, .11}, {.9, c, Automatic}}, {{5000, d, .05}, {10000, e, Automatic}, {15000, f, Automatic}}}]Use different sizes in the positive and negative directions for each tick:
ImageHistogram[Import["ExampleData/turtle.jpg"], Frame -> False, Axes -> True, Ticks -> {{{.1, a, {Automatic, .05}}, {.55, b, {.1, .1}}, {.9, c, {.1, 0.15}}}, Automatic}]Specify a style for each tick:
ImageHistogram[Import["ExampleData/turtle.jpg"], Frame -> False, Axes -> True, Ticks -> {{{.1, a, {Automatic, .05}, Directive[Blue, Dashed, Thick]}, {.55, b, {.1, .1}, Directive[Blue, Thick]}, {.9, c, {.1, 0.15}, Directive[Red, Dashed, Thick]}}, Automatic}]TicksStyle (4)
By default, the ticks and tick labels use the same styles as the axis:
ImageHistogram[Import["ExampleData/turtle.jpg"], Frame -> False, Axes -> True]Specify an overall ticks style, including the tick labels:
ImageHistogram[Import["ExampleData/turtle.jpg"], Frame -> False, Axes -> True, TicksStyle -> Red]Specify ticks style for each of the axes:
ImageHistogram[Import["ExampleData/turtle.jpg"], Frame -> False, Axes -> True, TicksStyle -> {Directive[Red, Thick], Directive[Blue, Thick]}]Use a different style for the tick labels and tick marks:
ImageHistogram[Import["ExampleData/turtle.jpg"], Frame -> False, Axes -> True, TicksStyle -> Directive[Red, Thick], LabelStyle -> Blue]Applications (1)
Use the image histograms to estimate a suitable threshold:
i = [image];Select threshold value using visual inspection of histograms:
ImageHistogram[i, Frame -> False, Axes -> True, Ticks -> True, Epilog -> {Red, Line[{{0.7, 0}, {0.7, 900}}]}]Binarize image using selected threshold:
Binarize[i, 0.7]Properties & Relations (3)
Image histogram can also be computed using Histogram; however, it is slower:
AbsoluteTiming[ImageHistogram[[image], 60, Joined -> False]]AbsoluteTiming[Histogram[Flatten /@ ImageData[[image], Interleaving -> False], 60]]Find the histogram distribution of an image:
dist = HistogramDistribution[Flatten[ImageData[[image]]]]Plot[PDF[dist, x], {x, 0, 1}, Filling -> Bottom]ImageHistogram blends alpha channel with black:
i = [image];ImageHistogram[i]Blend with black before computing the histogram:
ImageHistogram[RemoveAlphaChannel[i, Black]]ImageHistogram[RemoveAlphaChannel[i, White]]ImageHistogram[RemoveAlphaChannel[i]]Possible Issues (2)
Counts of pixels outside of histogram range are displayed in the extremal bins:
ImageHistogram[(-1)[image]]Change range specification to display the counts:
ImageHistogram[(-1)[image], Automatic, {-1, 0}]Histograms with varying bin widths cannot be displayed using the "Stacked" appearance:
ImageHistogram[[image], 30, All, Appearance -> "Stacked"]ImageHistogram[[image], 30, All, Appearance -> "Transparent"]Interactive Examples (1)
Interactive histogram of an RGB image:
Manipulate[ImageHistogram[[image], n, {left, right}, Method -> clip, Joined -> join, Appearance -> m], {{n, 128}, 1, 256, 1}, {{left, 0}, -1, 1.5}, {{right, 1}, -0.5, 1.5}, {clip, {"IncludeOutOfRange", "ExcludeOutOfRange"}}, {join, {True, False}}, {{m, "RGB", "Appearance"}, {"Transparent", "RGB", "Stacked", "Separated"}}]Text
Wolfram Research (2008), ImageHistogram, Wolfram Language function, https://reference.wolfram.com/language/ref/ImageHistogram.html (updated 2014).
CMS
Wolfram Language. 2008. "ImageHistogram." Wolfram Language & System Documentation Center. Wolfram Research. Last Modified 2014. https://reference.wolfram.com/language/ref/ImageHistogram.html.
APA
Wolfram Language. (2008). ImageHistogram. Wolfram Language & System Documentation Center. Retrieved from https://reference.wolfram.com/language/ref/ImageHistogram.html