

LineBreakChart
LineBreakChart[{{date1,p1},{date2,p2},…}]
生成一个三值线图,其中在日期 datei 的价格为 pi.
LineBreakChart[{"name",daterange}]
生成一个三值线图,其中显示在日期范围 daterange 上金融实体 "name" 的收盘价格.
LineBreakChart[{…},n]
生成一个三值线图,其中连续的 n 支柱引起一次反转.
更多信息和选项
- LineBreakChart 显示为一系列垂直的柱,其中可能在单支柱中包含多个价格,在这里价格趋势表现突出.
- LineBreakChart[{{…,p1},{…,p2},…},n] 考虑过去
 天的价格. 如果过去
 天的价格是上涨的
 ,则如果
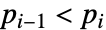 则绘制一支新的上涨柱,如果
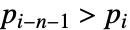 则绘制一支新的下跌柱;否则,不绘制新的柱. 这对于下跌价格是相同的. 如果没有长度为
 的上涨或下跌价格序列,则该规则应用于前两个价格.
- 对于三值线图,LineBreakChart[…] 等价于 LineBreakChart[…,3].
- 日期 datei 视为由事件组成的有序序列,并且不以绝对的时间度量显示.
- datei 的日期格式与 DateListPlot 中所用的相同.
- "name" 和 daterange 与 FinancialData 中所用的相同.
- LineBreakChart 的数据元素可以以下面形式给出:
-
{datei,pi} 一个纯日期和价格对 {datei,Quantity[pi,ui]} 具有单位的日期价格 wi[{datei,pi},…] 一个日期价格以及封装 wi formimi 一个具有元数据 mi 的价格 - 一支柱可能表示一些日期-价格对,而相应的封装将应用于整支柱.
- 不以这些形式给出的数据视为缺失数据,并且通常当产生图表时,被排除.
- LineBreakChart 的数据可以以如下形式给出:
-
{e1,e2,…},{"name",daterange} 不具有整体封装的数据 TimeSeries[…],EventSeries[…],TemporalData[…] 时间序列、事件序列和时间数据 w[{e1,e2,…}],w[{"name",daterange}] 具有整体封装的数据 - LineBreakChart[Tabular[…]cspec] 使用列规范 cspec 从表格对象中提取并绘制数值.
- 在绘制表格数据时,允许使用以下形式的列规范 cspec:
-
{coldate,colp} 将 colp 列中的数值与 coldate 列中的日期绘制成图 - 对于数据元素,可以使用以下封装:
-
Annotation[e,label] 提供一个注解 Button[e,action] 当该元素被点击时,定义要执行的操作 EventHandler[e,…] 对该元素定义一个通用事件句柄 Hyperlink[e,uri] 使元素作为一个超链接起作用 Labeled[e,…] 使用标签显示该元素 PopupWindow[e,cont] 对该元素附加一个弹出窗口 StatusArea[e,label] 当鼠标移过该元素时在状态栏中显示 Style[e,opts] 使用指定样式显示该元素 Tooltip[e,label] 对该元素附加一个任意的工具提示条 - 在 LineBreakChart 中,Labeled 和 Placed 允许下列位置信息:
-
Top,Bottom,Left,Right,Center 柱内位置 Above, Below, Before, After 柱外位置 {{bx,by},{lx,ly}} 在柱形中尺度缩放后的位置 {bx,by} 上,该位置处的标签中的尺度缩放后的位置 {lx,ly} - LineBreakChart 具有和 Graphics 相同的选项,另外有以下添加和变动: [所有选项的列表]
-
AspectRatio 1/GoldenRatio 整体高宽比 Axes True 是否绘制轴 ChartBaseStyle Automatic 柱形的整体样式 ChartElementFunction Automatic 如何生成柱形的原始图形 ChartElements Automatic 在每支柱中所用的图形 DateFunction Automatic 如何把日期转化为标准形式 EventLabels None 要添加标签的事件 GridLines Automatic 要绘制的网格线 GridLinesStyle Automatic 网格线的样式 PerformanceGoal $PerformanceGoal 尝试优化的性能方面 PlotTheme $PlotTheme 图表的整体主题 ScalingFunctions None 如何对单个坐标进行尺度缩放 TargetUnits Automatic 图表中显示的单位 TrendStyle Automatic 如何对上涨和下跌趋势进行样式化处理 - 提供给 ChartElementFunction 的参数为柱形区域 {{xmin,xmax},{ymin,ymax}}、日期-价格对 list 和元数据{m1,m2,…}.
- ChartElementFunction 的内置设置列表可以从 ChartElementData["LineBreakChart"] 获取.
- 在设置 ChartElements->{up,down} 下,up 和 down 将分别用于上涨和下跌的柱形.
- EventLabels->{…,datei->lbli,…} 指定与 datei 相关联的一个标签. 该标签将与把 datei 包括在日期范围内的柱形一同显示.
- 在 ScalingFunctions->sy 下,对价格应用函数 sy. ScalingFunctions 仅对显示产生影响,而并不影响控件.
- 在 LineBreakChart 中,来自选项和其它结构的样式及其它规范按下列顺序依次应用:TrendStyle、Style 和其它封装、ChartElementFunction,其中后面的规范覆盖前面的规范.
所有选项的列表
范例
打开所有单元 关闭所有单元基本范例 (2)
data = FinancialData["AAPL", "Close", {{2009, 5, 1}, {2010, 4, 30}, "Day"}];LineBreakChart[data]使用 FinancialData 实体三个月内的价格数据:
LineBreakChart["^GSPC"]LineBreakChart[{"^GSPC", {{2009, 1, 1}, {2009, 12, 31}}}]范围 (20)
数据和封装 (9)
LineBreakChart["DOW"]LineBreakChart[{"IBM", {{2009, 10, 1}, {2010, 3, 31}}}]获取 FinancialData:
data = FinancialData["MSFT", {{2009, 6, 1}, {2009, 12, 1}}];LineBreakChart[data]Table[LineBreakChart[{"IBM", {{2009, 10}, {2010, 2}}}, i, PlotLabel -> i], {i, {3, 5}}]data = FinancialData["AAPL", {{2010, 1, 1}, {2010, 2, 28}}];LineBreakChart[data, AxesLabel -> Automatic]data = FinancialData["AAPL", {{2010, 1, 1}, {2010, 2, 28}}];LineBreakChart[data, AxesLabel -> Automatic, TargetUnits -> "Euros"]数据可以是 TimeSeries、EventSeries 或者 TemporalData:
data = EventSeries[FinancialData["BAC", {{2014, 1}, {2014, 4}}]]LineBreakChart[data]LineBreakChart[Style[{{{2010, 1, 4}, 130.54}, {{2010, 1, 5}, 128.96}, {{2010, 1, 6}, 128.13}, {{2010, 1, 7}, 127.68}, {{2010, 1, 8}, 128.96}, {{2010, 1, 11}, 127.61}, {{2010, 1, 12}, 128.63}, {{2010, 1, 13}, 128.35}, {{2010, 1, 14}, 130.4}, {{2010, 1, 15}, 129.88}, {{2010, 1, 19}, 132.21}, {{2010, 1, 20}, 128.37}}, EdgeForm[Dashed]]]利用 PopupWindow 来提供额外的下拉信息:
LineBreakChart[PopupWindow[{{{2010, 1, 4}, 130.54}, {{2010, 1, 5}, 128.96}, {{2010, 1, 6}, 128.13}, {{2010, 1, 7}, 127.68}, {{2010, 1, 8}, 128.96}, {{2010, 1, 11}, 127.61}, {{2010, 1, 12}, 128.63}, {{2010, 1, 13}, 128.35}, {{2010, 1, 14}, 130.4}, {{2010, 1, 15}, 129.88}, {{2010, 1, 19}, 132.21}, {{2010, 1, 20}, 128.37}}, TradingChart["AAPL"]]]表格数据 (1)
stock = ToTabular[IconizedObject[«stock data»], "Columns", <|"ColumnKeys" -> {"date", "open", "high", "low", "close", "volume"}|>]LineBreakChart[stock -> {"date", "high"}]LineBreakChart[stock -> {"date", "high"}, PlotTheme -> "Business"]样式和外观 (7)
LineBreakChart[{"IBM", {{2010, 1, 1}, {2010, 1, 15}}}, TrendStyle -> {Green, Red}, ChartBaseStyle -> EdgeForm[Blue]]LineBreakChart[{"IBM", {{2010, 1, 1}, {2010, 1, 15}}}, TrendStyle -> "BlueYellow"]LineBreakChart[{"IBM", {{2010, 1, 1}, {2010, 1, 15}}}, TrendStyle -> "BlackWhite"]ChartBaseStyle 可用于设置所有图表元素的样式:
LineBreakChart[{"IBM", {{2010, 1, 1}, {2010, 1, 15}}}, TrendStyle -> {Green, Red}, ChartBaseStyle -> EdgeForm[Black]]Style 可用于重载样式:
LineBreakChart[Style[{{{2010, 1, 4}, 130.54}, {{2010, 1, 5}, 128.96}, {{2010, 1, 6}, 128.13}, {{2010, 1, 7}, 127.68}, {{2010, 1, 8}, 128.96}, {{2010, 1, 11}, 127.61}, {{2010, 1, 12}, 128.63}, {{2010, 1, 13}, 128.35}, {{2010, 1, 14}, 130.4}, {{2010, 1, 15}, 129.88}, {{2010, 1, 19}, 132.21}, {{2010, 1, 20}, 128.37}}, EdgeForm[None]], ChartBaseStyle -> EdgeForm[Dashed]]ChartElementData["LineBreakChart"]Table[LineBreakChart[{"IBM", {{2010, 1, 1}, {2010, 1, 15}}}, ChartElementFunction -> f], {f, {"FadingRectangle", "ArrowRectangle"}}]LineBreakChart[{"JPM", {{2010, 3, 15}, {2010, 5, 1}}}, PlotTheme -> "Business"]LineBreakChart[{"JPM", {{2010, 3, 15}, {2010, 5, 1}}}, PlotTheme -> "Marketing"]添加标签 (3)
使用 Labeled 对一个柱体添加标签:
LineBreakChart[{{{2010, 1, 4}, 130.54}, {{2010, 1, 5}, 128.96}, {{2010, 1, 6}, 128.13}, {{2010, 1, 7}, 127.68}, {{2010, 1, 8}, 128.96}, {{2010, 1, 11}, 127.61}, {{2010, 1, 12}, 128.63}, {{2010, 1, 13}, 128.35}, {{2010, 1, 14}, 130.4}, {{2010, 1, 15}, 129.88}, {{2010, 1, 19}, 132.21}, Labeled[{{2010, 1, 20}, 128.37}, "label"]}]Table[LineBreakChart[{{{2010, 1, 4}, 130.54}, {{2010, 1, 5}, 128.96}, {{2010, 1, 6}, 128.13}, {{2010, 1, 7}, 127.68}, {{2010, 1, 8}, 128.96}, {{2010, 1, 11}, 127.61}, {{2010, 1, 12}, 128.63}, {{2010, 1, 13}, 128.35}, {{2010, 1, 14}, 130.4}, {{2010, 1, 15}, 129.88}, {{2010, 1, 19}, 132.21}, Labeled[{{2010, 1, 20}, 128.37}, "label", p]}], {p, {Above, Below, Before, After}}]LineBreakChart[{"IBM", {{2010, 1, 1}, {2010, 1, 15}}}, EventLabels -> {{2010, 1, 5} -> "label1", {2010, 1, 8} -> "label2", {2010, 1, 14} -> "label3"}]利用 Placed 控制标签位置,对 Labeled 使用相同的位置信息:
LineBreakChart[{"IBM", {{2010, 1, 1}, {2010, 1, 15}}}, EventLabels -> {{2010, 1, 5} -> Placed["label1", Before], {2010, 1, 8} -> Placed["label2", Above]}]选项 (91)
AspectRatio (4)
默认情况下,LineBreakChart 使用固定的高宽比:
LineBreakChart[{"USO", {{2019, 10, 1}, {2021, 5, 31}}}]通过设置 AspectRatio1 使高等和宽度相等:
LineBreakChart[{"USO", {{2019, 10, 1}, {2021, 5, 31}}}, AspectRatio -> 1]AspectRatioAutomatic 根据绘图范围确定高宽比:
LineBreakChart[{"USO", {{2019, 10, 1}, {2021, 5, 31}}}, AspectRatio -> Automatic]AspectRatioFull 调整高度和宽度以便可以恰当地放在其他结构的里面:
plot = LineBreakChart[{"USO", {{2019, 10, 1}, {2021, 5, 31}}}];{Framed[Pane[plot, {120, 100}]], Framed[Pane[plot, {100, 50}]]}Axes (3)
默认情况下,LineBreakChart 绘制坐标轴:
LineBreakChart[{"USO", {{2019, 10, 1}, {2021, 5, 31}}}]LineBreakChart[{"USO", {{2019, 10, 1}, {2021, 5, 31}}}, Axes -> False]{LineBreakChart[{"USO", {{2019, 10, 1}, {2021, 5, 31}}}, Axes -> {True, False}], LineBreakChart[{"USO", {{2019, 10, 1}, {2021, 5, 31}}}, Axes -> {False, True}]}AxesLabel (5)
LineBreakChart[{"TSLA", {{2019, 1}, {2021, 1}}}]
LineBreakChart[{"TSLA", {{2019, 1}, {2021, 1}}}, AxesLabel -> "$"]LineBreakChart[{"TSLA", {{2019, 1}, {2021, 1}}}, AxesLabel -> {"time", "$"}]绘制 FinancialData 时用单位作为标签:
LineBreakChart[FinancialData["MSFT", "Price", {{2009, 10, 1}, {2010, 3, 31}}], AxesLabel -> Automatic]LineBreakChart[FinancialData["MSFT", "Price", {{2009, 10, 1}, {2010, 3, 31}}], AxesLabel -> Automatic, TargetUnits -> "Euro"]AxesOrigin (3)
LineBreakChart[{"AAPL", {{2010, 2, 9}, {2014, 2, 27}}}]LineBreakChart[{"AAPL", {{2010, 2, 9}, {2014, 2, 27}}}, AxesOrigin -> {{2012, 2, 28}, Automatic}]
Table[LineBreakChart[{"AAPL", {{2010, 2, 9}, {2014, 2, 27}}}, AxesOrigin -> {i, Automatic}, PlotLabel -> i], {i, {Left, Right}}]AxesStyle (4)
LineBreakChart[{"USO", {{2019, 10, 1}, {2021, 5, 31}}}, AxesStyle -> Red]LineBreakChart[{"USO", {{2019, 10, 1}, {2021, 5, 31}}}, AxesStyle -> {{Thick, Red}, {Thick, Blue}}]LineBreakChart[{"USO", {{2019, 10, 1}, {2021, 5, 31}}}, AxesStyle -> Green, TicksStyle -> Red]LineBreakChart[{"USO", {{2019, 10, 1}, {2021, 5, 31}}}, AxesStyle -> Green, LabelStyle -> StandardBlue]ChartBaseStyle (3)
利用 ChartBaseStyle 对柱形进行样式化处理:
LineBreakChart[{"IBM", {{2010, 3}, {2010, 5}}}, ChartBaseStyle -> EdgeForm[Dashed]]ChartBaseStyle 与 TrendStyle 合起来使用:
LineBreakChart[{"IBM", {{2010, 3}, {2010, 5}}}, TrendStyle -> {Green, Red}, ChartBaseStyle -> EdgeForm[Dashed]]ChartStyle 可能重载 ChartBaseStyle 的设置:
LineBreakChart[{"IBM", {{2010, 3}, {2010, 5}}}, TrendStyle -> {Directive[EdgeForm[], Green], Directive[EdgeForm[], Red]}, ChartBaseStyle -> EdgeForm[Dashed]]Style 可能重载 ChartBaseStyle 的设置:
LineBreakChart[Style[{{{2010, 2, 1}, 123.48}, {{2010, 2, 2}, 124.33}, {{2010, 2, 3}, 124.46}, {{2010, 2, 4}, 121.83}, {{2010, 2, 5}, 122.34}, {{2010, 2, 8}, 121.26}, {{2010, 2, 9}, 122.58}, {{2010, 2, 10}, 122.18}, {{2010, 2, 11}, 123.1}, {{2010, 2, 12}, 123.37}, {{2010, 2, 16}, 124.59}, {{2010, 2, 17}, 125.69}, {{2010, 2, 18}, 127.16}, {{2010, 2, 19}, 126.54}, {{2010, 2, 22}, 126.2}, {{2010, 2, 23}, 125.82}, {{2010, 2, 24}, 126.94}, {{2010, 2, 25}, 126.42}, {{2010, 2, 26}, 126.51}}, EdgeForm[Blue]], 1, ChartBaseStyle -> EdgeForm[Red]]ChartElementFunction (4)
获取 ChartElementFunction 的内置设置列表:
ChartElementData["LineBreakChart"]Table[LineBreakChart[{"IBM", {{2010, 3}, {2010, 5}}}, ChartElementFunction -> f, PlotLabel -> f], {f, {"ArrowRectangle", "ObliqueRectangle"}}]Table[LineBreakChart[{"IBM", {{2010, 3}, {2010, 5}}}, ChartElementFunction -> f, PlotLabel -> f], {f, {"FadingRectangle", "GlassRectangle"}}]这些 ChartElementFunction 对象显示全局刻度:
Table[LineBreakChart[{"IBM", {{2010, 3}, {2010, 5}}}, ChartElementFunction -> f, PlotLabel -> f], {f, {"GradientScaleRectangle", "SegmentScaleRectangle"}}]编写一个自定义 ChartElementFunction:
f[{{xmin_, xmax_}, {ymin_, ymax_}}, ___] := Rectangle[{xmin, ymin}, {xmax, ymax}, RoundingRadius -> Offset[5]]LineBreakChart[{"IBM", {{2010, 3}, {2010, 5}}}, ChartElementFunction -> f]ChartElements (7)
对柱形使用任意 Graphics 对象:
LineBreakChart[{"IBM", {{2010, 3}, {2010, 5}}}, ChartElements -> Graphics[Disk[]]]LineBreakChart[{"IBM", {{2010, 3}, {2010, 5}}}, ChartElements -> {Graphics[Disk[]], Graphics[Circle[]]}]图形元素采用 TrendStyle 的样式:
LineBreakChart[{"IBM", {{2010, 3}, {2010, 5}}}, ChartElements -> {[image], [image]}]LineBreakChart[{"IBM", {{2010, 3}, {2010, 5}}}, ChartElements -> Graphics3D[Cuboid[], Boxed -> False, Lighting -> "Neutral"]]LineBreakChart[{"IBM", {{2010, 3}, {2010, 5}}}, ChartElements -> [image]]LineBreakChart[{"IBM", {{2010, 3}, {2010, 5}}}, ChartElements -> [image]]LineBreakChart[{"IBM", {{2010, 3}, {2010, 5}}}, ChartElements -> {Graphics[Disk[]], {All, 1}}]Table[LineBreakChart[{"IBM", {{2010, 3}, {2010, 5}}}, ChartElements -> {Graphics[Disk[], AspectRatio -> Full], s}, PlotLabel -> s], {s, {{1 / 2, 1}, {1, 1 / 2}}}]EventLabels (3)
LineBreakChart[{"IBM", {{2010, 3}, {2010, 5}}}, EventLabels -> {{2010, 3, 11} -> "label"}]FinancialData["IBM", "RawClose", {{2010, 3, 11}}]使用 Placed 来控制标签位置:
Table[LineBreakChart[{"IBM", {{2010, 3}, {2010, 5}}}, EventLabels -> {{2010, 3, 11} -> Placed["label", i]}, PlotLabel -> i], {i, {Above, Below, Before, After}}]使用 Placed 控制标签外观:
Table[LineBreakChart[{"AAPL", {{2010, 1, 1}, {2010, 3, 1}}}, EventLabels -> {{2010, 1, 10} -> Placed["label", Below, s]}], {s, {Style[#, 24]&, Framed, Panel, "GlassBubble"}}]Frame (3)
默认情况下,LineBreakChart 不显示边框:
LineBreakChart[{"^GSPC", {{2009, 1, 1}, {2009, 12, 31}}}]LineBreakChart[{"^GSPC", {{2009, 1, 1}, {2009, 12, 31}}}, Frame -> True]LineBreakChart[{"^GSPC", {{2009, 1, 1}, {2009, 12, 31}}}, Frame -> {{True, False}, {True, False}}]FrameStyle (2)
LineBreakChart[{"^GSPC", {{2009, 1, 1}, {2009, 12, 31}}}, Frame -> True, FrameStyle -> Directive[StandardBlue, Thick]]LineBreakChart[{"^GSPC", {{2009, 1, 1}, {2009, 12, 31}}}, Frame -> True, FrameStyle -> {{Directive[Green, Thick], Directive[Red]}, {Directive[Gray, Thick], Directive[Blue]}}]FrameTicks (8)
LineBreakChart[{"^GSPC", {{2009, 1, 1}, {2009, 12, 31}}}, Frame -> True]LineBreakChart[{"^GSPC", {{2009, 1, 1}, {2009, 12, 31}}}, Frame -> True, FrameTicks -> None]LineBreakChart[{"^GSPC", {{2009, 1, 1}, {2009, 12, 31}}}, Frame -> True, FrameTicks -> Automatic]LineBreakChart[{"^GSPC", {{2009, 1, 1}, {2009, 12, 31}}}, Frame -> True, FrameTicks -> {{{700, 1000}, Automatic}, {Automatic, Automatic}}]LineBreakChart[{"^GSPC", {{2009, 1, 1}, {2009, 12, 31}}}, Frame -> True, FrameTicks -> {{{{700, a}, {1000, b}}, Automatic}, {Automatic, Automatic}}]LineBreakChart[{"^GSPC", {{2009, 1, 1}, {2009, 12, 31}}}, Frame -> True, FrameTicks -> {{{{700, a, .1}, {1000, b, .6}}, Automatic}, {Automatic, Automatic}}]LineBreakChart[{"^GSPC", {{2009, 1, 1}, {2009, 12, 31}}}, Frame -> True, FrameTicks -> {{{{700, a, {.1, .1}}, {1000, b, {.6, .2}}}, Automatic}, {Automatic, Automatic}}]LineBreakChart[{"^GSPC", {{2009, 1, 1}, {2009, 12, 31}}}, Frame -> True, FrameTicks -> {{{{700, a, {.1, .1}, Directive[Green, Thick, Dashed]}, {1000, b, {.6, .2}, Directive[Red, Thick, Dashed]}}, Automatic}, {Automatic, Automatic}}]minMeanMax[min_, max_] := {{min, min}, {(max + min) / 2, (max + min) / 2}, {max, max}}LineBreakChart[{"^GSPC", {{2009, 1, 1}, {2009, 12, 31}}}, Frame -> True, FrameTicks -> {{minMeanMax, None}, {Automatic, None}}]FrameTicksStyle (2)
LineBreakChart[{"^GSPC", {{2009, 1, 1}, {2009, 12, 31}}}, Frame -> True, FrameStyle -> Directive[Red]]LineBreakChart[{"^GSPC", {{2009, 1, 1}, {2009, 12, 31}}}, Frame -> True, FrameTicksStyle -> Directive[Blue, Thick]]GridLines (4)
LineBreakChart[{"IBM", {{2009, 10, 1}, {2009, 12, 31}}}]LineBreakChart[{"IBM", {{2009, 10, 1}, {2009, 12, 31}}}, GridLines -> {None, Automatic}]LineBreakChart[{"IBM", {{2009, 10, 1}, {2009, 12, 31}}}, GridLines -> {Automatic, None}]Table[LineBreakChart[{"IBM", {{2009, 10}, {2010, 5}}}, GridLines -> {i, Automatic}], {i, {"Month", "Year"}}]LineBreakChart[{"IBM", {{2009, 10}, {2010, 3}}}, GridLines -> {{{"Year", Directive[Dashing[{}], Red]}, "Month"}, Automatic}]GridLinesStyle (4)
默认情况下,GridLinesStyle 使用点状网格线,并且具有突出显示的年份网格线:
LineBreakChart[{"IBM", {{2009, 10, 1}, {2009, 12, 31}}}]LineBreakChart[{"IBM", {{2009, 8}, {2010, 2}}}]LineBreakChart[{"IBM", {{2009, 10}, {2010, 3}}}, GridLinesStyle -> {Directive[Dotted, Blue], Dotted}]LineBreakChart[{"IBM", {{2009, 10}, {2010, 3}}}, GridLines -> {{{"Month", Blue}}, None}, GridLinesStyle -> Red]ImageSize (7)
使用已命名尺寸,如 Tiny、Small、Medium 和 Large:
{LineBreakChart[{"USO", {{2019, 10, 1}, {2021, 5, 31}}}, ImageSize -> Tiny], LineBreakChart[{"USO", {{2019, 10, 1}, {2021, 5, 31}}}, ImageSize -> Small]}{LineBreakChart[{"USO", {{2019, 10, 1}, {2021, 5, 31}}}, ImageSize -> 150], LineBreakChart[{"USO", {{2019, 10, 1}, {2021, 5, 31}}}, AspectRatio -> 1.5, ImageSize -> 150]}{LineBreakChart[{"USO", {{2019, 10, 1}, {2021, 5, 31}}}, ImageSize -> {Automatic, 150}], LineBreakChart[{"USO", {{2019, 10, 1}, {2021, 5, 31}}}, AspectRatio -> 2, ImageSize -> {Automatic, 150}]}{LineBreakChart[{"USO", {{2019, 10, 1}, {2021, 5, 31}}}, ImageSize -> UpTo[200]], LineBreakChart[{"USO", {{2019, 10, 1}, {2021, 5, 31}}}, AspectRatio -> 1.5, ImageSize -> UpTo[200]]}LineBreakChart[{"USO", {{2019, 10, 1}, {2021, 5, 31}}}, ImageSize -> {200, 250}, Background -> StandardGray]设置 AspectRatioFull 将填充可用空间:
LineBreakChart[{"USO", {{2019, 10, 1}, {2021, 5, 31}}}, AspectRatio -> Full, ImageSize -> {200, 250}, Background -> StandardGray]{LineBreakChart[{"USO", {{2019, 10, 1}, {2021, 5, 31}}}, ImageSize -> {UpTo[150], UpTo[100]}], LineBreakChart[{"USO", {{2019, 10, 1}, {2021, 5, 31}}}, AspectRatio -> 2, ImageSize -> {UpTo[150], UpTo[100]}]}Framed[Pane[LineBreakChart[{"USO", {{2019, 10, 1}, {2021, 5, 31}}}, ImageSize -> Full, Background -> StandardGray], {200, 100}]]Framed[Pane[LineBreakChart[{"USO", {{2019, 10, 1}, {2021, 5, 31}}}, AspectRatio -> Full, ImageSize -> {Scaled[0.5], Scaled[0.5]}, Background -> StandardGray], {200, 200}]]PerformanceGoal (3)
LineBreakChart[{"IBM", {{2009, 10}, {2010, 3}}}, PerformanceGoal -> "Quality"]LineBreakChart[{"IBM", {{2009, 10}, {2010, 3}}}, PerformanceGoal -> "Speed"]Table[ByteCount@LineBreakChart[{"IBM", {{2009, 10}, {2010, 3}}}, PerformanceGoal -> p], {p, {"Quality", "Speed"}}]PlotRange (3)
LineBreakChart 自动绘制所有价格日期:
LineBreakChart[{"JPM", {{2010, 2}, {2010, 5}}}]LineBreakChart[{"JPM", {{2010, 2}, {2010, 5}}}, PlotRange -> {{{2010, 3, 1}, {2010, 4, 15}}, Automatic}]PlotRange 只包含存在数据的日期:
LineBreakChart[{"JPM", {{2010, 2, 1}, {2010, 3, 31}}}, PlotRange -> {{{2010, 2, 1}, {2010, 4, 30}}, Automatic}]PlotTheme (2)
ScalingFunction (2)
Ticks (5)
LineBreakChart[{"^GSPC", {{2009, 1, 1}, {2009, 12, 31}}}]LineBreakChart[{"^GSPC", {{2009, 1, 1}, {2009, 12, 31}}}, Ticks -> None]LineBreakChart[{"^GSPC", {{2009, 1, 1}, {2009, 12, 31}}}, Ticks -> {Automatic, {{700, d}, {1000, e}}}]LineBreakChart[{"^GSPC", {{2009, 1, 1}, {2009, 12, 31}}}, Ticks -> {Automatic, {{700, d, .2}, {1000, e, .6}}}]LineBreakChart[{"^GSPC", {{2009, 1, 1}, {2009, 12, 31}}}, Ticks -> {Automatic, {{700, d, {.2, .2}}, {1000, e, {.6, .3}}}}]LineBreakChart[{"^GSPC", {{2009, 1, 1}, {2009, 12, 31}}}, Ticks -> {Automatic, {{700, d, {.2, .2}, Directive[Thick, Dashed, Red]}, {1000, e, {.6, .3}, Directive[Blue, Thick]}}}]TicksStyle (4)
LineBreakChart[{"^GSPC", {{2009, 1, 1}, {2009, 12, 31}}}, AxesStyle -> Red]LineBreakChart[{"^GSPC", {{2009, 1, 1}, {2009, 12, 31}}}, TicksStyle -> Red]LineBreakChart[{"^GSPC", {{2009, 1, 1}, {2009, 12, 31}}}, TicksStyle -> {Directive[Blue, Thick], Directive[Red, Bold]}]LineBreakChart[{"^GSPC", {{2009, 1, 1}, {2009, 12, 31}}}, TicksStyle -> Directive[StandardBlue, Thick], LabelStyle -> Red]TrendStyle (6)
默认情况下,TrendStyle 对上行趋势使用绿色,对下行趋势使用红色:
LineBreakChart[{"IBM", {{2009, 10}, {2010, 3}}}]LineBreakChart[{"IBM", {{2009, 10}, {2010, 3}}}, TrendStyle -> {Gray, Red}]Table[LineBreakChart[{"IBM", {{2009, 10}, {2010, 3}}}, TrendStyle -> ts, PlotLabel -> ts], {ts, {"BlueYellow", "PurpleGold", "BrownYellow", "Blue", "Gold", "BlackSilver"}}]TrendStyle 与 ChartBaseStyle 合起来使用:
LineBreakChart[{"IBM", {{2009, 10}, {2010, 3}}}, TrendStyle -> {EdgeForm[Green], EdgeForm[Red]}, ChartBaseStyle -> FaceForm[]]当 TrendStyle 设为 None 时,对上行趋势使用基本样式,对下行趋势使用空柱:
LineBreakChart[{"IBM", {{2009, 10}, {2010, 3}}}, TrendStyle -> None]TrendStyle->style 对上行趋势使用 style,对下行趋势使用空柱:
LineBreakChart[{"IBM", {{2009, 10}, {2010, 3}}}, TrendStyle -> Purple]应用 (1)
利用 WeatherData 将芝加哥平均温度可视化为一个 LineBreakChart:
LineBreakChart[WeatherData["Chicago", "MeanTemperature", {{2009, 9, 30}, {2010, 9, 1}, "Day"}]]属性和关系 (5)
Table[LineBreakChart[{"IBM", {{2009, 10}, {2010, 2}}}, n, PlotLabel -> n], {n, {2, 3}}]LineBreakChart 只显示价格上出现明显变化的时间段:
FinancialData["IBM", "Close", {"Jan 1, 2010", "Jan 31, 2010", "Day"}]LineBreakChart[{"IBM", {"Jan 1, 2010", "Jan 31, 2010"}}]利用 InteractiveTradingChart 对金融数据进行可视化处理并且进行交互式分析:
InteractiveTradingChart[{"AAPL", {{2009, 6, 1}, {2010, 6, 1}}}]
| |

| |
利用 PointFigureChart、RenkoChart 和 KagiChart 分析金融价格和时间的关系:
{PointFigureChart["DOW"], RenkoChart["DOW"], KagiChart["DOW"]}利用 DateListPlot 可视化金融数据:
DateListPlot[FinancialData["MSFT", {{2010, 1, 1}, {2010, 6, 1}}]]文本
Wolfram Research (2010),LineBreakChart,Wolfram 语言函数,https://reference.wolfram.com/language/ref/LineBreakChart.html (更新于 2025 年).
CMS
Wolfram 语言. 2010. "LineBreakChart." Wolfram 语言与系统参考资料中心. Wolfram Research. 最新版本 2025. https://reference.wolfram.com/language/ref/LineBreakChart.html.
APA
Wolfram 语言. (2010). LineBreakChart. Wolfram 语言与系统参考资料中心. 追溯自 https://reference.wolfram.com/language/ref/LineBreakChart.html 年