


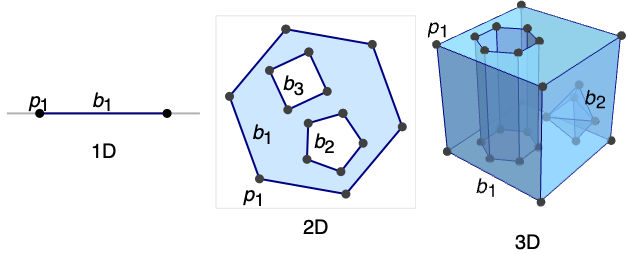
BoundaryMeshRegion
BoundaryMeshRegion[{p1,p2,…},{bcell1[{i1,…}],bcell2[{j1,…}],…}]
yields a mesh with boundary cells bcellj, where coordinates given as integer i are taken to be pi, where the cells together represent a closed curve, surface, etc.
BoundaryMeshRegion[…,{…,wi[bcelli[…]],…}]
yields a mesh with cell properties defined by the symbolic wrapper wi.
BoundaryMeshRegion[…,boundary1,boundary2,…]
yields a mesh from multiple boundaries boundaryi.
Details and Options
- BoundaryMeshRegion is also known as a boundary representation.
- BoundaryMeshRegion can represent a piecewise linear and full-dimensional region embedded in dimension 1, 2, or 3.
- BoundaryMeshRegion[…] displays in a notebook as a plot of a boundary mesh region.
- BoundaryMeshRegion is typically constructed using functions such as ConvexHullMesh, BoundaryMesh, BoundaryDiscretizeRegion, and BoundaryDiscretizeGraphics.
- The boundary cells need to represent a closed curve or surface without self-intersections.
- In BoundaryMeshRegion[{p1,p2,…},b1,b2,…], the boundary curves or surfaces bi should not cross themselves or each other.
- In BoundaryMeshRegion[{p1,p2,…},b1,b2,…], a point p is considered to be in the region enclosed by the boundary curves or surfaces bi if any infinite ray starting at p crosses the set of boundaries bi an odd number of times.
- The following special wrappers wi can be used for boundary faces:
-
Labeled[cell,…] display the cell with labeling Style[cell,…] show the cell with the specified style Annotation[cell,name->value] associate the annotation name->value with cell - Each cell in a BoundaryMeshRegion is given a unique MeshCellIndex of the form {d,i}, where d is the geometric dimension and i is the index.
- For purposes of selecting cells of a BoundaryMeshRegion, the following cell specifications may be used:
-
{d,i} cell with index i of dimension d {d,ispec} cells with index specification ispec of dimension d {dspec,…} cells of dimensions given by dspec h[{i1,…}] explicit cell with head h and vertex indices i1, … {c1,c2,…} list of explicit cells ci - The index specification ispec can have the following form:
-
i cell index i {i1,i2,…} cells with indices ik All all cells patt cells with indices matching the pattern patt - The dimension specification dspec can have the following form:
-
d explicit dimension d All all dimensions from 0 to geometric dimension of region patt dimensions matching the pattern patt - BoundaryMeshRegion contains cells of maximal dimension n-1, where n is the embedding dimension.
- BoundaryMeshRegion is always converted to an optimized representation and treated as raw by functions like AtomQ for purposes of pattern matching.
- BoundaryMeshRegion has the same options as Graphics for embedding dimension two, and the same options as Graphics3D for embedding dimension three, with the following additions and changes:
-
MeshCellLabel Automatic labels and placement for cells MeshCellShapeFunction Automatic shape functions for cells MeshCellStyle Automatic styles for cells MeshCellHighlight {} list of highlighted cells MeshCellMarker 0 integer markers for cells PlotTheme $PlotTheme overall theme for the mesh - Possible settings for PlotTheme include common base themes, font features themes, and size features themes.
- Mesh feature themes affect the plot of mesh cells. Themes include:
-

"Points" 0D cells 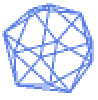
"Lines" 1D cells, wireframe 
"Polygons" 2D cells - Rendering feature themes affect the rendering of meshes. Themes include:
-

"SampledPoints" sampled points from mesh cells 
"SphereAndTube" points as spheres and lines as tubes 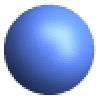
"SmoothShading" smooth shading 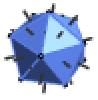
"FaceNormals" normal for each 2D cell 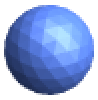
"LargeMesh" optimized for large number of cells - Style and other specifications for cells are effectively applied in the order MeshCellStyle, Style, and other wrappers, with later specifications overriding earlier ones.
- Label style and other specifications for cell labels are effectively applied in the order MeshCellLabel and Labeled, with later specifications overriding earlier ones.
- BoundaryMeshRegion can be used with functions such as RegionMember, RegionDistance, RegionMeasure, and NDSolve.
Examples
open all close allBasic Examples (5)
Specify an interval from its boundary points:
ℛ = BoundaryMeshRegion[{{0}, {1}}, Point[{1, 2}]]{RegionDimension[ℛ], RegionEmbeddingDimension[ℛ]}{BoundedRegionQ[ℛ], RegionBounds[ℛ]}{RegionMeasure[ℛ], RegionCentroid[ℛ]}RegionMember[ℛ, {1 / 2}]Specify a triangle from its closed boundary curve:
ℛ = BoundaryMeshRegion[{{0, 0}, {1, 0}, {0, 1}}, Line[{1, 2, 3, 1}]]{RegionDimension[ℛ], RegionEmbeddingDimension[ℛ]}{BoundedRegionQ[ℛ], RegionBounds[ℛ]}{RegionMeasure[ℛ], RegionCentroid[ℛ]}RegionMember[ℛ, {1 / 3, 1 / 3}]Specify a tetrahedron from its closed boundary surface:
ℛ = BoundaryMeshRegion[{{0, 0, 0}, {1, 0, 0}, {0, 1, 0}, {0, 0, 1}}, Polygon[{{1, 2, 3}, {1, 2, 4}, {2, 3, 4}, {1, 3, 4}}]]{RegionDimension[ℛ], RegionEmbeddingDimension[ℛ]}{BoundedRegionQ[ℛ], RegionBounds[ℛ]}{RegionMeasure[ℛ], RegionCentroid[ℛ]}RegionMember[ℛ, {1 / 4, 1 / 4, 1 / 4}]Specify a 2D region from multiple closed boundary curves:
ℛ = BoundaryMeshRegion[{{0, 0}, {3, 0}, {3, 3}, {0, 3}, {1, 1}, {2, 1}, {2, 2}, {1, 2}}, Line[{1, 2, 3, 4, 1}], Line[{5, 6, 7, 8, 5}]];HighlightMesh[ℛ, Labeled[0, "Index"]]Area[ℛ]Specify a 3D region from multiple closed boundary surfaces:
pts = {{0, 0, 0}, {0, 1, 0}, {1, 1, 0}, {1, 0, 0}, {0, 0, 1}, {0, 1, 1}, {1, 1, 1}, {1, 0, 1}};
pts1 = ScalingTransform[{3, 3, 3}][pts];
pts2 = TranslationTransform[{1, 1, 1}][pts];
hex = {{2, 3, 4, 1}, {1, 4, 8, 5}, {4, 3, 7, 8}, {3, 2, 6, 7}, {2, 1, 5, 6}, {5, 8, 7, 6}};ℛ = BoundaryMeshRegion[Join[pts1, pts2], Polygon[hex], Polygon[hex + 8], MeshCellStyle -> Opacity[0.3]];HighlightMesh[ℛ, Labeled[0, "Index"]]Volume[ℛ]Scope (18)
Regions in 1D (4)
Specify an interval from its boundary points:
ℛ = BoundaryMeshRegion[{{0}, {1}}, Point[{1, 2}]]Label the points with HighlightMesh:
HighlightMesh[ℛ, Labeled[0, "Index"]]{RegionDimension[ℛ], RegionEmbeddingDimension[ℛ]}{BoundedRegionQ[ℛ], RegionBounds[ℛ]}{RegionMeasure[ℛ], RegionCentroid[ℛ]}RegionMember[ℛ, {0}]Specify a 1D region from multiple boundary points:
BoundaryMeshRegion[{{0}, {3}, {6}, {9}}, {Point[{1, 2}], Point[{3, 4}]}]Apply Style to boundary points:
BoundaryMeshRegion[{{0}, {1}}, Style[Point[{1, 2}], Red]]BoundaryMeshRegion[{{0}, {1}}, Labeled[Point[{1, 2}], "Index"]]Regions in 2D (4)
Specify a triangle from its closed boundary curve:
ℛ = BoundaryMeshRegion[{{0, 0}, {3, 0}, {0, 3}}, Line[{1, 2, 3, 1}]]Label the segments with HighlightMesh:
HighlightMesh[ℛ, Labeled[1, "Index"]]{RegionDimension[ℛ], RegionEmbeddingDimension[ℛ]}{BoundedRegionQ[ℛ], RegionBounds[ℛ]}{RegionMeasure[ℛ], RegionCentroid[ℛ]}RegionMember[ℛ, {1, 1}]Specify a 2D region from multiple closed boundary curves:
ℛ = BoundaryMeshRegion[{{0, 0}, {3, 0}, {3, 3}, {0, 3}, {1, 1}, {2, 1}, {2, 2}, {1, 2}}, Line[{1, 2, 3, 4, 1}], Line[{5, 6, 7, 8, 5}]];Label the points with their corresponding indexes with HighlightMesh:
HighlightMesh[ℛ, Labeled[0, "Index"]]Apply Style to specific boundary lines:
BoundaryMeshRegion[{{0, 0}, {3, 0}, {3, 3}, {0, 3}, {1, 1}, {2, 1}, {2, 2}, {1, 2}}, Line[{1, 2, 3, 4, 1}], Style[Line[{5, 6, 7, 8, 5}], Red]]Label specific boundary lines:
BoundaryMeshRegion[{{0, 0}, {3, 0}, {3, 3}, {0, 3}, {1, 1}, {2, 1}, {2, 2}, {1, 2}}, Line[{1, 2, 3, 4, 1}], Labeled[Line[{5, 6, 7, 8, 5}], "Index"]]Regions in 3D (4)
Specify a tetrahedron from its closed boundary surface:
ℛ = BoundaryMeshRegion[{{0, 0, 0}, {4, 0, 0}, {0, 4, 0}, {0, 0, 4}}, Polygon[{{1, 2, 3}, {1, 2, 4}, {2, 3, 4}, {1, 3, 4}}]]Label the segments with HighlightMesh:
HighlightMesh[ℛ, Labeled[1, "Index"]]{RegionDimension[ℛ], RegionEmbeddingDimension[ℛ]}{BoundedRegionQ[ℛ], RegionBounds[ℛ]}{RegionMeasure[ℛ], RegionCentroid[ℛ]}RegionMember[ℛ, {1, 1, 1}]Specify a 3D region from multiple closed boundary surfaces:
pts = {{0, 0, 0}, {0, 1, 0}, {1, 1, 0}, {1, 0, 0}, {0, 0, 1}, {0, 1, 1}, {1, 1, 1}, {1, 0, 1}};
pts1 = ScalingTransform[{3, 3, 3}][pts];
pts2 = TranslationTransform[{1, 1, 1}][pts];
hex = {{2, 3, 4, 1}, {1, 4, 8, 5}, {4, 3, 7, 8}, {3, 2, 6, 7}, {2, 1, 5, 6}, {5, 8, 7, 6}};ℛ = BoundaryMeshRegion[Join[pts1, pts2], Polygon[hex], Polygon[hex + 8], MeshCellStyle -> Opacity[0.3]];HighlightMesh[ℛ, Labeled[0, "Index"]]Apply Style to specific boundary faces:
pts = {{1, -1, -3}, {1, -1, 1}, {1, 3, 1}, {-3, -1, 1}};
i = {{1, 2, 3}, {1, 2, 4}, {2, 3, 4}, {1, 3, 4}};BoundaryMeshRegion[Join[pts, pts / 2], Polygon[i + 4], Style[Polygon[i], Opacity[0.5, Red]]]Label specific boundary faces:
pts = {{1, -1, -3}, {1, -1, 1}, {1, 3, 1}, {-3, -1, 1}};
i = {{1, 2, 3}, {1, 2, 4}, {2, 3, 4}, {1, 3, 4}};BoundaryMeshRegion[Join[pts, pts / 2], Polygon[i + 4], Labeled[Polygon[i], "Index"]]Presentation (6)
BoundaryMeshRegion[[image], PlotTheme -> "Points"]Use a theme to draw 1D cells or a wireframe:
BoundaryMeshRegion[[image], PlotTheme -> "Lines"]BoundaryMeshRegion[[image], PlotTheme -> "Polygons"]Use a theme to draw sampled points from mesh cells:
BoundaryMeshRegion[[image], PlotTheme -> "SampledPoints"]Use a theme to smooth the shading:
BoundaryMeshRegion[[image], PlotTheme -> "SmoothShading"]Use a theme to draw normals for each 2D cell:
BoundaryMeshRegion[[image], PlotTheme -> "FaceNormals"]Options (127)
AlignmentPoint (1)
Specify the position to be aligned in 3D Inset, using ![]() coordinates:
coordinates:
Table[Graphics[{Inset[BoundaryMeshRegion[{{0, 0}, {1, 0}, {0, 1}}, Line[{1, 2, 3, 1}], ImageSize -> 50, AlignmentPoint -> {a, 0}], {0, 0}]}, ImageSize -> 100, Axes -> True, Ticks -> None], {a, {0, 1 / 2, 1}}]Table[Graphics[{Inset[BoundaryMeshRegion[{{0, 0}, {1, 0}, {0, 1}}, Line[{1, 2, 3, 1}], ImageSize -> 50, AlignmentPoint -> {1 / 2, a}], {0, 0}]}, ImageSize -> 100, Axes -> True, Ticks -> None], {a, {0, 1 / 2, 1}}]AspectRatio (1)
Use numerical values for AspectRatio:
Table[BoundaryMeshRegion[{{0, 0}, {2, 0}, {1, Sqrt[3]}}, Line[{1, 2, 3, 1}], AspectRatio -> 1 / k], {k, 1, 3}]Axes (2)
AxesEdge (2)
Choose the bounding box edges automatically to draw the axes:
BoundaryMeshRegion[{{0, 0, 0}, {2, 0, 0}, {2, 2, 0}, {0, 2, 0}, {1, 1, 2}}, Polygon[{{1, 2, 5}, {1, 5, 4}, {2, 3, 5}, {3, 4, 5}, {1, 4, 3, 2}}], Boxed -> True, Axes -> True, AxesEdge -> Automatic]Choose the bounding box edges automatically to draw the axes:
BoundaryMeshRegion[{{0, 0, 0}, {2, 0, 0}, {2, 2, 0}, {0, 2, 0}, {1, 1, 2}}, Polygon[{{1, 2, 5}, {1, 5, 4}, {2, 3, 5}, {3, 4, 5}, {1, 4, 3, 2}}], Boxed -> True, Axes -> True, AxesEdge -> {{1, 1}, None, None}]AxesLabel (2)
AxesOrigin (2)
Determine where the axes cross automatically:
BoundaryMeshRegion[{{0, 0}, {2, 0}, {1, Sqrt[3]}}, Line[{1, 2, 3, 1}], Axes -> True, AxesOrigin -> Automatic]Specify the axes' origin explicitly:
BoundaryMeshRegion[{{0, 0}, {2, 0}, {1, Sqrt[3]}}, Line[{1, 2, 3, 1}], Axes -> True, AxesOrigin -> {0, 1}]AxesStyle (2)
Specify the overall axes style, including the ticks and the tick labels:
BoundaryMeshRegion[{{0, 0}, {2, 0}, {1, Sqrt[3]}}, Line[{1, 2, 3, 1}], Axes -> True, AxesStyle -> Directive[Orange, 12]]Specify the style of each axis:
BoundaryMeshRegion[{{0, 0}, {2, 0}, {1, Sqrt[3]}}, Line[{1, 2, 3, 1}], Axes -> True, AxesStyle -> {Directive[Dashed, Red], Blue}]Background (1)
BaselinePosition (3)
Align the center of a graphic with the baseline of the text:
{x, BoundaryMeshRegion[{{0, 0}, {2, 0}, {1, Sqrt[3]}}, Line[{1, 2, 3, 1}], ImageSize -> 50, BaselinePosition -> Center], y}Specify the baseline of a graphic as a fraction of the height by using Scaled:
Table[{x, BoundaryMeshRegion[{{0, 0}, {2, 0}, {1, Sqrt[3]}}, Line[{1, 2, 3, 1}], ImageSize -> 50, BaselinePosition -> Scaled[b]]}, {b, {0, 0.5, 1}}]Use the axis of a graphic as the baseline:
{x, BoundaryMeshRegion[{{0, 0}, {2, 0}, {1, Sqrt[3]}}, Line[{1, 2, 3, 1}], ImageSize -> 50, BaselinePosition -> Axis], y}BaseStyle (2)
BoundaryMeshRegion[{{0, 0}, {2, 0}, {1, Sqrt[3]}}, Line[{1, 2, 3, 1}], BaseStyle -> Blue]BoundaryMeshRegion[{{0, 0}, {2, 0}, {1, Sqrt[3]}}, Line[{1, 2, 3, 1}], BaseStyle -> {Green, Thick, EdgeForm[Dashed]}]Boxed (2)
Draw the edges of the bounding box:
BoundaryMeshRegion[{{0, 0, 0}, {2, 0, 0}, {2, 2, 0}, {0, 2, 0}, {1, 1, 2}}, Polygon[{{1, 2, 5}, {1, 5, 4}, {2, 3, 5}, {3, 4, 5}, {1, 4, 3, 2}}], Boxed -> True]Do not draw the edges of the bounding box:
BoundaryMeshRegion[{{0, 0, 0}, {2, 0, 0}, {2, 2, 0}, {0, 2, 0}, {1, 1, 2}}, Polygon[{{1, 2, 5}, {1, 5, 4}, {2, 3, 5}, {3, 4, 5}, {1, 4, 3, 2}}], Boxed -> False]BoxRatios (2)
Specify the ratios between the bounding box edges:
BoundaryMeshRegion[{{0, 0, 0}, {2, 0, 0}, {2, 2, 0}, {0, 2, 0}, {1, 1, 2}}, Polygon[{{1, 2, 5}, {1, 5, 4}, {2, 3, 5}, {3, 4, 5}, {1, 4, 3, 2}}], Boxed -> True, BoxRatios -> {1, 2, 3}]Use the actual coordinate values for the ratios:
BoundaryMeshRegion[{{0, 0, 0}, {2, 0, 0}, {2, 2, 0}, {0, 2, 0}, {1, 1, 2}}, Polygon[{{1, 2, 5}, {1, 5, 4}, {2, 3, 5}, {3, 4, 5}, {1, 4, 3, 2}}], Boxed -> True, Axes -> True, BoxRatios -> Automatic]BoxStyle (1)
Epilog (1)
FaceGrids (4)
Put grids on every face of a 3D graphic:
MeshRegion[{{0, 0, 0}, {2, 0, 0}, {2, 2, 0}, {0, 2, 0}, {1, 1, 2}}, Pyramid[{1, 2, 3, 4, 5}], Axes -> True, Boxed -> True, FaceGrids -> All]BoundaryMeshRegion[{{0, 0, 0}, {2, 0, 0}, {2, 2, 0}, {0, 2, 0}, {1, 1, 2}}, Polygon[{{1, 2, 5}, {1, 5, 4}, {2, 3, 5}, {3, 4, 5}, {1, 4, 3, 2}}], Axes -> True, Boxed -> True, FaceGrids -> {{0, 0, 1}, {0, 0, -1}}]BoundaryMeshRegion[{{0, 0, 0}, {2, 0, 0}, {2, 2, 0}, {0, 2, 0}, {1, 1, 2}}, Polygon[{{1, 2, 5}, {1, 5, 4}, {2, 3, 5}, {3, 4, 5}, {1, 4, 3, 2}}], Axes -> True, Boxed -> True, FaceGrids -> {{0, -1, 0}}]On the ![]() plane, put grid lines on
plane, put grid lines on ![]() ,
, ![]() , and
, and ![]() :
:
BoundaryMeshRegion[{{0, 0, 0}, {2, 0, 0}, {2, 2, 0}, {0, 2, 0}, {1, 1, 2}}, Polygon[{{1, 2, 5}, {1, 5, 4}, {2, 3, 5}, {3, 4, 5}, {1, 4, 3, 2}}], Axes -> True, Boxed -> True, FaceGrids -> {{{0, -1, 0}, {{1}, {2 / 3, 4 / 3}}}}]FaceGridsStyle (1)
Frame (2)
Draw a frame around the whole graphic:
BoundaryMeshRegion[{{0, 0}, {2, 0}, {1, Sqrt[3]}}, Line[{1, 2, 3, 1}], Frame -> True]Draw a frame on the left and the right edges:
BoundaryMeshRegion[{{0, 0}, {2, 0}, {1, Sqrt[3]}}, Line[{1, 2, 3, 1}], Frame -> {{True, True}, {False, False}}]FrameLabel (2)
Specify frame labels for the bottom and the left edges:
BoundaryMeshRegion[{{0, 0}, {2, 0}, {1, Sqrt[3]}}, Line[{1, 2, 3, 1}], Frame -> True, FrameLabel -> {x, y}]BoundaryMeshRegion[{{0, 0}, {2, 0}, {1, Sqrt[3]}}, Line[{1, 2, 3, 1}], Frame -> True, FrameLabel -> {{a, b}, {c, d}}]FrameStyle (2)
Specify the overall frame style:
BoundaryMeshRegion[{{0, 0}, {2, 0}, {1, Sqrt[3]}}, Line[{1, 2, 3, 1}], Frame -> True, FrameStyle -> Directive[Thick, Gray]]Specify the style of each frame edge:
BoundaryMeshRegion[{{0, 0}, {2, 0}, {1, Sqrt[3]}}, Line[{1, 2, 3, 1}], Frame -> True, FrameStyle -> {{Thick, Directive[Thick, Dashed]}, {Blue, Red}}]FrameTicks (3)
BoundaryMeshRegion[{{0, 0}, {2, 0}, {1, Sqrt[3]}}, Line[{1, 2, 3, 1}], Frame -> True, FrameTicks -> None]Tick mark labels on the bottom and the left frame edges:
BoundaryMeshRegion[{{0, 0}, {2, 0}, {1, Sqrt[3]}}, Line[{1, 2, 3, 1}], Frame -> True, FrameTicks -> Automatic]Frame ticks on the bottom and the right edges:
BoundaryMeshRegion[{{0, 0}, {2, 0}, {1, Sqrt[3]}}, Line[{1, 2, 3, 1}], Frame -> True, FrameTicks -> {{None, Automatic}, {Automatic, None}}]FrameTicksStyle (2)
Specify frame tick and frame tick label style:
BoundaryMeshRegion[{{0, 0}, {2, 0}, {1, Sqrt[3]}}, Line[{1, 2, 3, 1}], Frame -> True, FrameTicksStyle -> Directive[Orange, 12]]Specify frame tick style for each edge:
BoundaryMeshRegion[{{0, 0}, {2, 0}, {1, Sqrt[3]}}, Line[{1, 2, 3, 1}], Frame -> True, FrameTicksStyle -> {{Magenta, Blue}, {Red, Green}}]GridLines (3)
Put grids across a 2D graphic:
BoundaryMeshRegion[{{0, 0}, {2, 0}, {1, Sqrt[3]}}, Line[{1, 2, 3, 1}], GridLines -> Automatic]Draw grid lines at specific positions:
BoundaryMeshRegion[{{0, 0}, {2, 0}, {1, Sqrt[3]}}, Line[{1, 2, 3, 1}], Axes -> True, GridLines -> {{.5, 1.5}, {.5, 1.5}}]Specify the style of each grid:
BoundaryMeshRegion[{{-1, 0}, {1, 0}, {0, Sqrt[3]}}, Line[{1, 2, 3, 1}], Axes -> True, GridLines -> {{{-1, Orange}, {-.5, Dotted}, {.5, Dotted}, {1, Orange}}, {0, {.5, Dotted}, {1.5, Dotted}, 2}}]GridLinesStyle (1)
ImageMargins (3)
Allow no margins outside of ImageSize:
Framed[BoundaryMeshRegion[{{0, 0}, {2, 0}, {1, Sqrt[3]}}, Line[{1, 2, 3, 1}]]]Have 20-point margins on all sides:
Framed[BoundaryMeshRegion[{{0, 0}, {2, 0}, {1, Sqrt[3]}}, Line[{1, 2, 3, 1}], ImageMargins -> 20]]Draw grid lines at specific positions:
Framed[BoundaryMeshRegion[{{0, 0}, {2, 0}, {1, Sqrt[3]}}, Line[{1, 2, 3, 1}], ImageMargins -> {{5, 10}, {20, 30}}]]ImagePadding (4)
Leave no padding outside of the plot range:
BoundaryMeshRegion[{{0, 0}, {2, 0}, {1, Sqrt[3]}}, Line[{1, 2, 3, 1}], ImagePadding -> None, Frame -> True, FrameLabel -> {x, y}]Leave enough padding for all objects and labels that are present:
Framed[BoundaryMeshRegion[{{0, 0}, {2, 0}, {1, Sqrt[3]}}, Line[{1, 2, 3, 1}], ImagePadding -> All, Frame -> True, FrameLabel -> {x, y}], FrameMargins -> 0]Specify the same padding for all sides in printer's points:
Framed[BoundaryMeshRegion[{{0, 0}, {2, 0}, {1, Sqrt[3]}}, Line[{1, 2, 3, 1}], ImagePadding -> 40, Frame -> True]]Specify the same padding for all sides in printer's points:
Framed[BoundaryMeshRegion[{{0, 0}, {2, 0}, {1, Sqrt[3]}}, Line[{1, 2, 3, 1}], ImagePadding -> {{40, 10}, {20, 5}}, Frame -> True]]ImageSize (3)
Use predefined symbolic sizes:
Table[BoundaryMeshRegion[{{0, 0}, {2, 0}, {1, Sqrt[3]}}, Line[{1, 2, 3, 1}], ImageSize -> s], {s, {Tiny, Small}}]{BoundaryMeshRegion[{{0, 0}, {2, 0}, {1, Sqrt[3]}}, Line[{1, 2, 3, 1}], ImageSize -> 100], BoundaryMeshRegion[{{0, 0}, {2, 0}, {1, 3}}, Line[{1, 2, 3, 1}], ImageSize -> 100]}Use an explicit image width and height:
{BoundaryMeshRegion[{{0, 0}, {2, 0}, {1, Sqrt[3]}}, Line[{1, 2, 3, 1}], ImageSize -> {100, 100}], BoundaryMeshRegion[{{0, 0}, {2, 0}, {1, 3}}, Line[{1, 2, 3, 1}], ImageSize -> {100, 100}]}LabelStyle (1)
Lighting (4)
Ambient light is uniformly applied to all the surfaces in the scene:
BoundaryMeshRegion[{{0, 0, 0}, {2, 0, 0}, {2, 2, 0}, {0, 2, 0}, {1, 1, 2}}, Polygon[{{1, 2, 5}, {1, 5, 4}, {2, 3, 5}, {3, 4, 5}, {1, 4, 3, 2}}], Lighting -> {{"Ambient", Orange}}]Directional lights with different colors:
Table[BoundaryMeshRegion[{{0, 0, 0}, {2, 0, 0}, {2, 2, 0}, {0, 2, 0}, {1, 1, 2}}, Polygon[{{1, 2, 5}, {1, 5, 4}, {2, 3, 5}, {3, 4, 5}, {1, 4, 3, 2}}], Lighting -> {{"Directional", c, {{1.5, 0, 2}, {0, 0, 0}}}}], {c, {Red, Yellow, Blue}}]Point lights with different colors:
Table[BoundaryMeshRegion[{{0, 0, 0}, {2, 0, 0}, {2, 2, 0}, {0, 2, 0}, {1, 1, 2}}, Polygon[{{1, 2, 5}, {1, 5, 4}, {2, 3, 5}, {3, 4, 5}, {1, 4, 3, 2}}], Lighting -> {{"Point", c, {1.5, 0, 3}}}], {c, {Red, Yellow, Blue}}]Spotlights with different colors:
Table[BoundaryMeshRegion[{{0, 0, 0}, {2, 0, 0}, {2, 2, 0}, {0, 2, 0}, {1, 1, 2}}, Polygon[{{1, 2, 5}, {1, 5, 4}, {2, 3, 5}, {3, 4, 5}, {1, 4, 3, 2}}], Lighting -> {{"Spot", c, {{1, 1, 2.5}, {1, 1, 2}}, Pi / 8}}], {c, {Red, Yellow, Blue}}]MeshCellHighlight (3)
MeshCellHighlight allows you to specify highlighting for parts of a BoundaryMeshRegion:
BoundaryMeshRegion[{{0, 0}, {1, 0}, {0, 1}}, Line[{1, 2, 3, 1}], MeshCellHighlight -> {{1, All} -> Red, {0, All} -> Green}]By making faces transparent, the internal structure of a 3D BoundaryMeshRegion can be seen:
BoundaryMeshRegion[{{0, 0, 0}, {1, 0, 0}, {0, 1, 0}, {0, 0, 1}}, Polygon[{{1, 2, 3}, {1, 2, 4}, {2, 3, 4}, {1, 3, 4}}], MeshCellHighlight -> {{2, All} -> Opacity[0.5, Orange]}]Individual cells can be highlighted using their cell index:
BoundaryMeshRegion[{{0, 0}, {1, 0}, {0, 1}}, Line[{1, 2, 3, 1}], MeshCellHighlight -> {{1, 1} -> {Thick, Red}, {1, 2} -> {Dashed, Green}}]MeshRegion[{{0}, {1}, {2}}, Line[{{1, 2, 3}}], MeshCellHighlight -> {{1, 1} -> {Thick, Red}, {1, 2} -> {Dashed, Green}}]BoundaryMeshRegion[{{0, 0}, {1, 0}, {0, 1}}, Line[{1, 2, 3, 1}], MeshCellHighlight -> {Line[{1, 2}] -> {Thick, Red}, Line[{2, 3}] -> {Dashed, Green}}]MeshCellLabel (11)
MeshCellLabel can be used to label parts of a BoundaryMeshRegion:
BoundaryMeshRegion[{{0, 0}, {3, 0}, {3, 3}, {0, 3}, {1, 1}, {2, 1}, {2, 2}, {1, 2}}, Line[{1, 2, 3, 4, 1}], Line[{5, 6, 7, 8, 5}], MeshCellLabel -> {1 -> "Index"}]MeshCellLabel can reveal a cell's index with "Index", "CellIndex", or "Cell":
Table[BoundaryMeshRegion[{{0, 0}, {1, 0}, {0, 1}}, Line[{1, 2, 3, 1}], MeshCellLabel -> {{{0, 3}, {1, 2}} -> cl}], {cl, {"Index", "CellIndex", "Cell"}}]Any expression can be used as a label:
BoundaryMeshRegion[{{0, 0}, {6, 0}, {3, 3}, {3, 6}, {0, 3}}, Line[{1, 2, 3, 4, 5, 1}], MeshCellLabel -> {0 -> "Index", {{1, 1}} -> [image], {{1, 2}} -> Sqrt[a^2 + b^2], {1, 3} -> "North", {1, 4} -> [image], {1, 5} -> [image]}]Label all cells with tooltips:
BoundaryMeshRegion[{{0, 0}, {1, 0}, {0, 1}}, Line[{1, 2, 3, 1}], MeshCellLabel -> {All -> Placed["Cell", Tooltip]}]All can be used to specify all cells:
BoundaryMeshRegion[{{0, 0}, {1, 0}, {0, 1}}, Line[{1, 2, 3, 1}], MeshCellLabel -> {All -> "x"}]By default, all cells are labeled:
BoundaryMeshRegion[{{0, 0}, {1, 0}, {0, 1}}, Line[{1, 2, 3, 1}], MeshCellLabel -> "x"]Label all cells of a given dimension:
BoundaryMeshRegion[{{0, 0}, {1, 0}, {0, 1}}, Line[{1, 2, 3, 1}], MeshCellLabel -> {0 -> "point", 1 -> "line"}]Label specific vertices and edges of a polygon:
BoundaryMeshRegion[{{0, 0}, {1, 0}, {0, 1}}, Line[{1, 2, 3, 1}], MeshCellLabel -> {{0, {1, 2}} -> "Index", {1, 1} -> "Cell"}]Alternatively, you can specify a head and indices:
BoundaryMeshRegion[{{0, 0}, {1, 0}, {0, 1}}, Line[{1, 2, 3, 1}], MeshCellLabel -> {Point[{1, 2}] -> "Index", Line[{1, 2}] -> "Cell"}]Specify a list of cell indices to label:
BoundaryMeshRegion[{{0, 0}, {1, 0}, {0, 1}}, Line[{1, 2, 3, 1}], MeshCellLabel -> {{{0, 1}, {1, 2}} -> "Cell"}]Label cells whose dimensions match a pattern:
BoundaryMeshRegion[{{0, 0, 0}, {1, 0, 0}, {0, 1, 0}, {0, 0, 1}}, Polygon[{{1, 2, 3}, {1, 2, 4}, {2, 3, 4}, {1, 3, 4}}], MeshCellLabel -> {{0 | 2} -> "CellIndex"}]Label cells whose indices match a pattern:
BoundaryMeshRegion[{{0, 0}, {3, 0}, {3, 3}, {0, 3}, {1, 1}, {2, 1}, {2, 2}, {1, 2}}, Line[{1, 2, 3, 4, 1}], Line[{5, 6, 7, 8, 5}], MeshCellLabel -> {{1, _ ? EvenQ} -> "Index"}]Wrappers have precedence over options:
BoundaryMeshRegion[{{0, 0}, {3, 0}, {3, 3}, {0, 3}, {1, 1}, {2, 1}, {2, 2}, {1, 2}}, Labeled[Line[{1, 2, 3, 4, 1}], "x"], Line[{5, 6, 7, 8, 5}], MeshCellLabel -> {1 -> "Index"}]MeshCellMarker (1)
MeshCellMarker can be used to assign values to parts of a BoundaryMeshRegion:
BoundaryMeshRegion[{{0, 0}, {1, 0}, {0, 1}}, Line[{1, 2, 3, 1}], MeshCellMarker -> {{1, 1} -> 1, {1, 2} -> 2, {1, 3} -> 3}]Use MeshCellLabel to show the markers:
BoundaryMeshRegion[{{0, 0}, {1, 0}, {0, 1}}, Line[{1, 2, 3, 1}], MeshCellLabel -> {1 -> "Marker"}, MeshCellMarker -> {{1, 1} -> 1, {1, 2} -> 2, {1, 3} -> 3}]MeshCellShapeFunction (2)
MeshCellShapeFunction allows you to specify functions for parts of a BoundaryMeshRegion:
BoundaryMeshRegion[{{0, 0}, {1, 0}, {0, 1}}, Line[{1, 2, 3, 1}], MeshCellShapeFunction -> {1 -> (Arrow[#]&), 0 -> (Disk[#, .05]&)}]Individual cells can be drawn using their cell index:
BoundaryMeshRegion[{{0, 0}, {1, 0}, {0, 1}}, Line[{1, 2, 3, 1}], MeshCellShapeFunction -> {{0, 1} -> (Disk[#, .1]&), {0, 2} -> (Disk[#, {.1, .05}]&)}]BoundaryMeshRegion[{{0, 0}, {1, 0}, {0, 1}}, Line[{1, 2, 3, 1}], MeshCellShapeFunction -> {Point[1] -> (Disk[#, .1]&), Point[2] -> (Disk[#, {.1, .05}]&)}]MeshCellStyle (8)
All can be used to specify all cells:
BoundaryMeshRegion[{{0, 0}, {1, 0}, {0, 1}}, Line[{1, 2, 3, 1}], MeshCellStyle -> {All -> Red}]By default, all cells are styled:
BoundaryMeshRegion[{{0, 0}, {1, 0}, {0, 1}}, Line[{1, 2, 3, 1}], MeshCellStyle -> Red]Style all cells of a given dimension:
BoundaryMeshRegion[{{0, 0}, {1, 0}, {0, 1}}, Line[{1, 2, 3, 1}], MeshCellStyle -> {0 -> {PointSize[Large], Green}, 1 -> Red}]Style specific vertices and edges of a polygon:
BoundaryMeshRegion[{{0, 0}, {1, 0}, {0, 1}}, Line[{1, 2, 3, 1}], MeshCellStyle -> {{0, {1, 2}} -> Directive[PointSize[Large], Green], {1, 1} -> Red}]Alternatively, you can specify a head and indices:
BoundaryMeshRegion[{{0, 0}, {1, 0}, {0, 1}}, Line[{1, 2, 3, 1}], MeshCellStyle -> {Point[{1, 2}] -> Directive[PointSize[Large], Green], Line[{1, 2}] -> Red}]Specify a list of cell indices to style:
BoundaryMeshRegion[{{0, 0}, {1, 0}, {0, 1}}, Line[{1, 2, 3, 1}], MeshCellStyle -> {{{0, 1}, {1, 2}} -> Red}]Style cells whose dimensions match a pattern:
BoundaryMeshRegion[{{0, 0, 0}, {1, 0, 0}, {0, 1, 0}, {0, 0, 1}}, Polygon[{{1, 2, 3}, {1, 2, 4}, {2, 3, 4}, {1, 3, 4}}], MeshCellStyle -> {{0 | 1} -> Red}]Style cells whose indices match a pattern:
BoundaryMeshRegion[{{0, 0}, {3, 0}, {3, 3}, {0, 3}, {1, 1}, {2, 1}, {2, 2}, {1, 2}}, Line[{1, 2, 3, 4, 1}], Line[{5, 6, 7, 8, 5}], MeshCellStyle -> {{1, _ ? EvenQ} -> Red}]Style with graphics directives appropriate for the dimension of the components:
ℛ = BoundaryMeshRegion[{{0, 0, 0}, {4, 0, 0}, {0, 4, 0}, {0, 0, 4}}, Polygon[{{1, 2, 3}, {1, 2, 4}, {2, 3, 4}, {1, 3, 4}}], MeshCellStyle -> {0 -> {PointSize[Large], Green}, 1 -> {Dashed, Thick, Red}, 2 -> Opacity[0.7, Brown]}]Wrappers have precedence over options:
BoundaryMeshRegion[{{0, 0}, {3, 0}, {3, 3}, {0, 3}, {1, 1}, {2, 1}, {2, 2}, {1, 2}}, Style[Line[{1, 2, 3, 4, 1}], Green], Line[{5, 6, 7, 8, 5}], MeshCellStyle -> {1 -> Red}]PlotLabel (2)
Display a label on the top of the graphic in TraditionalForm:
BoundaryMeshRegion[{{0, 0}, {2, 0}, {1, Sqrt[3]}}, Line[{1, 2, 3, 1}], PlotLabel -> x ^ 2 + y ^ 2 == 1]Use Style and other typesetting functions to modify how the label appears:
BoundaryMeshRegion[{{0, 0}, {2, 0}, {1, Sqrt[3]}}, Line[{1, 2, 3, 1}], PlotLabel -> Style[Framed[x ^ 2 + y ^ 2 == 1], 16, Red, Background -> Yellow]]PlotRange (3)
BoundaryMeshRegion[{{0, 0}, {2, 0}, {1, Sqrt[3]}}, Line[{1, 2, 3, 1}], Frame -> True, PlotRange -> All]BoundaryMeshRegion[{{0, 0}, {2, 0}, {1, Sqrt[3]}}, Line[{1, 2, 3, 1}], PlotRange -> {{0, 2}, {0, 1}}, Frame -> True]Force clipping at the PlotRange:
BoundaryMeshRegion[{{0, 0}, {2, 0}, {1, Sqrt[3]}}, Line[{1, 2, 3, 1}], PlotRange -> {{0, 2}, {0, 1}}, PlotRangeClipping -> True, Frame -> True]PlotRange->s is equivalent to PlotRange->{{-s, s}, {-s, s}}:
BoundaryMeshRegion[{{-2, -2}, {2, -2}, {0, Sqrt[3]}}, Line[{1, 2, 3, 1}], Frame -> True, PlotRange -> 1]PlotRangeClipping (2)
Allow graphics objects to spread beyond PlotRange:
BoundaryMeshRegion[{{-2, -2}, {2, -2}, {0, Sqrt[3]}}, Line[{1, 2, 3, 1}], Frame -> True, PlotRange -> 1, PlotRangeClipping -> False]Clip all graphics objects at PlotRange:
BoundaryMeshRegion[{{-2, -2}, {2, -2}, {0, Sqrt[3]}}, Line[{1, 2, 3, 1}], Frame -> True, PlotRange -> 1, PlotRangeClipping -> True]PlotRangePadding (3)
Include ![]() coordinate unit of padding on all sides:
coordinate unit of padding on all sides:
BoundaryMeshRegion[{{0, 0}, {2, 0}, {1, Sqrt[3]}}, Line[{1, 2, 3, 1}], PlotRangePadding -> 1, Frame -> True]Include padding using Scaled coordinates:
BoundaryMeshRegion[{{0, 0}, {2, 0}, {1, Sqrt[3]}}, Line[{1, 2, 3, 1}], PlotRangePadding -> Scaled[0.1], Frame -> True]Specify different padding on each side:
BoundaryMeshRegion[{{0, 0}, {2, 0}, {1, Sqrt[3]}}, Line[{1, 2, 3, 1}], PlotRangePadding -> {{0.5, 1}, {0.3, 0.3}}, Frame -> True]PlotRegion (3)
The contents of a graphic use the whole region:
BoundaryMeshRegion[{{0, 0}, {2, 0}, {1, Sqrt[3]}}, Line[{1, 2, 3, 1}], Frame -> True, FrameTicks -> False, Background -> LightBlue]Limit the contents of the graphic to the middle half of the region in each direction:
BoundaryMeshRegion[{{0, 0}, {2, 0}, {1, Sqrt[3]}}, Line[{1, 2, 3, 1}], Frame -> True, FrameTicks -> False, PlotRegion -> {{0.25, 0.75}, {0.25, 0.75}}, Background -> LightBlue]ImagePadding can also be used to add padding around a graphic:
BoundaryMeshRegion[{{0, 0}, {2, 0}, {1, Sqrt[3]}}, Line[{1, 2, 3, 1}], Frame -> True, FrameTicks -> False, ImagePadding -> 30, Background -> LightBlue]PlotTheme (9)
Base Themes (2)
BoundaryMeshRegion[{{1, -1, -3}, {1, -1, 1}, {1, 3, 1}, {-3, -1, 1}}, Polygon[{{1, 2, 3}, {1, 2, 4}, {2, 3, 4}, {1, 3, 4}}], PlotTheme -> "Detailed"]BoundaryMeshRegion[{{1, -1, -3}, {1, -1, 1}, {1, 3, 1}, {-3, -1, 1}}, Polygon[{{1, 2, 3}, {1, 2, 4}, {2, 3, 4}, {1, 3, 4}}], PlotTheme -> "Monochrome"]Feature Themes (7)
BoundaryMeshRegion[{{1, -1, -3}, {1, -1, 1}, {1, 3, 1}, {-3, -1, 1}}, Polygon[{{1, 2, 3}, {1, 2, 4}, {2, 3, 4}, {1, 3, 4}}], PlotTheme -> "Points"]Use a theme to draw 1D cells or a wireframe:
BoundaryMeshRegion[{{1, -1, -3}, {1, -1, 1}, {1, 3, 1}, {-3, -1, 1}}, Polygon[{{1, 2, 3}, {1, 2, 4}, {2, 3, 4}, {1, 3, 4}}], PlotTheme -> "Lines"]BoundaryMeshRegion[{{1, -1, -3}, {1, -1, 1}, {1, 3, 1}, {-3, -1, 1}}, Polygon[{{1, 2, 3}, {1, 2, 4}, {2, 3, 4}, {1, 3, 4}}], PlotTheme -> "Polygons"]Use a theme to draw sampled points from mesh cells:
BoundaryMeshRegion[{{1, -1, -3}, {1, -1, 1}, {1, 3, 1}, {-3, -1, 1}}, Polygon[{{1, 2, 3}, {1, 2, 4}, {2, 3, 4}, {1, 3, 4}}], PlotTheme -> "SampledPoints"]Use a theme to draw points as spheres and lines as tubes:
BoundaryMeshRegion[{{1, -1, -3}, {1, -1, 1}, {1, 3, 1}, {-3, -1, 1}}, Polygon[{{1, 2, 3}, {1, 2, 4}, {2, 3, 4}, {1, 3, 4}}], PlotTheme -> "SphereAndTube"]Use a theme to smooth shading:
BoundaryMeshRegion[{{1, -1, -3}, {1, -1, 1}, {1, 3, 1}, {-3, -1, 1}}, Polygon[{{1, 2, 3}, {1, 2, 4}, {2, 3, 4}, {1, 3, 4}}], PlotTheme -> "SmoothShading"]Use a theme to draw normals for each 2D cell:
BoundaryMeshRegion[{{1, -1, -3}, {1, -1, 1}, {1, 3, 1}, {-3, -1, 1}}, Polygon[{{1, 2, 3}, {1, 2, 4}, {2, 3, 4}, {1, 3, 4}}], PlotTheme -> "FaceNormals"]Prolog (1)
Define a simple graphic to use as a background:
bg = Graphics[Polygon[{{0, 0}, {1, 0}, {1, 1}, {0, 1}}, VertexColors -> {Orange, Orange, White, White}], AspectRatio -> Full];Use it in multiple boundary mesh regions:
BoundaryMeshRegion[{{0, 0}, {2, 0}, {1, Sqrt[3]}}, Line[{1, 2, 3, 1}], Prolog -> Inset[bg, Scaled[{0, 0}], Scaled[{0, 0}]]]BoundaryMeshRegion[{{0, 0}, {3, 0}, {0, 3}}, Line[{1, 2, 3, 1}], Prolog -> Inset[bg, Scaled[{0, 0}], Scaled[{0, 0}]]]RotateLabel (2)
Specify that vertical frame labels should be rotated:
BoundaryMeshRegion[{{0, 0}, {2, 0}, {1, Sqrt[3]}}, Line[{1, 2, 3, 1}], Frame -> True, FrameLabel -> {None, "y axis"}, RotateLabel -> True]Specify that vertical frame labels should not be rotated:
BoundaryMeshRegion[{{0, 0}, {2, 0}, {1, Sqrt[3]}}, Line[{1, 2, 3, 1}], Frame -> True, FrameLabel -> {None, "y axis"}, RotateLabel -> False]SphericalRegion (2)
Make a sequence of images be consistently sized, independent of orientation:
Table[BoundaryMeshRegion[{{0, 0, 0}, {2, 0, 0}, {2, 2, 0}, {0, 2, 0}, {1, 1, 2}}, Polygon[{{1, 2, 5}, {1, 5, 4}, {2, 3, 5}, {3, 4, 5}, {1, 4, 3, 2}}], SphericalRegion -> True, ImageSize -> 80, ViewPoint -> 3.{ Sin[t], Cos[t], 1}], {t, 0, 4}]Without SphericalRegion, each image is made as big as possible:
Table[BoundaryMeshRegion[{{0, 0, 0}, {2, 0, 0}, {2, 2, 0}, {0, 2, 0}, {1, 1, 2}}, Polygon[{{1, 2, 5}, {1, 5, 4}, {2, 3, 5}, {3, 4, 5}, {1, 4, 3, 2}}], ImageSize -> 80, ViewPoint -> 3.{ Sin[t], Cos[t], 1}], {t, 0, 4}]Ticks (3)
Draw the axes, but not tick marks:
BoundaryMeshRegion[{{0, 0}, {2, 0}, {1, Sqrt[3]}}, Line[{1, 2, 3, 1}], Axes -> True, Ticks -> None]Place tick marks automatically:
BoundaryMeshRegion[{{0, 0}, {2, 0}, {1, Sqrt[3]}}, Line[{1, 2, 3, 1}], Axes -> True, Ticks -> Automatic]Draw tick marks at the specific positions:
BoundaryMeshRegion[{{0, 0}, {2, 0}, {1, Sqrt[3]}}, Line[{1, 2, 3, 1}], Ticks -> {{1, 2, 3}, {1, 3}}, Axes -> True]TicksStyle (2)
Specify the styles of the ticks and tick labels:
BoundaryMeshRegion[{{0, 0}, {2, 0}, {1, Sqrt[3]}}, Line[{1, 2, 3, 1}], Axes -> True, TicksStyle -> Directive[Red, Bold]]Specify the styles of ![]() and
and ![]() axis ticks separately:
axis ticks separately:
BoundaryMeshRegion[{{0, 0}, {2, 0}, {1, Sqrt[3]}}, Line[{1, 2, 3, 1}], Axes -> True, TicksStyle -> {Directive[Red, Bold], Directive[Blue, 12]}]ViewAngle (1)
ViewCenter (1)
Place the top-right corner of the object at the center of the final image:
Framed[BoundaryMeshRegion[{{0, 0, 0}, {2, 0, 0}, {2, 2, 0}, {0, 2, 0}, {1, 1, 2}}, Polygon[{{1, 2, 5}, {1, 5, 4}, {2, 3, 5}, {3, 4, 5}, {1, 4, 3, 2}}], ViewCenter -> {1, .5, .5}, SphericalRegion -> True]]ViewMatrix (1)
Orthographic view of a mesh region from the negative ![]() direction:
direction:
BoundaryMeshRegion[{{0, 0, 0}, {2, 0, 0}, {2, 2, 0}, {0, 2, 0}, {1, 1, 2}}, Polygon[{{1, 2, 5}, {1, 5, 4}, {2, 3, 5}, {3, 4, 5}, {1, 4, 3, 2}}], ViewMatrix -> {TransformationMatrix[RescalingTransform[{{-1, 1}, {-1, 1}, {-1, 1}}]], {{1, 0, 0, 0}, {0, 1, 0, 0}, {0, 0, -1, 0}, {0, 0, 0, 1}}}]ViewPoint (3)
Specify the view point using the special scaled coordinates:
BoundaryMeshRegion[{{0, 0, 0}, {2, 0, 0}, {2, 2, 0}, {0, 2, 0}, {1, 1, 2}}, Polygon[{{1, 2, 5}, {1, 5, 4}, {2, 3, 5}, {3, 4, 5}, {1, 4, 3, 2}}], ViewPoint -> {Pi, Pi / 2, 2}]{BoundaryMeshRegion[{{0, 0, 0}, {2, 0, 0}, {2, 2, 0}, {0, 2, 0}, {1, 1, 2}}, Polygon[{{1, 2, 5}, {1, 5, 4}, {2, 3, 5}, {3, 4, 5}, {1, 4, 3, 2}}], ViewPoint -> Front],
BoundaryMeshRegion[{{0, 0, 0}, {2, 0, 0}, {2, 2, 0}, {0, 2, 0}, {1, 1, 2}}, Polygon[{{1, 2, 5}, {1, 5, 4}, {2, 3, 5}, {3, 4, 5}, {1, 4, 3, 2}}], ViewPoint -> Top]}{BoundaryMeshRegion[{{0, 0, 0}, {2, 0, 0}, {2, 2, 0}, {0, 2, 0}, {1, 1, 2}}, Polygon[{{1, 2, 5}, {1, 5, 4}, {2, 3, 5}, {3, 4, 5}, {1, 4, 3, 2}}], ViewPoint -> {0, -Infinity, 0}],
BoundaryMeshRegion[{{0, 0, 0}, {2, 0, 0}, {2, 2, 0}, {0, 2, 0}, {1, 1, 2}}, Polygon[{{1, 2, 5}, {1, 5, 4}, {2, 3, 5}, {3, 4, 5}, {1, 4, 3, 2}}], ViewPoint -> {0, 0, Infinity}]}ViewRange (2)
By default, the range is sufficient to include all the objects:
BoundaryMeshRegion[{{0, 0, 0}, {2, 0, 0}, {2, 2, 0}, {0, 2, 0}, {1, 1, 2}}, Polygon[{{1, 2, 5}, {1, 5, 4}, {2, 3, 5}, {3, 4, 5}, {1, 4, 3, 2}}], ViewPoint -> {1, 0, 1.5}, SphericalRegion -> True]Specify the minimum and maximum distances from the camera to be included:
BoundaryMeshRegion[{{0, 0, 0}, {2, 0, 0}, {2, 2, 0}, {0, 2, 0}, {1, 1, 2}}, Polygon[{{1, 2, 5}, {1, 5, 4}, {2, 3, 5}, {3, 4, 5}, {1, 4, 3, 2}}], ViewPoint -> {1, 0, 1.5}, ViewRange -> {3.5, 7.2}, SphericalRegion -> True]ViewVector (1)
ViewVertical (2)
Use the ![]() axis direction as the vertical direction in the final image:
axis direction as the vertical direction in the final image:
BoundaryMeshRegion[{{0, 0, 0}, {2, 0, 0}, {2, 2, 0}, {0, 2, 0}, {1, 1, 2}}, Polygon[{{1, 2, 5}, {1, 5, 4}, {2, 3, 5}, {3, 4, 5}, {1, 4, 3, 2}}], ViewVertical -> {1, 0, 0}]Various views of vertical directions:
Table[BoundaryMeshRegion[{{0, 0, 0}, {2, 0, 0}, {2, 2, 0}, {0, 2, 0}, {1, 1, 2}}, Polygon[{{1, 2, 5}, {1, 5, 4}, {2, 3, 5}, {3, 4, 5}, {1, 4, 3, 2}}], ViewVertical -> v], {v, {{1, 0, 1}, {.5, 0, 1}, {0, -.5, 1}, {0, -1, 1}}}]Applications (6)
Polygons (2)
Non-intersecting polygons are also BoundaryMeshRegion:
RegularPolygonMesh[n_Integer] :=
BoundaryMeshRegion[Table[{Cos[k 2π / n], Sin[k 2π / n]}, {k, n}], Line[Append[Range[n], 1]]]Table[RegularPolygonMesh[n], {n, 3, 10}]The resulting regions can be used for computing:
Area /@ %The area approaches ![]() as the number of sides goes to infinity:
as the number of sides goes to infinity:
Table[Area[RegularPolygonMesh[n]], {n, {10, 10 ^ 2, 10 ^ 3}}]Build a BoundaryMeshRegion in 2D with multiple rectangular holes. The coordinates for the inner rectangles:
rectangleCoords[{i_, j_}] := rectangleCoords[{i, j}, {0.5, 0.5}];
rectangleCoords[{i_, j_}, {α_, β_}] := {{i - α / 2, j - β / 2}, {i + α / 2, j - β / 2}, {i + α / 2, j + β / 2}, {i - α / 2, j + β / 2}};
The indexes for the inner rectangle closed curves:
rectangleIndexes[i_] := Line[i - 1 + {1, 2, 3, 4, 1}];Generating an outer rectangle with ![]() ×
×![]() inner rectangle closed curves:
inner rectangle closed curves:
RectangleHoleMesh[{m_, n_}] :=
	Module[{oc, hc},
	hc = Flatten[Table[rectangleCoords[{i, j}], {j, n}, {i, m}], 2];
	oc = {{0, 0}, {m + 1, 0}, {m + 1, n + 1}, {0, n + 1}};
	BoundaryMeshRegion[Join[hc, oc],
	rectangleIndexes[4 m n + 1],
	Sequence@@Table[rectangleIndexes[i], {i, 1, 4 m n, 4}]
	]
	]
The resulting mesh can be used for computing:
RectangleHoleMesh[{20, 10}]RegionMeasure[%]Polyhedra (4)
Non-intersecting polyhedra are also a BoundaryMeshRegion:
PolyhedronMesh[name_String] :=
	BoundaryMeshRegion[PolyhedronData[name, "Vertices"], Polygon[PolyhedronData[name, "FaceIndices"]]]
The Archimedean or semi-regular polyhedra:
PolyhedronMesh /@ PolyhedronData["Archimedean"]Color the faces based on the number of vertices:
ColoredPolyhedron[name_String] :=
	Module[{faces},
	faces = GatherBy[PolyhedronData[name, "FaceIndices"], Length[#]&];
	BoundaryMeshRegion[PolyhedronData[name, "Vertices"], Table[Style[Polygon[faces[[i]]], ColorData[100, i]], {i, Length[faces]}]]
	]
Color the faces of Archimedean polyhedra:
Magnify[ColoredPolyhedron /@ PolyhedronData["Archimedean"], 0.5]Build a BoundaryMeshRegion with multiple voids by using multiple inner cuboid boundaries. The coordinates for the inner cuboids:
cuboidCoords[{i_, j_, k_}] := cuboidCoords[{i, j, k}, {0.5, 0.5, 0.5}];
cuboidCoords[{i_, j_, k_}, {α_, β_, γ_}] :=
	{{i - α / 2, j - β / 2, k - γ / 2}, {i - α / 2, j + β / 2, k - γ / 2}, {i + α / 2, j + β / 2, k - γ / 2}, {i + α / 2, j - β / 2, k - γ / 2}, {i - α / 2, j - β / 2, k + γ / 2}, {i - α / 2, j + β / 2, k + γ / 2}, {i + α / 2, j + β / 2, k + γ / 2}, {i + α / 2, j - β / 2, k + γ / 2}};
The indexes for inner cuboid closed surfaces:
cuboidIndexes[i_] := Polygon[(i - 1) + {{2, 3, 4, 1}, {1, 4, 8, 5}, {4, 3, 7, 8}, {3, 2, 6, 7}, {2, 1, 5, 6}, {5, 8, 7, 6}}]Generating an outer cuboid with ![]() ×
×![]() ×
×![]() inner cuboid surfaces:
inner cuboid surfaces:
CuboidVoidMesh[{m_, n_, p_}] :=
	Module[{oc, vc},
	vc = Flatten[Table[cuboidCoords[{i, j, k}], {k, p}, {j, n}, {i, m}], 3];
	oc = {{0, 0, 0}, {0, n + 1, 0}, {m + 1, n + 1, 0}, {m + 1, 0, 0}, {0, 0, p + 1}, {0, n + 1, p + 1}, {m + 1, n + 1, p + 1}, {m + 1, 0, p + 1}};
	BoundaryMeshRegion[Join[vc, oc],
	cuboidIndexes[8 m n p + 1],
	Sequence@@Table[cuboidIndexes[i], {i, 1, 8 m n p, 8}]]
	]
The resulting region can be used for computing:
HighlightMesh[CuboidVoidMesh[{5, 4, 3}], Style[2, Opacity[0.3]]]RegionMeasure[%]Construct a cuboid boundary mesh with rectangular tunnels through it. You can construct it as the product of a 2D boundary mesh with an interval. Using the same construction as for constructing the polygon with holes above for the 2D boundary mesh:
rectangleCoords[{i_, j_}] := rectangleCoords[{i, j}, {0.5, 0.5}];
rectangleCoords[{i_, j_}, {α_, β_}] := {{i - α / 2, j - β / 2}, {i + α / 2, j - β / 2}, {i + α / 2, j + β / 2}, {i - α / 2, j + β / 2}};rectangleIndexes[i_] := Line[i - 1 + {1, 2, 3, 4, 1}];The resulting boundary representation for a polygon with ![]() ×
×![]() holes:
holes:
RectangleHoleMesh[{m_, n_}] :=
	Module[{oc, hc},
	hc = Flatten[Table[rectangleCoords[{i, j}], {j, n}, {i, m}], 2];
	oc = {{0, 0}, {m + 1, 0}, {m + 1, n + 1}, {0, n + 1}};
	BoundaryMeshRegion[Join[hc, oc],
	rectangleIndexes[4 m n + 1],
	Sequence@@Table[rectangleIndexes[i], {i, 1, 4 m n, 4}]
	]
]RectangleHoleMesh[{4, 3}]Compute the Cartesian product with an interval:
TunnelMesh[{m_, n_}] :=
BoundaryMesh[RegionProduct[TriangulateMesh[RectangleHoleMesh[{m, n}], MeshQualityGoal -> "Minimal"], MeshRegion[{{0}, {1}}, Line[{1, 2}]]]]TunnelMesh[{4, 3}]Style it so that you can only see the boundary surfaces:
HighlightMesh[%, {Style[1, None], Style[2, Opacity[0.5]]}]You can still compute with this region:
NIntegrate[1, {x, y, z}∈%]Properties & Relations (8)
BoundaryMeshRegion can represent full-dimensional regions:
ℛ = BoundaryMeshRegion[{{0, 0}, {1, 0}, {0, 1}}, Line[{1, 2, 3, 1}]]Since the geometric dimension is the embedding dimension, it is full dimensional:
{RegionEmbeddingDimension[ℛ], RegionDimension[ℛ]}BoundaryMeshRegion is always bounded:
ℛ = BoundaryMeshRegion[{{0, 0}, {1, 0}, {0, 1}}, Line[{1, 2, 3, 1}]]Use BoundedRegionQ to test and RegionBounds for actual bounds:
{BoundedRegionQ[ℛ], RegionBounds[ℛ]}BoundaryMeshRegionQ can be used to test whether a region is a BoundaryMeshRegion:
ℛ = BoundaryMeshRegion[{{0, 0}, {1, 0}, {0, 1}}, Line[{1, 2, 3, 1}]]BoundaryMeshRegionQ[ℛ]Use ConvexHullMesh to create a BoundaryMeshRegion from a set of points:
p2 = RandomReal[1, {100, 2}];
p3 = RandomReal[1, {100, 3}];ConvexHullMesh /@ {p2, p3}Use BoundaryMesh to convert a MeshRegion to a BoundaryMeshRegion:
mr = MeshRegion[{{0, 0}, {1, 0}, {0, 1}, {1, 1}, {2, 0}}, {Triangle[{1, 2, 3}], Triangle[{4, 3, 2}], Line[{4, 5}]}]Only the full-dimensional component can be represented:
BoundaryMesh[mr]Use BoundaryDiscretizeRegion to convert any region to a BoundaryMeshRegion:
BoundaryDiscretizeRegion[ImplicitRegion[x ^ 2 + y ^ 2 ≤ 1 || y == 0, {x, y}]]To include lower-dimensional components, use DiscretizeRegion:
DiscretizeRegion[ImplicitRegion[x ^ 2 + y ^ 2 ≤ 1 || y == 0, {x, y}], {{-2, 2}, {-1, 1}}]Use Show to convert any BoundaryMeshRegion to Graphics:
ℛ = BoundaryMeshRegion[{{0, 0}, {1, 0}, {0, 1}}, Line[{1, 2, 3, 1}]]Show[ℛ]//InputFormBoundaryMeshRegion is usually more memory efficient than MeshRegion:
pts = RandomReal[{-1, 1}, {50, 2}];{DelaunayMesh[pts], ConvexHullMesh[pts]}ByteCount /@ %Text
Wolfram Research (2014), BoundaryMeshRegion, Wolfram Language function, https://reference.wolfram.com/language/ref/BoundaryMeshRegion.html (updated 2015).
CMS
Wolfram Language. 2014. "BoundaryMeshRegion." Wolfram Language & System Documentation Center. Wolfram Research. Last Modified 2015. https://reference.wolfram.com/language/ref/BoundaryMeshRegion.html.
APA
Wolfram Language. (2014). BoundaryMeshRegion. Wolfram Language & System Documentation Center. Retrieved from https://reference.wolfram.com/language/ref/BoundaryMeshRegion.html