

CommunityGraphPlot
generates a plot showing the community structure of the graph g.
CommunityGraphPlot[g,{{vi1,vi2,…},…}]
generates a plot for the graph g with communities {vi1,vi2,…}, ….
CommunityGraphPlot[g,{…,wj[{vi1,…}],…}]
generates a plot with highlighting features defined by the symbol wrappers wj.
CommunityGraphPlot[{vi1vj1,vi2vj2,…},…]
generates a plot for a graph in which vertex vik is connected to vertex vjk.
CommunityGraphPlot[m,…]
generates a plot for a graph represented by the adjacency matrix m.
Details and Options
- CommunityGraphPlot attempts to draw the vertices grouped into communities.
- The following wrappers wi can be used for communities:
-
Annotation[a,label] provide an annotation Button[a,action] define an action to execute when the element is clicked EventHandler[a,…] define a general event handler for the element Hyperlink[a,uri] make the element act as a hyperlink Labeled[a,…] display the element with labeling PopupWindow[a,cont] attach a popup window to the element Annotation[a,namevalue] set an annotation for the element StatusArea[a,label] display in the status area when moused over Style[a,opts] show the element using the specified styles Tooltip[a,label] attach an arbitrary tooltip to the element - CommunityGraphPlot has the same options as Graph, with the following additions and changes: [List of all options]
-
CommunityRegionStyle Automatic style of community region CommunityBoundaryStyle Automatic style of community boundary CommunityLabels None labels for communities Method Automatic methods to use PlotLegends None legend for communities - Possible settings for PlotTheme include common base themes:
-

"Business" a bright, modern look appropriate for business presentations or infographics 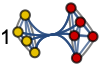
"Detailed" identify data by employing labels and tooltips 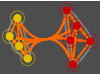
"Marketing" elegant, eye-catching design suitable for marketing needs 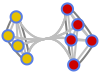
"Minimal" simple graph 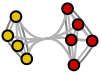
"Monochrome" single-color design 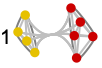
"Scientific" candid design useful for analyzing detailed data with labels and tooltips 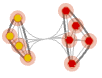
"Web" clean, bold design suitable for a consumer website or blog 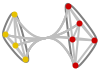
"Classic" historical design of graph to remain compatible with existing uses
List of all options
Examples
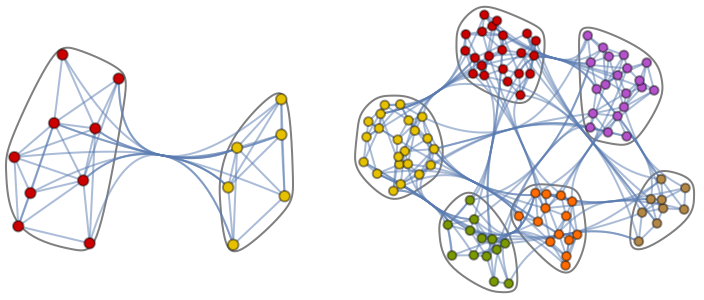
open all close allBasic Examples (2)
CommunityGraphPlot[ExampleData[{"NetworkGraph", "DolphinSocialNetwork"}]]g = ExampleData[{"NetworkGraph", "ZacharyKarateClub"}];FindGraphCommunities[g]CommunityGraphPlot[g, %]Scope (8)
CommunityGraphPlot works with undirected graphs:
CommunityGraphPlot[[image]]CommunityGraphPlot[[image]]CommunityGraphPlot[[image]]CommunityGraphPlot[[image]]Specify a graph using a rule list:
CommunityGraphPlot[{1 -> 3, 1 -> 5, 1 -> 7, 1 -> 10, 1 -> 13, 2 -> 5, 2 -> 6, 2 -> 8, 2 -> 10, 2 -> 14, 3 -> 4, 4 -> 5, 2 -> 3, 1 -> 2, 14 -> 1}]CommunityGraphPlot[(| | | | | | |
| - | - | - | - | - | - |
| 0 | 1 | 1 | 1 | 0 | 0 |
| 1 | 0 | 1 | 1 | 1 | 0 |
| 1 | 1 | 0 | 1 | 1 | 1 |
| 1 | 1 | 1 | 0 | 1 | 1 |
| 0 | 1 | 1 | 1 | 0 | 1 |
| 0 | 0 | 1 | 1 | 1 | 0 |)]CommunityGraphPlot[[image], {{4, 5, 7}, {1, 2, 3}, {6, 9, 8}}]CommunityGraphPlot[[image], {Style[{4, 5, 7, 1, 2}, Green], {3, 6, 9, 8}}]CommunityGraphPlot[[image], {Labeled[{4, 5, 7, 1, 2}, "A"], {3, 6, 9, 8}}]Options (17)
AspectRatio (2)
By default, CommunityGraphPlot automatically determines the height to width ratio for the plot:
CommunityGraphPlot[IconizedObject[«graph»]]Make the height the same as the width with AspectRatio1:
CommunityGraphPlot[IconizedObject[«graph»], AspectRatio -> 1]CommunityBoundaryStyle (4)
The default community boundary style is a gray line:
CommunityGraphPlot[[image], CommunityBoundaryStyle -> Automatic]CommunityGraphPlot[[image], CommunityBoundaryStyle -> Green]Use None to not show boundary lines:
CommunityGraphPlot[[image], CommunityBoundaryStyle -> None]Alternate between red and dashed boundary lines:
CommunityGraphPlot[[image], CommunityBoundaryStyle -> {Red, Dashed}]CommunityLabels (3)
Generate labels for communities:
CommunityGraphPlot[[image], CommunityLabels -> {"one", "two", "three"}]Use Labeled to specify individual labels:
CommunityGraphPlot[[image], {Labeled[{1, 4, 10, 6}, "one"], {2, 5, 8}, {9, 3, 7}}]Use Placed to control the placement of labels:
CommunityGraphPlot[[image], CommunityLabels -> Placed[{"one", "two", "three"}, Below]]CommunityRegionStyle (3)
The default community region style is None:
CommunityGraphPlot[[image]]This can also be obtained with CommunityRegionStyle->None:
CommunityGraphPlot[[image], CommunityRegionStyle -> None]Use green colors on community regions:
CommunityGraphPlot[[image], CommunityRegionStyle -> Green]Alternate between red and blue colors on community regions:
CommunityGraphPlot[[image], CommunityRegionStyle -> {Red, Blue}]Method (2)
By default, CommunityGraphPlot uses a force-directed layout:
CommunityGraphPlot[[image]]This can also be obtained with Method->"SpringElectrical":
CommunityGraphPlot[[image], Method -> "SpringElectrical"]Use Method->"Hierarchical" for a hierarchical layout:
CommunityGraphPlot[[image], Method -> "Hierarchical"]PlotLegends (3)
Generate a legend for communities:
CommunityGraphPlot[[image], PlotLegends -> {"one", "two", "three"}]Use Legended to specify individual legend entries:
CommunityGraphPlot[[image], {Legended[{1, 4, 10, 6}, "one"], {2, 5, 8}, {9, 3, 7}}]Use Placed to control the placement of legends:
CommunityGraphPlot[[image], PlotLegends -> Placed[Automatic, Below]]Text
Wolfram Research (2012), CommunityGraphPlot, Wolfram Language function, https://reference.wolfram.com/language/ref/CommunityGraphPlot.html.
CMS
Wolfram Language. 2012. "CommunityGraphPlot." Wolfram Language & System Documentation Center. Wolfram Research. https://reference.wolfram.com/language/ref/CommunityGraphPlot.html.
APA
Wolfram Language. (2012). CommunityGraphPlot. Wolfram Language & System Documentation Center. Retrieved from https://reference.wolfram.com/language/ref/CommunityGraphPlot.html