


FeatureValueImpactPlot
FeatureValueImpactPlot[model,data]
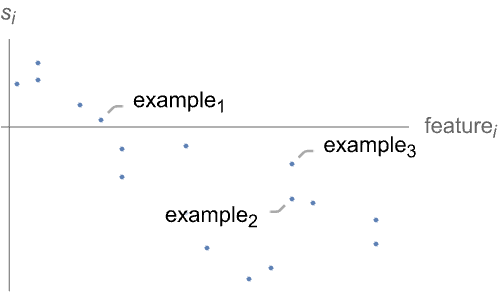
plots the impact of the value of a given feature in data on the result of model.
FeatureValueImpactPlot[model]
estimates the feature value impact using synthetic data.
FeatureValueImpactPlot[modelfname,…]
plots only the impact of the specified feature fname.
FeatureValueImpactPlot[modelfnameclass,…]
plots only the impact on the classification class.
Details and Options
- FeatureValueImpactPlot is used to interpret the contribution of examples' feature values to the results of a machine learning model like a predictor or a classifier.
- Feature impacts are typically used to give insights into the decision process of an otherwise "black-box" machine learning algorithm, understand the model's inner workings, prevent unwanted biases, etc.
- For every example, the impact
 is plotted as a function of
  . The impact on the value
  is the deviation from the mean value
  according to
  :
: -
- Possible values for model are:
-
ClassifierFunction[…] a classification model PredictorFunction[…] a regression model - The result of a predictor is a scalar value and si is the deviation from the average prediction
 .
. - The result of a classifier is typically a vector of log-odds that are returned as probabilities for each class.
- The impact si is the deviation from the log-odds prior logodds0 for a given class.
- Possible values for data are:
-
example a single example {example1,…} a List, Association or Dataset of examples Automatic uses the model's missing imputer to generate examples - If no data is provided, synthetic examples will be generated using the model's missing value synthesizer based on training data.
- Possible values for fname are:
-
All impact of all the features (default) feature impact of feature only {feature1,…} impact of a list of featurei - When model is a ClassifierFunction[…], possible values for class are:
-
All impact on all the classes (default) name impact on class name only {name1,…} impact on a list of namei - FeatureValueImpactPlot has the same options as Graphics, with the following additions and changes: [List of all options]
-
AspectRatio 1/GoldenRatio ratio of height to width Axes True whether to draw axes AxesLabel Automatic axes labels DataRange Automatic the range of x values to assume for data IntervalMarkers Automatic how to render uncertainty IntervalMarkersStyle Automatic style for uncertainty elements Filling None how to fill in stems for each point FillingStyle Automatic style to use for filling Joined False whether to join points LabelingFunction Automatic how to label points LabelingSize Automatic maximum size of callouts and labels MultiaxisArrangement None how to arrange multiple axes for data PerformanceGoal $PerformanceGoal aspects of performance to try to optimize PlotLabel Automatic overall label for the plot PlotLabels Automatic labels for data PlotLayout "Overlaid" how to position data PlotLegends None legends for data PlotMarkers None markers to use to indicate each point PlotRange Automatic range of values to include PlotRangeClipping True whether to clip at the plot range PlotStyle Automatic graphics directives to determine styles of points PlotTheme $PlotTheme overall theme for the plot ScalingFunctions Automatic how to scale individual coordinates TargetUnits Automatic units to display in the plot - ColorData["DefaultPlotColors"] gives the default sequence of colors used by PlotStyle.
List of all options
Examples
open all close allBasic Examples (2)
Train a linear regression on a sample dataset:
trainingset = Table[x -> 2x - 1, {x, 10}]predictor = Predict[trainingset, Method -> "LinearRegression"]Visualize the impact of the input feature on the average model result:
FeatureValueImpactPlot[predictor, Range[10]]Compare the plot with the numerical deviation between the average and the prediction:
predictor[Range[10]] - Information[predictor, "TrainingLabelMean"]Train a classifier to identify an Iris species from some features of the plant:
data = ResourceData["Sample Data: Fisher's Irises"];
First[data]model = Classify[data -> "Species", Method -> "LogisticRegression"]Visualize how a feature value affects the odds of each class:
FeatureValueImpactPlot[model -> "PetalLength", data]Scope (4)
Visualize the cumulative impacts on a prediction:
model = Predict[{{1.3, "P"} -> 1, {1.8, "Q"} -> 2.5, {1.9, "Q"} -> 3, {0.2, "P"} -> 1, {-3.2, "P"} -> -4.2, {0.3, "Q"} -> 2}]FeatureValueImpactPlot[model, {{1.3, "P"}, {1.8, "Q"}, {1.9, "Q"}, {0.2, "P"}, {-3.2, "P"}, {0.3, "Q"}}]Visualize the cumulative impacts on a classification:
model = Classify[{{1.5, Blue} -> "A", {3.2, Blue} -> "A", {4.1, Red} -> "B", {5.3, Red} -> "B", {10., Green} -> "C", {12.4, Red} -> "C"}]FeatureValueImpactPlot[model, {{1.5, Blue}, {3.2, Blue}, {4.1, Red}, {5.3, Red}, {10., Green}, {12.4, Red}}]Use synthetic data to compute the impacts:
model = Predict[{{1.3, "P"} -> 1, {1.8, "Q"} -> 2.5, {1.9, "Q"} -> 3, {0.2, "P"} -> 1, {-3.2, "P"} -> -4.2, {0.3, "Q"} -> 2}]FeatureValueImpactPlot[model, {{1.3, "P"}, {1.8, "Q"}, {1.9, "Q"}, {0.2, "P"}, {-3.2, "P"}, {0.3, "Q"}}]Visualize the impact on a specific classification:
model = Classify[{{1.5, Blue} -> "A", {3.2, Blue} -> "A", {4.1, Red} -> "B", {5.3, Red} -> "B", {10., Green} -> "C", {12.4, Red} -> "C"}]FeatureValueImpactPlot[model -> All -> "A", {{1.5, Blue}, {3.2, Blue}, {4.1, Red}, {5.3, Red}, {10., Green}, {12.4, Red}}]Visualize the impact on a list of classes:
FeatureValueImpactPlot[model -> All -> {"A", "C"}, {{1.5, Blue}, {3.2, Blue}, {4.1, Red}, {5.3, Red}, {10., Green}, {12.4, Red}}]Options (12)
AspectRatio (1)
AxesLabel (1)
AxesStyle (1)
Frame (2)
FrameLabel (2)
Place a label along the bottom frame of a plot:
FeatureValueImpactPlot[Predict[Table[x -> 2 - x, {x, 10}]], Frame -> True, FrameLabel -> {"x"}]Place labels on each of the edges in the frame:
FeatureValueImpactPlot[Predict[Table[x -> 2 - x, {x, 10}]], Frame -> True, FrameLabel -> {{"left", "right"}, {"bottom", "top"}}]Filling (1)
MaxPlotPoints (1)
PlotLabel (1)
PlotLegends (1)
By default, a legend based on the output class is used:
data = {{1.5, Blue} -> "A", {3.2, Blue} -> "A", {4.1, Red} -> "B", {5.3, Red} -> "B", {10., Green} -> "C", {12.4, Red} -> "C"};classifier = Classify[data]FeatureValueImpactPlot[classifier, Keys@data]FeatureValueImpactPlot[classifier, Keys@data, PlotLegends -> None]Create a legend with placeholder text:
FeatureValueImpactPlot[classifier, Keys@data, PlotLegends -> "Placeholder"]Create a legend with specific labels:
FeatureValueImpactPlot[classifier, Keys@data, PlotLegends -> {"Class: A", "Class: B", "Class: C"}]PlotStyle (1)
By default, different styles are chosen for multiple curves:
classifier = Classify[Table[x -> If[x < 5, "A", "B"], {x, 0, 10, .1}]];FeatureValueImpactPlot[classifier]Explicitly specify the style for different curves:
FeatureValueImpactPlot[classifier, PlotStyle -> {Red, Blue}]Applications (1)
Analyze how different models are affected by feature variations:
trainingset = Flatten@Table[{x, y} -> x * y - 5y, {x, 10}, {y, 10}];
Short[trainingset]
Train a linear model to predict a value given by the nonlinear combination of two features:
predictor = Predict[trainingset, Method -> "LinearRegression"]As expected, the impact of each feature depends only on that feature value:
FeatureValueImpactPlot[predictor, trainingset[[All, 1]], PlotStyle -> PointSize@Medium]Train a nonlinear model on the same data:
predictor2 = Predict[trainingset, Method -> "GradientBoostedTrees"]Now the same feature value can have different impacts depending on the other feature in the example:
FeatureValueImpactPlot[predictor2, trainingset[[All, 1]], PlotStyle -> PointSize@Medium]Text
Wolfram Research (2022), FeatureValueImpactPlot, Wolfram Language function, https://reference.wolfram.com/language/ref/FeatureValueImpactPlot.html.
CMS
Wolfram Language. 2022. "FeatureValueImpactPlot." Wolfram Language & System Documentation Center. Wolfram Research. https://reference.wolfram.com/language/ref/FeatureValueImpactPlot.html.
APA
Wolfram Language. (2022). FeatureValueImpactPlot. Wolfram Language & System Documentation Center. Retrieved from https://reference.wolfram.com/language/ref/FeatureValueImpactPlot.html