

FeatureImpactPlot
FeatureImpactPlot[model,data]
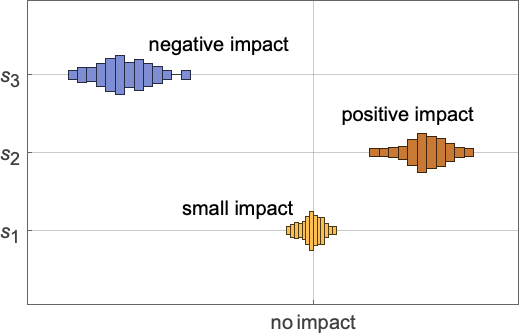
plots the impact of the value of each feature in data on the result of model.
FeatureImpactPlot[model]
estimates the feature impacts using synthetic data.
FeatureImpactPlot[modelfname,…]
plots only the impact of the specified feature fname.
FeatureImpactPlot[modelfnameclass,…]
plots only the impact on the classification class.
Details and Options
- FeatureImpactPlot is used to interpret the contribution of examples' feature values to the results of a machine learning model such as a regression or a classification.
- Feature impacts are typically used to give insights into the decision process of an otherwise "black-box" machine learning algorithm, understand the model's inner workings, prevent unwanted biases, etc.
- For every example, the distribution of the impact
 of
of  is plotted. The impact on the result
  of model is the deviation from the mean
  according to
  :
: - Possible values for model are:
-
ClassifierFunction[…] a classification model PredictorFunction[…] a regression model FittedModel[…] a symbolic fitted model - The result of a predictor is a scalar value and si is the deviation from the average prediction
 .
. - The result of a classifier is typically a vector of log-odds that are returned as probabilities for each class.
- The impact si is the deviation from the log-odds prior logodds0 for a given class.
- Possible values for data are:
-
example a single example {example1,…} a List, Association or Dataset of examples LearnDistribution[…] a distribution from which to generate synthetic examples Automatic uses the model's missing imputer to generate examples - If no data is provided, synthetic examples will be generated using the model's missing imputer.
- Possible values for fname are:
-
All impact of all the features (default) feature impact of feature only {feature1,…} impact of a list of featurei - When model is a ClassifierFunction[…], possible values for class are:
-
All impact on all the classes (default) name impact on class name only {name1,…} impact on a list of namei - FeatureImpactPlot has the same options as Graphics, with the following additions and changes: [List of all options]
-
AspectRatio 1/GoldenRatio overall ratio of height to width BarOrigin Left origin placement for shapes BarSpacing Automatic fractional spacing between shapes ChartBaseStyle Automatic overall style for shapes ChartElementFunction Automatic how to generate raw graphics for shapes ChartLabels Automatic labels for data elements and datasets ChartLayout Automatic overall layout to use ChartLegends None legends for data elements and datasets ChartStyle Automatic style for shapes Frame True whether to draw a frame around the chart LabelingFunction Automatic how to label shapes LabelingSize Automatic maximum size of callouts and labels LegendAppearance Automatic overall appearance of legends Method Automatic what methods to use PerformanceGoal "Speed" aspects of performance to try to optimize PlotTheme $PlotTheme overall theme for the chart ScalingFunctions None how to scale individual coordinates TargetUnits Automatic units to display in the chart
List of all options
Examples
open all close allBasic Examples (2)
Train a predictor on a linear problem:
model = Predict[Catenate@Table[{x, y} -> 3 x - .5 y + 1, {x, 0, 5}, {y, 0, 5}]]Visualize the distribution of the effect of each feature using random data:
FeatureImpactPlot[model]Visualize a summary of the impact of each feature on a predictor result:
prd = Predict[ResourceData["Sample Data: Wine Quality"] -> "WineQuality"]sample = RandomSample[ResourceData["Sample Data: Wine Quality"], 150];FeatureImpactPlot[prd, sample]Visualize the impact of only two features:
FeatureImpactPlot[prd -> {"PH", "Alcohol"}, sample]Scope (3)
Visualize the impact distributions on a prediction task:
model = Predict[{{1.3, "P"} -> 1, {1.8, "Q"} -> 2.5, {1.9, "Q"} -> 3, {0.2, "P"} -> 1, {-3.2, "P"} -> -4.2, {0.3, "Q"} -> 2}]FeatureImpactPlot[model, {{1, "Q"}, {2, "P"}, {-1, "Q"}}, ChartStyle -> PointSize[Large]]Visualize the impact distributions on a classification task:
model = Classify[{{1.5, Blue} -> "A", {3.2, Blue} -> "A", {4.1, Red} -> "B", {5.3, Red} -> "B", {10., Green} -> "C", {12.4, Red} -> "C"}]FeatureImpactPlot[model]FeatureImpactPlot[model -> All -> "C"]Use synthetic data to compute the impacts:
model = Predict[{{1.3, "P"} -> 1, {1.8, "Q"} -> 2.5, {1.9, "Q"} -> 3, {0.2, "P"} -> 1, {-3.2, "P"} -> -4.2, {0.3, "Q"} -> 2}]FeatureImpactPlot[model]Options (2)
BarOrigin (1)
ChartStyle (1)
model = Predict[{{1.3, "P"} -> 1, {1.8, "Q"} -> 2.5, {1.9, "Q"} -> 3, {0.2, "P"} -> 1, {-3.2, "P"} -> -4.2, {0.3, "Q"} -> 2}];FeatureImpactPlot[model, ChartStyle -> "Pastel"]Specify one color for each feature:
FeatureImpactPlot[model, ChartStyle -> {Red, Blue}]Text
Wolfram Research (2022), FeatureImpactPlot, Wolfram Language function, https://reference.wolfram.com/language/ref/FeatureImpactPlot.html.
CMS
Wolfram Language. 2022. "FeatureImpactPlot." Wolfram Language & System Documentation Center. Wolfram Research. https://reference.wolfram.com/language/ref/FeatureImpactPlot.html.
APA
Wolfram Language. (2022). FeatureImpactPlot. Wolfram Language & System Documentation Center. Retrieved from https://reference.wolfram.com/language/ref/FeatureImpactPlot.html