



ParallelAxisPlot
ParallelAxisPlot[{{y11,…,y1n},…,{ym1,…,ymn}}]
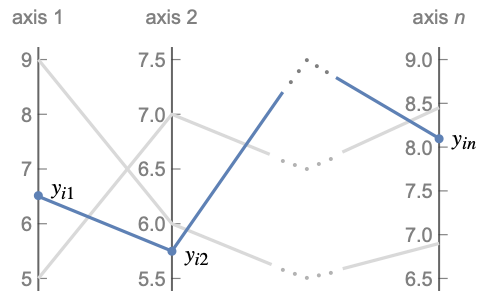
点{yi1,…,yin}についての平行軸プロットを,等間隔に置かれた軸を使って生成する.
ParallelAxisPlot[{data1,data2,…}]
点の複数の集合をプロットする.
詳細とオプション
- ParallelAxisPlotは,平行座標プロットあるいは断面図としても知られている.
- ParallelAxisPlotは,
 個の平行軸の座標値を通る線を引くことで
 次元の点を表示する.互いに接近している線は,点が互いに接近していることを示す.
- データ値 yiは次の形式で与えられる.
-
yi 実数値の数 Quantity[yi,unit] 単位が付いた数量 - 上記の形式ではない値 yiは欠落値とみなされ,表示されない.
- dataiは次の形式と解釈を持つ.
-
<"k1"y1,"k2"y2,…> 値{y1,y2,…} {y1"lbl1",y2"lbl2",…}, {y1,y2,…}{"lbl1","lbl2",…} ラベルが{lbl1,lbl2,…}の値{y1,y2,…} SparseArray 通常の配列としての値 TimeSeries,EventSeries,… 時間と値のペア QuantityArray 大きさ WeightedData 重みなしの値 - ParallelAxisPlot[Tabular[…]cspec]は,列指定 cspec を使って表オブジェクトから値を抽出し,これをプロットする.
- 次は,表データのプロットに使用可能な列指定 cspec の形式である.
-
{coly1,…,colyn} 各列 colyiをその軸上にプロットする - 次は,使用可能なラッパーである.
-
Annotation[datai,label] データの注釈を与える Button[datai,action] データがクリックされたときに実行する動作を定義する Callout[datai,label] コールアウトでデータにラベルを付ける Callout[datai,label,pos] 相対的な位置 pos にコールアウトを置く EventHandler[datai,events] データの一般的なイベントハンドラを定義する Hyperlink[datai,uri] データをハイパーリンクにする Labeled[datai,label] データにラベルを付ける Labeled[datai,label,pos] 相対的な位置 pos にラベルを置く Legended[datai,label] 凡例でデータを識別する PopupWindow[datai,cont] データにポップアップウィンドウを付ける StatusArea[datai,label] マウスオーバー時にステータスエリアに表示する Style[datai,styles] 指定のスタイルでデータを表示する Tooltip[datai,label] 曲線にツールチップを付ける - ラッパー w は複数のレベルで適用できる.
-
w[{y1,…,yn}] 点を包み込む w[{data1,…}] 点集合 dataiを包み込む w1[w2[…]] ネストしたラッパーを使う - ParallelAxisPlotには,Graphicsと同じオプションに以下の追加・変更を加えたものが使える. [全オプションのリスト]
-
AspectRatio 1/GoldenRatio 縦横比 Axes True 軸を描くかどうか ColorFunction Automatic 線の彩色の決定方法 ColorFunctionScaling True ColorFunctionの引数をスケールするかどうか LabelingFunction Automatic 点にどのようにラベルを付けるか LabelingSize Automatic コールアウトとラベルの最大サイズ Mesh None 描く曲線にメッシュ点を描くかどうか MeshStyle Automatic メッシュ点のスタイル PerformanceGoal $PerformanceGoal パフォーマンスのどの面を最適化するか PlotLegends None 線の凡例 PlotMarkers None 各点を識別するためのマーカー PlotRange All 含める値の範囲 PlotStyle Automatic 各線のスタイルを決定するグラフィックス指示子 PlotTheme $PlotTheme プロットの全体的なテーマ ScalingFunctions None 個々の座標をどのようにスケールするか TargetUnits Automatic プロットに表示する単位 - 軸は左から右に並べられる.
- デフォルトで,各軸はそれに沿った値の範囲によって決定されるプロット範囲を使用する.
- PlotRangeAutomaticはすべての軸に同じ範囲を使う.
- Axes,Ticks,PlotRangeのように各軸に適用されるオプションは次の形でよい.
-
s 各軸に設定 s を使う {s1,…,sn} 軸ごとの設定.はじめの軸に設定 s1を使う等 {…,pats,…} パターン pat に合致する位置の軸に設定 s を使う - {…,pats,…}の形式のとき,pat は任意のパターンでよい.軸の位置と合致する最初のパターンが使われる.どのパターンも軸の位置と合致しない場合は,デフォルト値が使われる.
- ColorFunctionに渡される引数は y1,y2,…,ynである.デフォルトで,色関数の引数は軸ごとに0から1の間にスケールされる.
- ColorData["DefaultPlotColors"]は,PlotStyleで使われるデフォルトの色のシーケンスを与える.
全オプションのリスト
例題
すべて開く すべて閉じる例 (3)
ParallelAxisPlot[RandomChoice[Range[10], {5 , 5}]]ParallelAxisPlot[{IconizedObject[«one»], IconizedObject[«two»], IconizedObject[«three»]}]ColorFunctionを使って最初の軸の値によって線にスタイル付けする:
ParallelAxisPlot[{IconizedObject[«one»], IconizedObject[«two»], IconizedObject[«three»]}, ColorFunction -> (ColorData["Rainbow"][#]&)]スコープ (23)
一般的なデータ (6)
ParallelAxisPlotは,軸上の各次元を互いに平行に置くことで多次元データを可視化する:
ParallelAxisPlot[{{4, 5, 10, 7, 3}, {9, 8, 2, 2, 5}, {5, 3, 2, 7, 4}}]ParallelAxisPlot[{{4, 5, 10, 7, 3}, {9, 8, 2, 2, 5}, {5, 3, 2, 7, 4}}, PlotRange -> All]PlotRangeAutomaticはすべての軸を同じ範囲で表示する:
ParallelAxisPlot[{{4, 5, 10, 7, 3}, {9, 8, 2, 2, 5}, {5, 3, 2, 7, 4}}, PlotRange -> Automatic]ParallelAxisPlot[{RandomChoice[Range[0, 7], {5 , 5}], RandomChoice[Range[5, 10], {5 , 5}], RandomChoice[Range[10], {5 , 5}]}]ParallelAxisPlot[{{6, 10, 5, 9, 7, 4}, {10, 5, 8, 6, 3}, {2, 5, 3}}]ParallelAxisPlot[{{8, 3, 5, 6, Missing[], 9}, {2, 6, a, 9, 12, 5}, {6, I, 3, 7, 5, 7}}]表形式データ (1)
特殊データ (2)
Quantityを使ってデータに単位を含める:
ParallelAxisPlot[{Quantity[Range[6], "Meters"], Quantity[Range[6], "Yards"], Quantity[Range[6], "Feet"]},
PlotRange -> Automatic]TimeSeriesの値をプロットする:
ParallelAxisPlot[{TimeSeries[{19, 16, 9, 3, 7, 2, 17}, {"May 24, 1982"}],
	TimeSeries[{10, 19, 15, 3, 18, 17, 19}, {"May 24, 1982"}],
TimeSeries[{10, 11, 17, 18, 8, 7, 19}, {"May 24, 1982"}]}]Associationのキーが軸のラベルとして自動的に使用される:
ParallelAxisPlot[{<|"a" -> 1, "b" -> 2, "c" -> 3|>, <|"a" -> 3, "b" -> 1, "c" -> 2|>, <|"a" -> 5, "b" -> 1, "c" -> 4|>}]データのラッパー (4)
{ParallelAxisPlot[{Style[{1, 3, 2, 4, 5}, Directive[Thick, Red]], {2, 4, 6, 2, 3}, {3, 1, 2, 1, 4}}],
ParallelAxisPlot[Style[{{1, 3, 2, 4, 5}, {2, 4, 6, 2, 3}, {3, 1, 2, 1, 4}}, Directive[Thick, Red]]]}ParallelAxisPlot[Style[{Style[{1, 3, 2, 4, 5}, Directive[Thick, Red]], {2, 4, 6, 2, 3}, {3, 1, 2, 1, 4}}, Directive[Dashed, Purple]]]PopupWindowを使って追加的なドリルダウン情報を提供する:
ParallelAxisPlot[{Style[PopupWindow[{1, 3, 2, 4, 5}, RadialAxisPlot[{1, 3, 2, 4, 5}]], Red], {2, 4, 6, 2, 3}, {3, 1, 2, 1, 4}}]Buttonを使って任意のアクションがトリガできる:
ParallelAxisPlot[{Button[Style[{1, 3, 2, 4, 5}, Red], Print[RadialAxisPlot[{1, 3, 2, 4, 5}]]], {2, 4, 6, 2, 3}, {3, 1, 2, 1, 4}}]ラベル付けと凡例 (6)
LabelingFunctionを使って各データ集合に個別のラベルを加える:
ParallelAxisPlot[RandomReal[1, {2, 4, 5}], LabelingFunction -> (Callout[RandomWord[]]&)]LabelingFunctionに与えられたデータ集合の指標を使ってラベルを構築する:
labels = Table[RandomWord[], 2, 4]ParallelAxisPlot[RandomReal[1, {2, 4, 5}], LabelingFunction -> (Callout[Part[labels, Sequence@@#2]]&)]ParallelAxisPlot[RandomReal[1, {2, 4, 5}], LabelingFunction -> (Callout[Part[labels, Sequence@@#2], Before]&)]Calloutを使ってラベルを加える:
ParallelAxisPlot[{Callout[{1, 3, 2, 4, 3}, "label"], {2, 4, 6, 2, 1}, {3, 1, 2, 1, 4}}]PlotLegendsを使ってColorFunctionからの色を表す棒の凡例を加える:
ParallelAxisPlot[RandomReal[10, {20, 5}], ColorFunction -> "Rainbow", PlotLegends -> Automatic]ParallelAxisPlot[RandomReal[10, {3, 10, 5}], PlotLegends -> {"a", "b", "c"}]Legendedを使って凡例を加える:
ParallelAxisPlot[{Legended[Style[{1, 3, 2, 4, 3}, Red], "label"], {2, 4, 6, 2, 1}, {3, 1, 2, 1, 4}}]プレゼンテーション (4)
ParallelAxisPlot[{IconizedObject[«one»], IconizedObject[«two»], IconizedObject[«three»]}]ParallelAxisPlot[{IconizedObject[«one»], IconizedObject[«two»], IconizedObject[«three»]}, PlotStyle -> {RGBColor[0.8, 0.1, 0.1], Darker@Green, Hue[0.7]}]コントラストがはっきりした背景で線にスタイルがあるテーマを使う:
ParallelAxisPlot[{IconizedObject[«one»], IconizedObject[«two»], IconizedObject[«three»]}, PlotTheme -> "Marketing"]ParallelAxisPlot[{IconizedObject[«one»], IconizedObject[«two»], IconizedObject[«three»]}, PlotLegends -> Automatic]オプション (17)
AspectRatio (1)
デフォルトで,ParallelAxisPlotはプロットに固定の縦横比を使う:
data = RandomChoice[Range[10], {5, 5}];ParallelAxisPlot[data]AspectRatio1として高さと幅を等しくする:
ParallelAxisPlot[data, AspectRatio -> 1]AspectRatioAutomaticとするプロット範囲から縦横比が決められる:
ParallelAxisPlot[data, AspectRatio -> Automatic]AspectRatioFullとすると,他の構造物内にぴったり納まるように高さと幅が調整される:
plot = ParallelAxisPlot[data, AspectRatio -> Full];{Framed[Pane[plot, {75, 100}]], Framed[Pane[plot, {150, 150}]], Framed[Pane[plot, {100, 75}]]}Axes (4)
ParallelAxisPlot[RandomInteger[10, {4, 5}]]ParallelAxisPlot[RandomInteger[10, {4, 5}], Axes -> False]ParallelAxisPlot[RandomInteger[10, {4, 5}], Axes -> {1 | 3 | 5 -> True, _ -> False}]ParallelAxisPlot[RandomInteger[10, {4, 5}], Axes -> {(_ ? OddQ | 4) -> True, _ -> False}]AxesLabel (2)
ParallelAxisPlot[RandomInteger[10, {4, 5}], AxesLabel -> Table[Row[{"Axis ", i}], {i, 5}]]AxesLabelは自動的に単位をラベルとして使う:
ParallelAxisPlot[{Quantity[Range[6], "Meters"], Quantity[Range[6], "Yards"], Quantity[Range[6], "Feet"]},
	PlotRange -> Automatic]
AxesStyle (3)
ParallelAxisPlot[RandomInteger[10, {4, 5}], PlotRange -> {0, 10}, AxesStyle -> Red]ParallelAxisPlot[RandomInteger[10, {4, 5}], PlotRange -> {0, 10}, AxesStyle -> {Blue, Red, Green, Purple, Orange}]ParallelAxisPlot[RandomInteger[10, {4, 5}], PlotRange -> {0, 10}, AxesStyle -> (3 -> Red)]ColorFunction (1)
data = Table[Transpose[Table[Sort@RandomReal[NormalDistribution[u, 2], 10], {u, RandomReal[20, 6]}]], 2];ParallelAxisPlot[data, ColorFunction -> "Rainbow"]ParallelAxisPlot[data, ColorFunction -> (ColorData["Rainbow", #4]&)]ColorFunctionScaling (1)
data = RandomReal[NormalDistribution[1 / 2, 1], {40, 5}];ColorData["Rainbow", "Range"]ParallelAxisPlot[data, ColorFunction -> "Rainbow"]ParallelAxisPlot[data, ColorFunctionScaling -> False, ColorFunction -> "Rainbow"]PlotMarkers (3)
ParallelAxisPlot[RandomChoice[Range[10], {3, 3, 5}], PlotMarkers -> Automatic]ParallelAxisPlot[RandomChoice[Range[10], {3, 3, 5}], PlotMarkers -> {Automatic, 9}]ParallelAxisPlot[RandomChoice[Range[10], {3, 3, 5}], PlotMarkers -> {{"♠", 14}, {"♣", 14}, {"♡", 14}}]アプリケーション (3)
3つの点が互いに近くにあるかどうかを比較する.青い点は黄色と緑の点からすべての次元で離れているが,黄色と緑の点は最後の2つの次元だけが異なっている:
pdata = {RandomReal[{1, 1.2}, {1, 5}], RandomReal[{2, 2.2}, {1, 5}], Table[Join[RandomReal[{2, 2.2}, 3], RandomReal[{3, 3.2}, 2]], 1]};ParallelAxisPlot[pdata]これは,ListPlotを使って同時に2つの座標をプロットすることでも確認できる:
{ListPlot[pdata[[All, All, {1, 2}]], Rule[...]], ListPlot[pdata[[All, All, {4, 5}]], Rule[...]]}ParallelAxisPlotを使って,組込みの動的ハイライトで,いくつかの一般的な操作がどのように機能するかを可視化する:
n = 100;data = RandomReal[{0, 20}, n];ParallelAxisPlot[Transpose[{data, Sort@data, -Sort@data, 2Sort@data, 2Sort@data + 15, Exp[Sort@data], 1 / Sort[data]}], ColorFunction -> (ColorData["Rainbow"][#2]&), AxesLabel -> {"random(x)", "x", "-x", "a*x", "a*x+b", "SuperscriptBox[e, x]", "1/x"}, ImageSize -> 400]ParallelAxisPlotを使って多次元統計の例(Fisherのアヤメ)のデータを可視化する:
irisdata = ExampleData[{"Statistics", "FisherIris"}];Take[irisdata, 3]data = GroupBy[irisdata, Last -> Most];axeslabels = ExampleData[{"Statistics", "FisherIris"}, "ColumnHeadings"]ParallelAxisPlotでプロットする:
ParallelAxisPlot[data, PlotLegends -> Automatic, AxesLabel -> axeslabels, ImageSize -> Medium]データの中央値と25%と75%の分位点を求め,太線および破線で表示する:
newdata = Join[
	(*data*)
	#,
	(*medium line*)
	{Style[Median@#, Directive[Opacity[1], Thickness[0.01]]]},
	(*quantile lines*)
	Style[#, Directive[Opacity[1], Dashed, Thickness[0.005]]]& /@ Transpose@Quantile[#, {0.25, 0.75}]
]& /@ data;ParallelAxisPlot[newdata, PlotLegends -> LineLegend[97, Keys[newdata]], PlotStyle -> Opacity[0.2], AxesLabel -> axeslabels, ImageSize -> Medium]特性と関係 (3)
ParallelAxisPlotは,多次元の点を複数の平行軸上にプロットする:
ParallelAxisPlot[{{1, 1, 1, 1, 1}, {1, 2, 3, 4, 5}, {5, 5, 5, 5, 5}}]ListPlotとListLinePlotは,複数の点を2つの垂直軸上にプロットする:
{ListPlot[{{1, 1, 1, 1, 1}, {1, 2, 3, 4, 5}, {5, 5, 5, 5, 5}}], ListLinePlot[{{1, 1, 1, 1, 1}, {1, 2, 3, 4, 5}, {5, 5, 5, 5, 5}}]}RadialAxisPlotは多次元の点を,原点に共有の点がある複数の軸上にプロットする:
{ParallelAxisPlot[{{1, 1, 1, 1, 1}, {1, 2, 3, 4, 5}, {5, 5, 5, 5, 5}}], RadialAxisPlot[{{1, 1, 1, 1, 1}, {1, 2, 3, 4, 5}, {5, 5, 5, 5, 5}}]}ParallelAxisPlotは,一次元の点についてはNumberLinePlotに似ている:
{ParallelAxisPlot[{{1}, {2}, {3}}, PlotStyle -> Red], NumberLinePlot[{{1}, {2}, {3}}, PlotStyle -> Red]}テキスト
Wolfram Research (2020), ParallelAxisPlot, Wolfram言語関数, https://reference.wolfram.com/language/ref/ParallelAxisPlot.html (2025年に更新).
CMS
Wolfram Language. 2020. "ParallelAxisPlot." Wolfram Language & System Documentation Center. Wolfram Research. Last Modified 2025. https://reference.wolfram.com/language/ref/ParallelAxisPlot.html.
APA
Wolfram Language. (2020). ParallelAxisPlot. Wolfram Language & System Documentation Center. Retrieved from https://reference.wolfram.com/language/ref/ParallelAxisPlot.html