NearestNeighborG[pdata,r]
点データ pdata 内の半径 r にある最近傍関数  を推定する.
NearestNeighborG[pproc,r]
点過程 pproc について  を計算する.
NearestNeighborG[bdata,r]
ビン分割データ bdata について  を計算する.
NearestNeighborG[pspec]
異なる半径 r に繰り返し適用可能な関数  を生成する.


NearestNeighborG
NearestNeighborG[pdata,r]
点データ pdata 内の半径 r にある最近傍関数  を推定する.
NearestNeighborG[pproc,r]
点過程 pproc について  を計算する.
NearestNeighborG[bdata,r]
ビン分割データ bdata について  を計算する.
NearestNeighborG[pspec]
異なる半径 r に繰り返し適用可能な関数  を生成する.
詳細とオプション
- NearestNeighborGは,最近傍関数および最近傍分布としても知られている.
- 関数
 は,pdata または pproc のどちらかの中で,典型的な点の距離
 内で別の点が見付かる確率を与える.
-
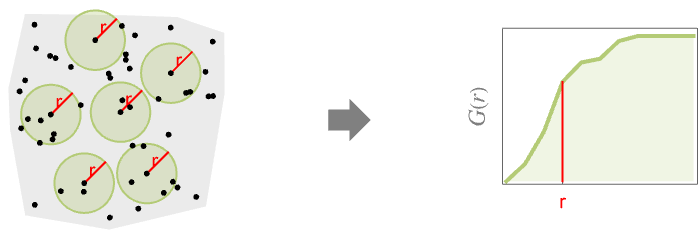
- ポアソン(Poisson)点過程と比較すると,結果は以下のようになる.
-
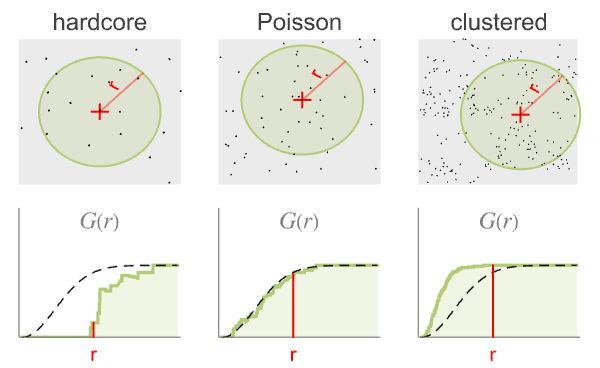
- 半径 r は単一の値でも値のリストでもよい.半径 r が指定されていないと,NearestNeighborGはPointStatisticFunctionを返す.これを使って
 関数を繰り返し評価することができる.
- 点 pdata は次の形式でよい.
-
{p1,p2,…} 点 pi GeoPosition[…],GeoPositionXYZ[…],… グラフィックスの点 SpatialPointData[…] 空間点の集合 {pts,reg} 点集合 pts と観測領域 reg - 観測領域 reg は,与えられていなければRipleyRassonRegionを使って自動的に計算される.
- 点過程 pproc は次の形式でよい.
-
proc 点過程 proc {proc,reg} 点過程 proc と観測領域 reg - 観測領域 reg は,パラメータを持たずSpatialObservationRegionQでなければならない.
- ビン分割データ bdata はSpatialBinnedPointDataからのもので,区分定強度関数でInhomogeneousPoissonPointProcessとして扱われる.
- pdata について,
 は観測領域を離散化することで計算され,一定の点強度を仮定している.
- pproc について,
 は厳密な式で,あるいはシミュレーションを使って点データを生成して計算される.
- 次は,使用可能なオプションである.
-
Method Automatic 使用するメソッド SpatialBoundaryCorrection Automatic 使用する境界補正 - SpatialBoundaryCorrectionには次の設定を使うことができる.
-
Automatic 自動決定された境界補正 None 境界補正なし "BorderMargin" 観測領域に内部余白を使う "Hanisch" 最近傍までの距離が境界までの距離よりも大きい点を削除する "KaplanMeier" SurvivalDistribution法.最近傍までの点距離が境界領域で打ち切られる "NelsonAalen" SurvivalDistribution法.最近傍までの点距離が領域境界で打ち切られる - Method->{"Discretization"->opts}の設定では推定における離散化メソッドが調整される.ここでは,opts はDiscretizeRegionの任意の有効なオプションでよい.
例題
すべて開く すべて閉じる例 (3)
region = Ball[{0, 0}];
pts = RandomPoint[region, 100];NearestNeighborG[{pts, region}, 0.1]spd = SpatialPointData[RandomReal[1, {100, 2}]]rspec = Range[0.01, 0.2, 0.01];est = NearestNeighborG[spd, rspec];結果をListPlotで可視化する:
ListPlot[est, DataRange -> MinMax[rspec], AxesLabel -> {r}, Filling -> Axis]f = NearestNeighborG[MaternPointProcess[3, 2, 0.2, 2], r];Plot[f, {r, 0, 0.5}, AxesLabel -> Automatic]スコープ (8)
点データ (5)
region = Rectangle[{0, 0}, {1, 2}];
pts = RandomPoint[region, 100];NearestNeighborG[{pts, region}, 0.1]与えられた距離のリストについて最近傍関数の経験的推定を得る:
NearestNeighborG[{pts, region}, {0.1, 0.15, 0.01, 0.03}]NearestNeighborGをSpatialPointDataと一緒に使う:
spd = SpatialPointData[RandomReal[1, {500, 3}]]res = NearestNeighborG[spd, {0.01, 0.02}]後で使うためにPointStatisticFunctionを作成する:
reg = Disk[];
pts = RandomPoint[Disk[], 100];psf = NearestNeighborG[{pts, reg}]psf[0.02]BlockRandom[SeedRandom[1];
pts = RandomReal[1, {100, 2}]
];psf = NearestNeighborG[pts]psf["ObservationRegion"]
psf[0.05]NearestNeighborGをGeoPositionと一緒に使う:
pts = RandomGeoPosition[GeoDisk[GeoPosition[{0, 0}], Quantity[10, "Kilometers"]], 10 ^ 2]psf = NearestNeighborG[pts]ListPlot[Table[{x, psf[x]}, {x, Quantity[0, "km"], psf["MaxRadius"], Quantity[.1, "km"]}], AxesLabel -> {"km"}]点過程 (3)
PoissonPointProcessの最近傍関数は閉じた形をしている:
proc = PoissonPointProcess[μ, d];NearestNeighborG[proc, r]Plot[Table[NearestNeighborG[proc /. μ -> 2, r], {d, 1, 4}]//Evaluate, {r, 0, 1.3}, AxesLabel -> Automatic, PlotLegends -> (Row[{#, "D"}]& /@ Range[4])]指定次元のクラスタ過程ThomasPointProcessの最近傍関数:
proc2D = ThomasPointProcess[20, 10, .05, 2];DiscretePlot[NearestNeighborG[proc2D, r], {r, 0.01, .5, .02}, PlotRange -> {0, 1}, AxesLabel -> Automatic]proc3D = ThomasPointProcess[20, 10, .05, 3];DiscretePlot[NearestNeighborG[proc3D, r], {r, 0.01, .5, .02}, PlotRange -> {0, 1}, AxesLabel -> Automatic]指定次元のクラスタ過程MaternPointProcessの最近傍関数:
proc2D = MaternPointProcess[30, 5, 1, 2];DiscretePlot[NearestNeighborG[proc2D, r], {r, 0.01, .5, .02}, PlotRange -> {0, 1}, AxesLabel -> Automatic]proc3D = MaternPointProcess[30, 5, 1, 3];DiscretePlot[NearestNeighborG[proc3D, r], {r, 0.01, .5, .02}, PlotRange -> {0, 1}, AxesLabel -> Automatic]オプション (2)
SpatialBoundaryCorrection (2)
境界補正がないNearestNeighborG推定器には偏りがあるので,大きい点集合以外で使うべきではない:
region = Rectangle[{0, 0}, {1, 2}];
pts = RandomPoint[region, 100];NearestNeighborG[{pts, region}, 0.1, SpatialBoundaryCorrection -> "None"]デフォルトメソッドの"BorderMargin"は境界から  の距離にある点だけを考慮する:
NearestNeighborG[{pts, region}, 0.1, SpatialBoundaryCorrection -> "BorderMargin"]"Hanisch"法は観測領域の各点に重みを付けて推定した値が偏らないようにする:
NearestNeighborG[{pts, region}, 0.1, SpatialBoundaryCorrection -> "Hanisch"]"KaplanMeier"法と"NelsonAalen"法はSurvivalDistributionで使われる推定器である.各点からその点の最近傍点までの距離は各点から観測領域の境界までの距離によって打ち切られる:
NearestNeighborG[{pts, region}, 0.1, SpatialBoundaryCorrection -> "KaplanMeier"]NearestNeighborG[{pts, region}, 0.1, SpatialBoundaryCorrection -> "NelsonAalen"]region = Ball[{0, 0, 0}];
pts = RandomPoint[region, 400];rlist = Range[0.01, 0.3, 0.01];
mths = {"BorderMargin", "Hanisch", "KaplanMeier"};data = NearestNeighborG[{pts, region}, rlist, SpatialBoundaryCorrection -> #]& /@ mths;f[r_] := 1 - Exp[-(400 / RegionMeasure[region])(4Pi / 3)r ^ 3];Show[Plot[f[r], {r, 0, 0.3}, PlotStyle -> Gray, PlotLegends -> {"theoretical"}], ListPlot[data, DataRange -> MinMax[rlist], PlotLegends -> mths], AxesLabel -> {r}]アプリケーション (5)
data1 = RandomPointConfiguration[PoissonPointProcess[50, 2], Disk[]];
data2 = RandomPointConfiguration[InhomogeneousPoissonPointProcess[Function[{x, y}, (40x ^ 2 + 80y ^ 2)], 2], Disk[]];G1 = NearestNeighborG[data1];
G2 = NearestNeighborG[data2];Plot[{G1[r], G2[r]}, {r, 0, 1 / 2}, PlotRange -> All, AxesLabel -> {r}]rr = {0.05, 0.1, 0.15};
spds = Table[RandomPointConfiguration[HardcorePointProcess[100, rad, 2], Disk[]], {rad, rr}];Gs = Table[NearestNeighborG[spd], {spd, spds}];DiscretePlot[Map[#[r]&, Gs]//Evaluate, {r, 0.005, 0.2, 0.005}, AxesLabel -> {r}, PlotLegends -> (Row[{"rad = ", #}]& /@ rr)]ランシング(Lansing)の森でリスが木から木へと跳び移る際の平均距離はNearestNeighborGを使って計算できる:
data = ResourceData["Sample Data: Lansing Woods"]nnG = NearestNeighborG[data];
maxR = nnG["MaxRadius"];DiscretePlot[nnG[r], {r, maxR / 100, maxR, maxR / 50}]典型的な点とその最近傍点との平均距離(正のサポート分布の場合は1-累積分布関数のリーマン和で近似可能):
step = maxR / 100;
partition = Table[{k, k + step}, {k, 0, maxR, step}];
values = nnG[Mean /@ partition];Total[(1 - values) * step]場所の集合を結ぶのに必要なケーブルの最短の長さの平均を計算する:
near𝒟 = ProbabilityDistribution[{CDF, NearestNeighborG[PoissonPointProcess[3, 2], r]}, {r, 0, ∞}]count𝒟 = PointCountDistribution[PoissonPointProcess[3, 2], Rectangle[]]cable𝒟 = TransformedDistribution[(n - 1) * r, {rnear𝒟, ncount𝒟}]Mean[cable𝒟]region = Entity["AdministrativeDivision", {"California", "UnitedStates"}]["Polygon"];es = EarthquakeData[region, 5, {{1600, 1, 1}, {2017, 1, 1}}, "Position"]data = Normal[es["Values"]];GeoGraphics[{Orange, region, Darker@Red, Point[data]}]歴史的な地震発生地から10マイル以内で別の地震が起こる確率:
NearestNeighborG[{data, region}, Quantity[10, "Miles"]]Plot[NearestNeighborG[{data, region}, Quantity[r, "Miles"]], {r, 1, 10}, PlotPoints -> 2, AxesLabel -> {r}]特性と関係 (2)
NearestNeighborGはしばしばEmptySpaceFと比較されるが,後者は参照点から距離 r 以内で別の点が見付かる確率を推定する:
region = Ball[{0, 0}];
spd = RandomPointConfiguration[PoissonPointProcess[100, 2], region]rspec = Range[0, 0.15, 0.005];
res = EmptySpaceF[spd, rspec];EmptySpaceFは適切なCDFである:
ListPlot[res, DataRange -> MinMax[rspec], Filling -> Axis, AxesLabel -> {r}]HardcorePointProcessによって生成された点データについてのNearestNeighborGとEmptySpaceFの間の推定を比較する:
spd1 = RandomPointConfiguration[HardcorePointProcess[500, 0.15, 2], region]rspec1 = Range[0, 0.3, 0.01];
esf = EmptySpaceF[spd1, rspec1];
nng = NearestNeighborG[spd1, rspec1];ListLinePlot[{esf, nng}, DataRange -> MinMax[rspec1], Filling -> Axis, AxesLabel -> {r}, PlotLegends -> {"Empty Space Distribution", "Nearest Neighbor Distribution"}]PoissonPointProcessの空空間関数と最近傍関数は同じである:
proc = PoissonPointProcess[μ, d];EmptySpaceF[proc, r]NearestNeighborG[proc, r]%% - %どちらもExponentialDistributionの累積密度分布に等しい:
Clear[vol];
vol[d_, r_] := π ^ (d / 2) / Gamma[1 + d / 2]r ^ d;CDF[ExponentialDistribution[μ * vol[d, r] / r], r]% == EmptySpaceF[proc, r] == NearestNeighborG[proc, r]//Refine[#, r > 0]&テキスト
Wolfram Research (2020), NearestNeighborG, Wolfram言語関数, https://reference.wolfram.com/language/ref/NearestNeighborG.html.
CMS
Wolfram Language. 2020. "NearestNeighborG." Wolfram Language & System Documentation Center. Wolfram Research. https://reference.wolfram.com/language/ref/NearestNeighborG.html.
APA
Wolfram Language. (2020). NearestNeighborG. Wolfram Language & System Documentation Center. Retrieved from https://reference.wolfram.com/language/ref/NearestNeighborG.html