



SectorChart
SectorChart[{{x1,y1},{x1,y2},…}]
制作一个扇形图表,其扇形角和 xi 成比例,并且有半径 yi.
SectorChart[{…,wi[{xi,yi},…],…,wj[{xj,yj},…],…}]
制作一个扇形图表,其扇形特性由符号封装 wk 定义.
SectorChart[{data1,data2,…}]
绘制多个数据集 datai 的一个扇形图表.
更多信息和选项
- SectorChart 的数据元素可以给出下列形式:
-
{xi,yi} 扇形角和半径 {Quantity[xi,ux],Quantity[yi,uy]} 具有单位的扇区角度和半径 wi[{xi,yi},…] 大小 {xi,yi} 和封装 wi 的扇形 formi->mi 有元数据 mi 的一个扇形 - 没有按这些形式给出的数据在扇形图表的形成过程中被忽略.
- SectorChart 中的数据集可以给出下列形式:
-
{e1,e2,…} 有或无包装的元素列表 <k1e1,k2e2,…> 键和长度的相关性 TimeSeries[…],EventSeries[…],TemporalData[…] 时间序列、活动序列和时间数据 WeightedData[…] 具有权值的数据集 w[{e1,e2,…},…] 包装应用于整个数据集 w[{data1,data1,…},…] 包装应用于所有数据集 - SectorChart[objcspec] 用列指定 cspec 从 Tabular、TimeSeries 或 EventSeries 对象 obj 中提取值并绘制.
- 可使用以下形式的列指定 cspec 来绘制表格数据:
-
{colx,coly} 绘制列 y 与列 x {{colx1,coly1},{colx2,coly2},…} 绘制列 y1 与列 x1,y2 与 x2、… - 下列包装可以用于图表元素:
-
Annotation[e,label] 提供一个注解 Button[e,action] 当点击元素时,执行的行为 Callout[e,label] 用标注 (callout) 显示元素 EventHandler[e,…] 定义元素的普通事件处理 Hyperlink[e,uri] 使得元素作为一个超链接 Labeled[e,…] 用标签显示元素 Legended[e,…] 在一个图例中元素的特例 Mouseover[e,over] 使得元素显示为一个鼠标指向的形式 PopupWindow[e,cont] 元素增加一个弹出窗口 StatusArea[e,label] 当鼠标指向时,在状态栏上显示 Style[e,opts] 用指定的样式显示元素 Tooltip[e,label] 为元素增加一个提示工具 - 在 SectorChart 中, Labeled, Callout 和 Placed 允许使用下列名称位置:
-
"RadialOuter","RadialCenter","RadialInner" 扇形内的位置 "RadialOutside","RadialInside","RadialEdge" 扇形外的位置 "RadialCallout" 标注线的位置 {{sθ,sr},{lx,ly}} 缩放标签中坐标 {lx,ly} 到扇形中极坐标 {sθ,sr} - 在 SectorChart 中,Callout 允许使用下列位置 pos:
-
Automatic 自动放置 {x,y} 图形中的位置 Scaled[{sθ,sr}] 扇形中缩放过的极坐标位置 {sθ,sr} {pos,{lx,ly}} 位置 pos 处的标签中缩放过的位置 {lx,ly} - SectorChart 有和 Graphics 相同的选项,并增加下列变化: [所有选项的列表]
-
ChartElementFunction Automatic 如何产生扇形的原图形 ColorFunction Automatic 如何着色扇形 ColorFunctionScaling True 是否归一化传递给 ColorFunction 的参数 LabelingFunction Automatic 如何标注扇形 LabelingSize Automatic 标注和标签的最大尺寸 LegendAppearance Automatic 图例的整体外观 PerformanceGoal $PerformanceGoal 优化的目标 PlotInteractivity $PlotInteractivity 是否允许绘制互动元素 PlotLabels None 扇区的分类标签 PlotLayout Automatic 使用的整体布局 PlotLegends None 数据元素和数据集的图例 PlotRange Automatic 包含值的范围 PlotStyle Automatic 扇区的样式 PlotTheme $PlotTheme 图表的整体主题 PolarAxes False 是否绘制极轴 PolarAxesOrigin Automatic 在哪里绘制极轴 PolarGridLines None 极坐标网格线 PolarTicks Automatic 极轴刻度 SectorOrigin Automatic 初始角度和扇形弧度 SectorSpacing Automatic 扇形间的间距 TargetUnits Automatic 图表中显示的单位 - 在单个显示平板中包括多个数据组的 PlotLayout 可能设置包括:
-

"Grouped" 分离每个数据集的数据 
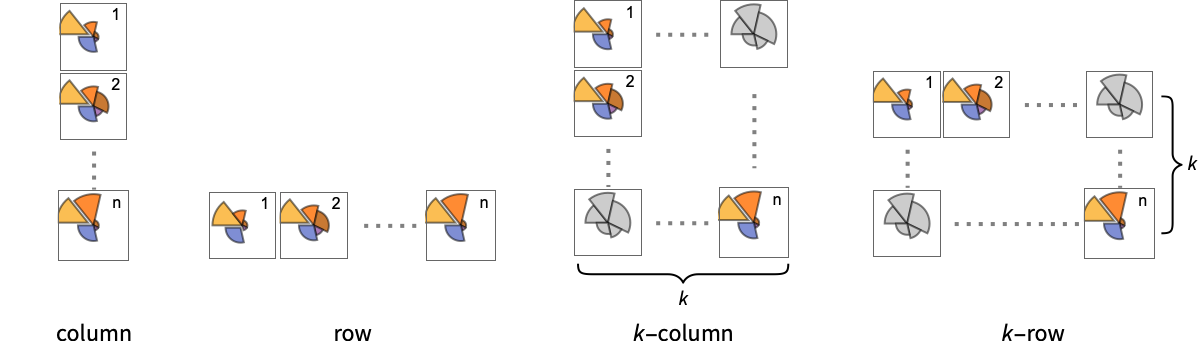
"Stacked" 累积每个数据集的数据 - 在不同面板中显示单个数据组的 ChartLayout 的可能设置包括:
-
"Column" 在一列面板中分别使用不同扇区组 "Row" 在一行面板中分别使用不同扇区组 {"Column",k},{"Row",k} 使用 k 列或行 {"Column",UpTo[k]},{"Row",UpTo[k]} 使用至多 k 列或行 - PlotLegends 的常见设置包括:
-
None 没有图例 Automatic 自动确定图例 {lbl1,lbl2,…} 用 lbl1、lbl2、… 作为图例的标签 Placed[lspec,…] 指定图例的放置 - PlotStylesty 指定每组数据使用的样式. 可能的设置包括:
-
{sty1,sty2,…} 针对各组数据的一系列样式 <"key"val,…> 针对不同层级的数据的样式元素 - 接受的键有:
-
"Base" 所有扇区的整体样式 "Elements" 针对每组数据中的元素 yi 的样式列表 "Groups" 针对每组数值 datai 的样式列表 - ColorData["DefaultChartColors"] 给出 PlotStyle 使用的默认颜色序列.
- ChartElementFunction 的参数是扇形区域 {{θmin,θmax},{rmin,rmax}},值 {xi,yi} 和数据集的嵌套列表中每层的元数据 {m1,m2,…}.
- ChartElementFunction 的内置列表可以从 ChartElementData["SectorChart"] 得到.
- ColorFunction 的参数是 θ 和 r,θ 是扇形的角度,r 是半径.
- SectorChart 中选项和其它结构的样式和其它设置按照 PlotStyle、ColorFunction、Style 和 和其他包装和 ChartElementFunction,后面的设置会屏蔽之前的设置.
所有选项的列表
范例
打开所有单元 关闭所有单元基本范例 (4)
SectorChart[{{1, 1}, {1, 2}, {1, 3}}]SectorChart[{{1, 1}, {1, 2}, {1, 3}}, SectorOrigin -> {Automatic, 1}]SectorChart[{{{1, 1}, {1, 2}, {1, 3}}, {{7, 3}, {5, 2}, {1, 1}}}]SectorChart[{{{1, 1}, {1, 2}, {1, 3}}, {{7, 3}, {5, 2}, {1, 1}}}, ChartLayout -> "Row"]SectorChart[{{1, 1}, {1, 2}, {1, 3}}, PlotLabels -> {"a", "b", "c"}]SectorChart[{{1, 1}, {1, 2}, {1, 3}}, PlotLegends -> {"a", "b", "c"}]范围 (32)
数据和布局 (13)
SectorChart[{{{1, 1}, {1, 2}, {1, 3}}, {{2, 1}, {2, 2}, {2, 3}}, {{3, 1}, {3, 2}, {3, 3}}}]SectorChart[{{{1, 2}, {2, 3}}, {{1, 1}, {2, 2}, {3, 3}}, {{1, 1}, {2, 2}, {3, 3}, {4, 4}}}]SectorChart[{{{1, 2}, {2, 3}}, {{1, 1}, {2, Missing[]}, {3, 3}}, {{1, 1}, {2, 2}, {foo, 3}, {4, 4}}}]SectorChart[{{Quantity[1, "Seconds"], Quantity[2, "Meters"]}, {Quantity[1, "Seconds"], Quantity[3, "Meters"]}, {Quantity[2, "Seconds"], Quantity[5, "Meters"]}, {Quantity[3, "Seconds"], Quantity[7, "Meters"]}, {Quantity[5, "Seconds"], Quantity[11, "Meters"]}}]忽略 TimeSeries、EventSeries 和 TemporalData 中的时间戳:
SectorChart[TimeSeries[{{19, 16}, {9, 3}, {7, 2}, {17, 5}}, {"May 24, 1982"}]]SectorChart[<|"a" -> {2, 3}, "b" -> {4, 6}, "c" -> {5, 8}, "d" -> {3, 7}|>]SectorChart[<|"a" -> {2, 3}, "b" -> {4, 6}, "c" -> {5, 8}, "d" -> {3, 7}|>, PlotLabels -> Placed[Automatic, "RadialCallout"]]SectorChart[<|"a" -> {2, 3}, "b" -> {4, 6}, "c" -> {5, 8}, "d" -> {3, 7}|>, PlotLabels -> Callout[Automatic]]SectorChart[<|"a" -> {2, 3}, "b" -> {4, 6}, "c" -> {5, 8}, "d" -> {3, 7}|>, PlotStyle -> {Hue[0.61, 0.7, 1], Hue[0.17, 0.4, 0.65], Hue[0.64, 0.5, 0.75], Hue[0.45, 0.4, 0.7]}, PlotLegends -> Automatic]SectorChart[<|"group a" -> <|"a" -> {1, 1}, "b" -> {2, 3}, "c" -> {5, 8}, "d" -> {3, 7}|>, "group b" -> <|"a" -> {1, 1}, "b" -> {3, 2}, "c" -> {5, 3}, "d" -> {7, 2}|>|>, PlotLegends -> Automatic]忽略 WeightedData 中的权值:
SectorChart[WeightedData[{{1, 2}, {3, 4}, {5, 6}}, {0.5, 0.2, 0.1}]]Table[SectorChart[RandomInteger[{1, 4}, {2, 10, 2}], ChartLayout -> l], {l, {"Grouped", "Stacked"}}]SectorChart[{IconizedObject[«data #1»], IconizedObject[«data #2»], IconizedObject[«data #3»]}, ImageSize -> Medium, ChartLayout -> "Row"]SectorChart[{IconizedObject[«data #1»], IconizedObject[«data #2»], IconizedObject[«data #3»]}, ImageSize -> Medium, ChartLayout -> "Column"]SectorChart[{IconizedObject[«data #1»], IconizedObject[«data #2»], IconizedObject[«data #3»], IconizedObject[«data #4»]}, ImageSize -> Medium, ChartLayout -> {"Row", 2}]Table[SectorChart[{{1, 1}, {1, 2}, {2, 3}, {3, 2}}, SectorOrigin -> o, PlotLabel -> o], {o, {{Pi / 6, "Clockwise"}, {Pi / 6, "Counterclockwise"}}}]Table[SectorChart[{{1, 1}, {1, 2}, {2, 3}, {3, 2}}, SectorOrigin -> o, PlotLabel -> o], {o, {0, Pi / 2}}]Table[SectorChart[{{1, 1}, {1, 2}, {2, 3}, {3, 2}}, SectorOrigin -> o, PlotLabel -> o], {o, {{{0, "Clockwise"}, 0}, {{0, "Clockwise"}, 1}}}]Table[SectorChart[{{{2, 1}, {3, 4}, {4, 2}, {3, 4}}, {{2, 2}, {2, 3}, {3, 2}, {4, 3}}}, SectorSpacing -> s, PlotLabel -> s], {s, {Automatic, {0, 1}, {0.1, 1}}}]表格数据 (3)
tabdata = AggregateRows[Tabular[ResourceData["Sample Data: 1993 US Cars"]], {"AvgPrice" -> (Mean[#AvgPrice]&), "TotalCars" -> (Length[#AvgPrice]&), "AvgWeight" -> (Mean[#Weight]&), "AvgFuelTankCap" -> (Mean[#FuelTankCapacity]&)}, {"Type"}]SectorChart[tabdata -> {"TotalCars", "AvgPrice"}, PlotLabels -> Normal[tabdata[All, "Type"]]]绘制 TimeSeries 或 EventSeries 中所有分量的值:
SectorChart[TimeSeries[TimeEventSeries`TimestampData[Association["UniformlySpacedQ" -> True, "Count" -> 5,
   "Endpoints" -> TabularColumn[Association[
      "Data" -> {2, {{NumericArray[{20563, -2147483648}, "Integer32"], {},
          DataStructure["BitVec ... {{TabularColumn[Association["Data" -> {{1, 3, 5, 7, 8}, {}, None},
           "ElementType" -> "Integer64"]], TabularColumn[Association[
           "Data" -> {{13, 17, 18, 19, 19}, {}, None}, "ElementType" -> "Integer64"]]}}]]]],
 Association[]]]
绘制 TimeSeries 或 EventSeries 中一对分量的值:
ts = TimeSeries[TimeEventSeries`TimestampData[Association["UniformlySpacedQ" -> True, "Count" -> 5,
   "Endpoints" -> TabularColumn[Association[
      "Data" -> {2, {{NumericArray[{20563, -2147483648}, "Integer32"], {},
          DataStructure["BitVec ... olumn[Association[
           "Data" -> {{10, 10, 14, 16, 18}, {}, None}, "ElementType" -> "Integer64"]],
         TabularColumn[Association["Data" -> {{13, 10, 6, 6, 6}, {}, None},
"ElementType" -> "Integer64"]]}}]]]], Association[]];SectorChart[ts -> {"a", "b"}]SectorChart[ts -> {{"a", "b"}, {"a", "c"}}]封装 (4)
{{d1, d2, d3, d4}, {w1, w2, w3, w4}} = {{{2, 1}, {3, 4}, {4, 2}, {3, 4}}, {{2, 2}, {2, 3}, {3, 2}, {4, 3}}};{SectorChart[{{d1, Style[d2, RGBColor[0.93, 0.27, 0.27]], d3, d4}, {w1, w2, w3, w4}}], SectorChart[{Style[{d1, d2, d3, d4}, RGBColor[0.14, 0.8, 0.14]], {w1, w2, w3, w4}}], SectorChart[Style[{{d1, d2, d3, d4}, {w1, w2, w3, w4}}, RGBColor[0.4, 0.6, 1]]]}{SectorChart[{{d1, Style[d2, RGBColor[0.93, 0.27, 0.27]], d3, d4}, {w1, w2, w3, w4}}], SectorChart[{Style[{d1, Style[d2, RGBColor[0.93, 0.27, 0.27]], d3, d4}, RGBColor[0.14, 0.8, 0.14]], {w1, w2, w3, w4}}], SectorChart[Style[{Style[{d1, Style[d2, RGBColor[0.93, 0.27, 0.27]], d3, d4}, RGBColor[0.14, 0.8, 0.14]], {w1, w2, w3, w4}}, RGBColor[0.4, 0.6, 1]]]}SectorChart[{{1, 3}, {2, 1}, Tooltip[{3, 3}, "median"], {4, 2}}]SectorChart[Table[Tooltip[{QuantityMagnitude@CountryData[c, "Population"], QuantityMagnitude@CountryData[c, "LifeExpectancy"]}, CountryData[c, "Flag"]], {c, CountryData["G8"]}]]用 PopupWindow 提供其它深层的信息:
SectorChart[{{1, 3}, {2, 1}, PopupWindow[{3, 3}, DateListPlot[FinancialData["IBM", "Jan. 1, 2004"]]], {4, 2}}]Button 可以用于触发任何操作:
SectorChart[{{1, 3}, {2, 1}, Button[{3, 3}, Speak[3]], {4, 2}}]样式和外观 (5)
SectorChart[{{1, 3}, {2, 1}, {3, 3}, {4, 2}}, PlotStyle -> {RGBColor[0.93, 0.27, 0.27], RGBColor[0.14, 0.8, 0.14], RGBColor[0.4, 0.6, 1], RGBColor[1, 0.75, 0]}]{SectorChart[{{1, 3}, {2, 1}, {3, 3}, {4, 2}}, PlotTheme -> "Web"], SectorChart[{{1, 3}, {2, 1}, {3, 3}, {4, 2}}, PlotTheme -> "Marketing"], SectorChart[{{1, 3}, {2, 1}, {3, 3}, {4, 2}}, PlotTheme -> "Monochrome"]}ChartElementData["SectorChart"]Table[SectorChart[{{1, 3}, {2, 1}, {3, 3}, {4, 2}}, ChartElementFunction -> f, PlotStyle -> {RGBColor[0.761959, 0.470832, 0.940597], RGBColor[0.927848, 0.742785, 0.6151383333333333], RGBColor[0.929162, 0.95034, 0.6648153333333333], RGBColor[0.431296, 0.709773, 0.927077]}], {f, {"NoiseSector", "PlateauSector"}}]SectorChart[{{1, 3}, {2, 1}, {3, 3}, {4, 2}}, ChartElementFunction -> ChartElementDataFunction["GlassSector", "GradientDirection" -> "Angular"], PlotStyle -> {RGBColor[0.468742, 0., 0.0158236], RGBColor[0.871407, 0.20684366666666665, 0.013399966666666667], RGBColor[0.9899876666666667, 0.5566463333333334, 0.06420996666666667], RGBColor[1., 0.820127, 0.126955]}]SectorChart[{{1, 3}, {2, 2}, {3, 3}, {4, 2}}, PlotTheme -> "Marketing"]SectorChart[{{{4, 9}, {7, 4}, {4, 10}, {7, 4}, {4, 9}}, {{7, 4}, {5, 7}, {9, 8}, {8, 4}, {9, 4}}}, PlotTheme -> "Monochrome"]标签和图例 (7)
使用 Labeled 对扇区添加标签:
SectorChart[{{1, 3}, {2, 1}, Labeled[{3, 3}, "label"], {4, 2}}]Table[SectorChart[{{1, 3}, {2, 1}, Labeled[{3, 3}, "label", p], {4, 2}}, PlotLabel -> p, SectorOrigin -> {Automatic, 1}], {p, {"RadialInner", "RadialCenter", "RadialOuter"}}]Table[SectorChart[{{1, 3}, {2, 1}, Labeled[{3, 3}, "label", p], {4, 2}}, PlotLabel -> p, SectorOrigin -> {Automatic, 1}], {p, {"RadialInside", "RadialOutside"}}]Table[SectorChart[{Labeled[{1, 3}, "L1", p], Labeled[{2, 1}, "L2", p], Labeled[{3, 3}, "L3", p], Labeled[{4, 2}, "L4", p]}, PlotLabel -> p], {p, {"RadialCallout", "VerticalCallout"}}]用 Callout 为扇区添加标签:
SectorChart[{{2, 1}, Callout[{2, 3}, "label"], {3, 4}}]SectorChart[{{2, 1}, Callout[{2, 3}, "label", Appearance -> "Balloon"], {3, 4}}]SectorChart[Callout[#, Unique["text"]]& /@ RandomReal[{0.3, 1}, {6, 2}]]通过使用 LabelingFunction 添加数值标签:
SectorChart[{{2, 1}, {2, 3}, {3, 4}, {4, 2}}, LabelingFunction -> "RadialOutside"]SectorChart[RandomInteger[{3, 10}, {6, 2}], LabelingFunction -> (Callout[Style[Total@#, 10 + #[[2]]], Automatic]&)]选项 (82)
AspectRatio (4)
SectorChart[{{1, 3}, {2, 1}, {3, 3}, {4, 2}}]通过 AspectRatio1 使高等和宽度相等:
SectorChart[{{1, 3}, {2, 1}, {3, 3}, {4, 2}}, AspectRatio -> 1]SectorChart[{{1, 3}, {2, 1}, {3, 3}, {4, 2}}, AspectRatio -> 1 / 2]AspectRatioFull 调整高度和宽度以便可以恰当地放在其他结构的里面:
plot = SectorChart[{{1, 3}, {2, 1}, {3, 3}, {4, 2}}, AspectRatio -> Full];{Framed[Pane[plot, {50, 100}]], Framed[Pane[plot, {100, 100}]], Framed[Pane[plot, {100, 50}]]}Axes (3)
默认情况下不绘制 Axes:
SectorChart[{{1, 3}, {2, 1}, {3, 3}, {4, 2}}]SectorChart[{{1, 3}, {2, 1}, {3, 3}, {4, 2}}, Axes -> True]{SectorChart[{{1, 3}, {2, 1}, {3, 3}, {4, 2}}, Axes -> {True, False}], SectorChart[{{1, 3}, {2, 1}, {3, 3}, {4, 2}}, Axes -> {False, True}]}AxesLabel (3)
SectorChart[{{1, 3}, {2, 1}, {3, 3}, {4, 2}}, Axes -> True]

SectorChart[{{1, 3}, {2, 1}, {3, 3}, {4, 2}}, Axes -> True, AxesLabel -> label]SectorChart[{{1, 3}, {2, 1}, {3, 3}, {4, 2}}, Axes -> True, AxesLabel -> {x, y}]AxesOrigin (2)
AxesStyle (3)
SectorChart[{{1, 3}, {2, 1}, {3, 3}, {4, 2}}, Axes -> True, AxesStyle -> RGBColor[0.93, 0.27, 0.27]]SectorChart[{{1, 3}, {2, 1}, {3, 3}, {4, 2}}, Axes -> True, AxesStyle -> {{Thick, RGBColor[0.93, 0.27, 0.27]}, {Thick, RGBColor[0.4, 0.6, 1]}}]SectorChart[{{1, 3}, {2, 1}, {3, 3}, {4, 2}}, Axes -> True, AxesStyle -> RGBColor[0.14, 0.8, 0.14], TicksStyle -> RGBColor[0.93, 0.27, 0.27]]ChartElementFunction (5)
获得 ChartElementFunction 内置的设置列表:
ChartElementData["SectorChart"]Table[SectorChart[Tuples[{1, 2}, 2], ChartElementFunction -> f, PlotStyle -> {RGBColor[0.761959, 0.470832, 0.940597], RGBColor[0.927848, 0.742785, 0.6151383333333333], RGBColor[0.929162, 0.95034, 0.6648153333333333], RGBColor[0.431296, 0.709773, 0.927077]}, PlotLabel -> f], {f, {"Sector", "PlateauSector"}}]Table[SectorChart[Tuples[{1, 2}, 2], ChartElementFunction -> f, PlotStyle -> {RGBColor[0.761959, 0.470832, 0.940597], RGBColor[0.927848, 0.742785, 0.6151383333333333], RGBColor[0.929162, 0.95034, 0.6648153333333333], RGBColor[0.431296, 0.709773, 0.927077]}, PlotLabel -> f], {f, {"NoiseSector", "OscillatingSector"}}]Table[SectorChart[Tuples[{1, 2}, 2], ChartElementFunction -> f, PlotStyle -> {RGBColor[0.761959, 0.470832, 0.940597], RGBColor[0.927848, 0.742785, 0.6151383333333333], RGBColor[0.929162, 0.95034, 0.6648153333333333], RGBColor[0.431296, 0.709773, 0.927077]}, PlotLabel -> f], {f, {"SquareWaveSector", "TriangleWaveSector"}}]Table[SectorChart[Tuples[{1, 2}, 2], ChartElementFunction -> f, PlotStyle -> {RGBColor[0.761959, 0.470832, 0.940597], RGBColor[0.927848, 0.742785, 0.6151383333333333], RGBColor[0.929162, 0.95034, 0.6648153333333333], RGBColor[0.431296, 0.709773, 0.927077]}, PlotLabel -> f], {f, {"GlassSector", "GradientSector"}}]用 ChartElementData 指定相同的图形渲染函数如上:
SectorChart[Tuples[{1, 2}, 2], ChartElementFunction -> Function[{angleRadiusMinMax, yr, meta}, ChartElementData["TriangleWaveSector"][angleRadiusMinMax, yr, meta]]]写入一个定制的 ChartElementFunction:
f[{{t0_, t1_}, {r0_, r1_}}, ___] := Disk[{0, 0}, r1, {t0, t1}]SectorChart[Tuples[{1, 2}, 2], ChartElementFunction -> f]DataDrilldownSector[{{t0_, t1_}, {r0_, r1_}}, y_, {data_List}] :=
PopupWindow[ChartElementData["NoiseSector"][{{t0, t1}, {r0, r1}}, y], BarChart[data]]DataDrilldownSector[{{t0_, t1_}, {r0_, r1_}}, y_, _] :=
ChartElementData["Sector"][{{t0, t1}, {r0, r1}}, y]SectorChart[{{1, 1} -> Range[5], {1, 2}, {2, 1} -> RandomReal[1, 10], {2, 2}}, ChartElementFunction -> DataDrilldownSector]ColorFunction (4)
SectorChart[Table[{Exp[-t ^ 2], Exp[-t ^ 2]}, {t, -2, 2, 0.25}], ColorFunction -> Function[{angle, radius}, ColorData["Rainbow"][angle]]]用 ColorFunctionScaling->False,获得未调整的角度值:
SectorChart[Tuples[{1, 2}, 2], ColorFunction -> (Switch[{#1, #2}, {1, 1}, RGBColor[1, 0.75, 0], {1, 2}, RGBColor[0.98, 0.56, 0.17], {2, 1}, RGBColor[0.93, 0.27, 0.27], _, RGBColor[0.4, 0.6, 1]]&), ColorFunctionScaling -> False]SectorChart[{{1, 1}, {1, 2}, {2, 1}, {2, 2}}, ColorFunction -> Function[{angle, radius}, ColorData["Rainbow"][angle radius / 4]], ColorFunctionScaling -> False]ColorFunction 屏蔽 PlotStyle 中的样式:
SectorChart[Tuples[{1, 2, 3}, 2], PlotStyle -> {RGBColor[0.93, 0.27, 0.27], RGBColor[0.14, 0.8, 0.14], RGBColor[0.67, 0.54, 0.42]}, ColorFunction -> "Pastel"]用 ColorFunction 组合不同样式效果:
SectorChart[Table[{Exp[-t ^ 2], Exp[-t ^ 2]}, {t, -2, 2, 0.25}], ColorFunction -> Function[{angle, radius}, Opacity[radius]], PlotStyle -> RGBColor[0.8, 0.3, 0.8]]ColorFunctionScaling (2)
用 ColorFunctionScaling->False 得到未调整的高度值:
SectorChart[Tuples[{1, 2}, 2], ColorFunction -> (Switch[{#1, #2}, {1, 1}, RGBColor[1, 0.75, 0], {1, 2}, RGBColor[0.98, 0.56, 0.17], {2, 1}, RGBColor[0.93, 0.27, 0.27], _, RGBColor[0.4, 0.6, 1]]&), ColorFunctionScaling -> False]SectorChart[{{1, 1}, {1, 2}, {2, 1}, {2, 2}}, ColorFunction -> Function[{angle, radius}, ColorData["Rainbow"][angle radius / 4]], ColorFunctionScaling -> False]Frame (4)
默认情况下,SectorChart 不显示边框:
SectorChart[{{1, 3}, {2, 1}, {3, 3}, {4, 2}}]SectorChart[{{1, 3}, {2, 1}, {3, 3}, {4, 2}}, Frame -> True]SectorChart[{{1, 3}, {2, 1}, {3, 3}, {4, 2}}, Frame -> {{True, True}, {False, False}}]SectorChart[{{1, 3}, {2, 1}, {3, 3}, {4, 2}}, Frame -> {{True, False}, {True, False}}]FrameLabel (4)
SectorChart[{{1, 3}, {2, 1}, {3, 3}, {4, 2}}, Frame -> True, FrameLabel -> {"label"}]SectorChart[{{1, 3}, {2, 1}, {3, 3}, {4, 2}}, Frame -> True, FrameLabel -> {"bottom", "left"}]SectorChart[{{1, 3}, {2, 1}, {3, 3}, {4, 2}}, Frame -> True, FrameLabel -> {{"left", "right"}, {"bottom", "top"}}]SectorChart[{{1, 3}, {2, 1}, {3, 3}, {4, 2}}, Frame -> True, FrameLabel -> {{"left", "right"}, {"bottom", "top"}}, LabelStyle -> Directive[Bold, RGBColor[0.67, 0.54, 0.42]]]FrameStyle (2)
SectorChart[{{1, 3}, {2, 1}, {3, 3}, {4, 2}}, Frame -> True, FrameStyle -> Directive[RGBColor[0.67, 0.54, 0.42], Thick]]SectorChart[{{1, 3}, {2, 1}, {3, 3}, {4, 2}}, Frame -> True, FrameStyle -> {{Directive[RGBColor[0.14, 0.8, 0.14], Thick], RGBColor[0.93, 0.27, 0.27]}, {Directive[GrayLevel[0.62], Thick], RGBColor[0.4, 0.6, 1]}}]ImageSize (7)
使用有名称尺寸 Tiny、Small、Medium 和 Large:
{SectorChart[{{1, 1}, {1, 2}, {1, 3}}, ImageSize -> Tiny], SectorChart[{{1, 1}, {1, 2}, {1, 3}}, ImageSize -> Small]}SectorChart[{{1, 1}, {1, 2}, {1, 3}}, ImageSize -> 150]SectorChart[{{1, 1}, {1, 2}, {1, 3}}, ImageSize -> {Automatic, 150}]SectorChart[{{1, 1}, {1, 2}, {1, 3}}, ImageSize -> UpTo[200]]SectorChart[{{1, 1}, {1, 2}, {1, 3}}, ImageSize -> {200, 250}, Background -> LightBlue]SectorChart[{{1, 1}, {1, 2}, {1, 3}}, ImageSize -> {UpTo[250], UpTo[200]}]chart = SectorChart[{{1, 1}, {1, 2}, {1, 3}}, ImageSize -> Full];{Framed[Pane[chart, {100, 100}]], Framed[Pane[chart, {200, 200}]]}Framed[Pane[SectorChart[{{1, 1}, {1, 2}, {1, 3}}, ImageSize -> {Scaled[0.5], Scaled[0.5]}, Background -> LightBlue], {200, 100}]]LabelingFunction (8)
Tooltip 和 StatusArea 使用自动标签:
SectorChart[{{1, 1}, {1, 2}, {2, 3}, {3, 2}}, LabelingFunction -> Automatic]SectorChart[{{1, 1}, {1, 2}, {2, 3}, {3, 2}}, LabelingFunction -> None]用 Placed 控制标签放置:
Table[SectorChart[{{1, 1}, {1, 2}, {2, 3}, {3, 2}}, LabelingFunction -> (Placed[#, p]&), PlotLabel -> p, Ticks -> None], {p, {"RadialInner", "RadialCenter", "RadialOuter"}}]Table[SectorChart[{{1, 1}, {1, 2}, {2, 3}, {3, 2}}, SectorOrigin -> {Automatic, 4}, LabelingFunction -> (Placed[#, p]&), PlotLabel -> p], {p, {"RadialInside", "RadialOutside", "RadialEdge"}}]Table[SectorChart[{{1, 1}, {1, 2}, {2, 3}, {3, 2}}, LabelingFunction -> (Placed[#, p]&), PlotLabel -> p], {p, {"RadialCallout", "VerticalCallout"}}]Table[SectorChart[{{1, 1}, {1, 2}, {2, 3}, {3, 2}}, LabelingFunction -> (Placed[#, p]&), PlotLabel -> p, SectorOrigin -> {Automatic, 2}], {p, {{0.1, 0.1}, {1 / 2, 1 / 2}, {1, 1}}}]用 Callout 自动放置标签:
SectorChart[{{1, 1}, {1, 2}, {2, 3}, {3, 2}}, LabelingFunction -> (Callout[Row[{"$", NumberForm[#[[2]], {2, 2}]}], Automatic]&)]SectorChart[{{1, 1}, {1, 2}, {2, 3}, {3, 2}}, LabelingFunction -> (Placed[Row[{"$", #[[1]]}, " "], "RadialOutside"]&)]data = {{{1, 1}, {1, 2}, {2, 3}, {3, 2}}, {{1, 1}, {2, 2}, {2, 3}}};SectorChart[data, PlotLabels -> {{"r1", "r2"}, {"c1", "c2", "c3"}}, LabelingFunction -> (Placed[Row[{#3[[1, 1]], #3[[2, 1]], #1}, ","], Tooltip]&)]LabelingSize (3)
SectorChart[{{1, 1}, {1, 2}, {2, 3}, {3, 2}}, PlotLabels -> {"healthfulness", "obstreperous", "spectrogram", "vestige"}]SectorChart[{{1, 1}, {1, 2}, {2, 3}, {3, 2}}, PlotLabels -> {[image], [image], [image], [image], [image], [image], [image]}]SectorChart[{{1, 1}, {1, 2}, {2, 3}, {3, 2}}, PlotLabels -> {"healthfulness", "obstreperous", "spectrogram", "vestige"}, LabelingSize -> 50]PlotInteractivity (4)
SectorChart[{{1, 1}, {2, 1}, {2, 2}}]SectorChart[{{1, 1}, {2, 1}, {2, 2}}, PlotInteractivity -> False]SectorChart[{{1, 1}, {2, 1}, Tooltip[{2, 2}, "Hello"]}, PlotInteractivity -> False]SectorChart[{{1, 1}, {2, 1}, Tooltip[{2, 2}, "Hello"]}, PlotInteractivity -> <|"User" -> True, "System" -> False|>]PlotLabels (8)
SectorChart[{{1, 1}, {1, 2}, {2, 3}, {3, 2}}, PlotLabels -> {"a", "b", "c", "d"}]SectorChart[{{{1, 2}, {1, 3}, {1, 2}}, {{2, 2}, {1, 1}, {3, 2}}}, PlotLabels -> {"a", "b"}]数据中的 Labeled 封装将会放置额外的标签:
SectorChart[{{1, 1}, Labeled[{1, 2}, "label", "RadialOutside"], {2, 3}, {3, 2}}, PlotLabels -> {"a", "b", "c", "d"}]用 Placed 控制标签的放置:
Table[SectorChart[{{1, 1}, {1, 2}, {2, 3}, {3, 2}}, PlotLabels -> Placed[{"a", "b", "c", "d"}, p], PlotLabel -> p], {p, {"RadialInner", "RadialCenter", "RadialOuter"}}]Table[SectorChart[{{1, 1}, {1, 2}, {2, 3}, {3, 2}}, SectorOrigin -> {Automatic, 1}, PlotLabels -> Placed[{"a", "b", "c", "d"}, p], PlotLabel -> p, Ticks -> None], {p, {"RadialInside", "RadialOutside", "RadialEdge"}}]Table[SectorChart[{{1, 1}, {1, 2}, {2, 3}, {3, 2}}, SectorOrigin -> {Automatic, 1}, PlotLabels -> Placed[{"a", "b", "c", "d"}, p], PlotLabel -> p, Ticks -> None], {p, {"RadialCallout", "VerticalCallout"}}]Table[SectorChart[{{1, 1}, {1, 2}, {2, 3}, {3, 2}}, SectorOrigin -> {Automatic, 1}, PlotLabels -> Placed[{"aa", "bb", "cc"}, p], Ticks -> None, PlotLabel -> p], {p, {{0.1, 0.1}, {1 / 2, 1 / 2}, {1, 1}}}]Table[SectorChart[{{1, 1}, {1, 2}, {2, 3}, {3, 2}}, PlotRange -> 2.8, SectorOrigin -> {Automatic, 1}, PlotLabels -> Placed[Framed /@ {"aa", "bb", "cc"}, {{1, 1}, p}], Ticks -> None, PlotLabel -> p], {p, {{0.1, 0.1}, {1 / 2, 1 / 2}, {1, 1}}}]用 Placed 的第三个参数控制格式:
SectorChart[{{1, 1}, {1, 2}, {2, 3}, {3, 2}}, PlotLabels -> Placed[{"aaa", "bbb", "ccc", "ddd"}, "RadialCenter", Rotate[#, 45Degree]&]]SectorChart[{{1, 1}, {1, 2}, {2, 3}, {3, 2}}, PlotLabels -> Placed[{"aaa", "bbb", "ccc", "ddd"}, "RadialCenter", Panel[#, FrameMargins -> 0]&]]SectorChart[{{1, 1}, {1, 2}, {2, 3}, {3, 2}}, PlotLabels -> Placed[{"aaa", "bbb", "ccc", "ddd"}, "RadialCenter", Hyperlink[#, "http://www.wolfram.com"]&]]SectorChart[{{{1, 1}, {1, 2}, {2, 3}}, {{3, 2}, {1, 2}, {2, 3}}}, PlotLabels -> {"r1", "r2"}]SectorChart[{{{1, 1}, {1, 2}, {2, 3}}, {{3, 2}, {1, 2}, {2, 3}}}, PlotLabels -> <|"Elements" -> {"c1", "c2", "c3"}|>]SectorChart[{{{1, 1}, {1, 2}, {2, 3}}, {{3, 2}, {1, 2}, {2, 3}}}, PlotLabels -> <|"Groups" -> {"r1", "r2"}, "Elements" -> {"c1", "c2", "c3"}|>]用 Placed 来改变放置的位置:
SectorChart[{{{1, 1}, {1, 2}, {2, 3}}, {{3, 2}, {1, 2}, {2, 3}}}, PlotLabels -> <|"Groups" -> Placed[{"r1", "r2"}, "VerticalCallout"], "Elements" -> Placed[{"c1", "c2", "c3"}, "RadialCenter"]|>]用 Callout 连接标签与扇区:
SectorChart[{{{1, 1}, {1, 2}, {2, 3}}, {{3, 2}, {1, 2}, {2, 3}}}, PlotLabels -> <|"Elements" -> Callout[{"c1", "c2", "c3"}, Automatic]|>]SectorChart[{{1, 1}, {1, 2}, {2, 3}}, PlotLabels -> Placed[{{"a", "b", "c"}, {"x", "y", "z"}}, {"RadialCenter", "RadialCallout"}]]PlotLayout (4)
PlotLayout 默认按同心环分组:
data = {{{1, 1}, {1, 2}, {2, 3}, {3, 2}}, {{1, 1}, {2, 2}, {2, 3}}};{SectorChart[data], SectorChart[data, PlotLayout -> "Grouped"]}data = {{{1, 1}, {1, 2}, {2, 3}, {3, 2}}, {{1, 1}, {2, 2}, {2, 3}}};SectorChart[data, PlotLayout -> "Stacked"]SectorChart[RandomReal[1, {10, 5, 2}], PlotLayout -> "Stacked"]SectorChart[{{{1, 6}, {1, 4}, {2, 7}, {1, 6}, {2, 8}}, {{1, 4}, {1, 3}, {2, 10}, {1, 6}, {2, 4}}, {{1, 8}, {1, 3}, {2, 8}, {1, 7}, {2, 6}}}, ImageSize -> Medium, PlotLayout -> "Column"]SectorChart[{{{1, 6}, {1, 4}, {2, 7}, {1, 6}, {2, 8}}, {{1, 6}, {1, 3}, {2, 10}, {1, 6}, {2, 4}}, {{1, 8}, {1, 3}, {2, 8}, {1, 7}, {2, 6}}}, ImageSize -> Medium, PlotLayout -> "Row"]SectorChart[{IconizedObject[«data #1»], IconizedObject[«data #2»], IconizedObject[«data #3»], IconizedObject[«data #4»], IconizedObject[«data #5»], IconizedObject[«data #6»]}, ImageSize -> Medium, PlotLayout -> {"Column", 4}]SectorChart[{IconizedObject[«data #1»], IconizedObject[«data #2»], IconizedObject[«data #3»], IconizedObject[«data #4»], IconizedObject[«data #5»], IconizedObject[«data #6»]}, ImageSize -> Medium, PlotLayout -> {"Column", UpTo[4]}]PlotLegends (7)
SectorChart[{{{1, 1}, {1, 2}, {2, 3}}, {{3, 2}, {1, 2}, {2, 3}}}, PlotLegends -> <|"Elements" -> {"ccc1", "ccc2", "ccc3"}|>, PlotStyle -> <|"Elements" -> {RGBColor[0.761959, 0.470832, 0.940597], RGBColor[0.9584254999999999, 0.877884, 0.5906629999999999], RGBColor[0.431296, 0.709773, 0.927077]}|>]SectorChart[{{{1, 1}, {1, 2}, {2, 3}}, {{3, 2}, {1, 2}, {2, 3}}}, PlotLegends -> <|"Groups" -> {"rr1", "rr2"}|>, PlotStyle -> <|"Groups" -> {RGBColor[0.761959, 0.470832, 0.940597], RGBColor[0.431296, 0.709773, 0.927077]}|>]用 Legended 添加其他图例:
SectorChart[{{{1, 1}, Legended[Style[{1, 2}, RGBColor[0.93, 0.27, 0.27]], "aa"], {2, 3}}, {{3, 2}, {1, 2}, {2, 3}}}, PlotStyle -> <|"Elements" -> {RGBColor[0.761959, 0.470832, 0.940597], RGBColor[0.9584254999999999, 0.877884, 0.5906629999999999], RGBColor[0.431296, 0.709773, 0.927077]}|>, PlotLegends -> <|"Elements" -> {"ccc1", "ccc2", "ccc3"}|>]用 Legended 指定几个图例:
SectorChart[{{2, 3}, Legended[{2, 3}, "aa"], {3, 2}, {1, 1}, Legended[{1, 2}, "bb"], {1, 2}}, PlotStyle -> <|"Elements" -> {RGBColor[0.761959, 0.470832, 0.940597], RGBColor[0.8750956, 0.6580038, 0.746929], RGBColor[0.9440982, 0.7955892, 0.5942686], RGBColor[0.9537862, 0.937389, 0.6180996], RGBColor[0.7952328000000001, 0.8988539999999999, 0.8302508], RGBColor[0.431296, 0.709773, 0.927077]}|>]SectorChart[{{{1, 1}, {1, 2}, {3, 2}}, {{1, 1}, {2, 2}, {2, 3}}}, PlotLegends -> {"Group A", "Group B"}, PlotStyle -> <|"Groups" -> {RGBColor[0.761959, 0.470832, 0.940597], RGBColor[0.431296, 0.709773, 0.927077]}|>]SectorChart[{{{1, 1}, {1, 2}, {2, 3}, {3, 2}}, {{1, 1}, {2, 2}, {2, 3}}}, PlotLegends -> {"Group A", "Group B", "Group C"}, PlotStyle -> <|"Groups" -> {RGBColor[0.761959, 0.470832, 0.940597], RGBColor[0.431296, 0.709773, 0.927077]}|>]SectorChart[{{{1, 1}, {1, 2}, {2, 3}, {3, 2}}, {{1, 1}, {2, 2}, {2, 3}}}, PlotLegends -> <|"Groups" -> {"Test A", "Test B"}, "Elements" -> {"John", "Mary", "Bob"}|>, PlotStyle -> <|"Groups" -> {EdgeForm[Directive[RGBColor[0.93, 0.27, 0.27], Thickness[0.01]]], EdgeForm[Dashed]}, "Elements" -> {RGBColor[0.761959, 0.470832, 0.940597], RGBColor[0.9584254999999999, 0.877884, 0.5906629999999999], RGBColor[0.431296, 0.709773, 0.927077]}|>]用 Placed 控制图例的放置:
Table[SectorChart[{{{1, 1}, {1, 2}, {2, 3}, {3, 2}}, {{1, 1}, {2, 2}, {2, 3}}}, PlotLegends -> Placed[{"John", "Mary", "Bob"}, pos], PlotStyle -> {RGBColor[0.761959, 0.470832, 0.940597], RGBColor[0.431296, 0.709773, 0.927077]}], {pos, {Before, Below}}]PlotStyle (5)
用 PlotStyle 设计扇区的样式:
SectorChart[{{1, 1}, {1, 2}, {2, 3}, {3, 2}}, PlotStyle -> {RGBColor[0.93, 0.27, 0.27], RGBColor[0.14, 0.8, 0.14], RGBColor[0.4, 0.6, 1], RGBColor[1, 0.75, 0]}]SectorChart[{{1, 1}, {1, 2}, {2, 3}, {3, 2}}, PlotStyle -> Directive[Opacity[0.7], EdgeForm[Dashed]]]SectorChart[{{{1, 1}, {1, 2}, {2, 3}, {3, 2}}, {{1, 1}, {2, 2}, {2, 3}}}, PlotStyle -> {RGBColor[0.93, 0.27, 0.27], RGBColor[0.4, 0.6, 1]}]SectorChart[{{{1, 2}, {2, 2}, {2, 3}}, {{1, 1}, {2, 2}, {2, 1}}}, PlotStyle -> <|"Elements" -> {RGBColor[0.93, 0.27, 0.27], RGBColor[0.14, 0.8, 0.14], RGBColor[0.4, 0.6, 1]}|>]SectorChart[{{{1, 1}, {1, 2}, {2, 3}, {3, 2}}, {{1, 1}, {2, 2}, {2, 3}}}, PlotStyle -> <|"Groups" -> {RGBColor[0.93, 0.27, 0.27], RGBColor[0.14, 0.8, 0.14]}|>]SectorChart[{{{1, 1}, {1, 2}, {2, 3}, {3, 2}}, {{1, 1}, {2, 2}, {2, 3}}}, PlotStyle -> <|"Base" -> EdgeForm[{Thick, Dashed}], "Groups" -> {Opacity[0.5], Opacity[0.9]}, "Elements" -> {RGBColor[0.93, 0.27, 0.27], RGBColor[0.14, 0.8, 0.14], RGBColor[0.4, 0.6, 1]}|>]SectorChart[{{1, 2}, Style[{1, 3}, EdgeForm[Dashed]], {1, 1}, {2, 2}}, PlotStyle -> {RGBColor[0.93, 0.27, 0.27], RGBColor[0.14, 0.8, 0.14], RGBColor[0.4, 0.6, 1], RGBColor[1, 0.75, 0]}]SectorChart[{{1, 2}, Style[{1, 3}, EdgeForm[None]], {1, 1}, {2, 2}}, PlotStyle -> EdgeForm[{Thick, Dashed}]]"Elements" 或 "Groups" 的设置可能会覆盖 "Base" 的设置:
SectorChart[{{{1, 1}, {1, 2}, {2, 3}, {3, 2}}, {{1, 1}, {2, 2}, {2, 3}}}, PlotStyle -> <|"Base" -> EdgeForm[None], "Elements" -> EdgeForm[Dashed]|>]ColorFunction may override settings for PlotStyle:
SectorChart[{{1, 1}, {1, 2}, {2, 3}, {3, 2}}, PlotStyle -> EdgeForm[Dashed], ColorFunction -> (EdgeForm[None]&)]用 ColorFunction 来组合不同的样式效果:
SectorChart[{{1, 1}, {1, 2}, {2, 3}, {3, 2}}, PlotStyle -> EdgeForm /@ {Dashed, Dotted, DotDashed}, ColorFunction -> (Blend[{LightBlue, LightRed}, #]&)]SectorChart[RandomReal[{0.4, 1}, {3, 8, 2}], PlotStyle -> <|"Groups" -> "Rainbow"|>, ChartLayout -> "Grouped", ColorFunction -> Function[{height}, Opacity[height]]]PieChart[{{1, 2, 3, 4, 5}, {1, 2, 3}}, ChartElementFunction -> "TriangleWaveSector", PlotStyle -> {RGBColor[0.761959, 0.470832, 0.940597], RGBColor[0.431296, 0.709773, 0.927077]}]应用 (3)
countries = {"Sweden", "Portugal", "Bulgaria", "Slovenia", "Austria"};
properties = {"GDPPerCapita", "Population"};data = Table[With[{v = cp}, Button[v[[2 ;; 3]], Speak[StringJoin[ToString /@ {v[[1]], ", GDP per capita: $", Round[v[[2]]], ", Population: ", Round[v[[3]]]}]]]], {cp, Table[Prepend[QuantityMagnitude@Table[CountryData[c, p], {p, properties}], c], {c, countries}]}];SectorChart[data, AxesLabel -> properties, PlotLabels -> Placed[countries, Tooltip]]countries = CountryData["G8"];
gdp = CountryData[#, {"GDP", 2006}]& /@ countries;
gdpPerCapita = CountryData[#, {"GDPPerCapita", 2006}]& /@ countries;
population = CountryData[#, {"Population", 2006}]& /@ countries;
data = Transpose[{population, gdpPerCapita}];
dollarForm[a_] := NumberForm[a, {10, 2}, NumberPadding -> {"", "0"}]对每一个扇形加一个别致的 Tooltip 标签:
labeler = (Placed[#, Tooltip, Style[Column[{Row[{"GDP (Area): ", dollarForm[First@# * Last@#]}], Row[{"Population (Angle): ", First@#}], Row[{"GDP Per Capita (Radius): ", dollarForm[First@#]}]}, Alignment -> {Left, Bottom}, Frame -> True], 14, FontFamily -> "Helvetica"]&]&);SectorChart[data, SectorOrigin -> {Automatic, 10000}, LabelingFunction -> labeler, PlotStyle -> <|"Elements" -> 2|>, PlotLabels -> Placed[EntityValue[countries, "Name"], "RadialCallout", Style[#, 12, FontFamily -> "Helvetica", Darker@Brown]&], Epilog -> Text[Style["GDP", 12, Bold, Darker[Brown], FontFamily -> "Helvetica"]], PlotLabel -> Style["Visualizing GDP Per Capita", 14, Bold, FontFamily -> "Helvetica", Darker@Brown], PlotRange -> All, PlotLegends -> Placed[Style[dollarForm[#], FontFamily -> "Helvetica"]& /@ gdp, After]]从 0° 到 360° 的 WeatherData 中的风向:
WeatherData["KCMI", "WindDirection"]WeatherData["KCMI", "WindDirection", "Units"]data = WeatherData["KCMI", "WindDirection", {{2007, 11, 1}, {2008, 11, 1}}]["Values"];data = DeleteCases[data, _Missing];用 Sow 定义一个图表元素函数,来存储组距和频数数据:
sowingBar[{{x0_, x1_}, {y0_, y1_}}, __] := (Sow[{x1 - x0, 100 * (y1 - y0)}];Rectangle[{x0, y0}, {x1, y1}]){histogram, newdata} = Reap[Histogram[data, Automatic, "Probability", ChartElementFunction -> sowingBar]];histogramSectorChart[newdata, SectorOrigin -> {Pi / 2, "Clockwise"}, PolarAxes -> True, PolarGridLines -> Automatic, PolarTicks -> {"Direction", Automatic}, PlotStyle -> <|"Elements" -> Directive[Opacity[1], EdgeForm[Thin]]|>]属性和关系 (4)
SectorChart 是 PieChart 的一般化:
{SectorChart[{{1, 1}, {2, 1}, {3, 1}}], PieChart[{1, 2, 3}]}使用 SectorChart3D 得到一个三维扇形图:
SectorChart3D[{{2, 2, 3}, {2, 1, 2}, {1, 2, 1}}]使用 RectangleChart 把成对数绘制成条状:
RectangleChart[{{1, 1}, {2, 2}, {3, 1}}]使用 ListPlot 和 ListLinePlot 从成对数产生线图:
{ListPlot[Table[{i, i ^ 2}, {i, 10}], Filling -> Axis], ListLinePlot[Table[{i, i ^ 2}, {i, 10}]]}巧妙范例 (3)
SectorChart[RandomReal[10, {10, 2}], PolarAxes -> True, PolarGridLines -> Automatic, PolarTicks -> {Automatic, Table[{i, "A " ~~ ToString[i], {0.1, 0.6}}, {i, 0, 10, 2}]}, TicksStyle -> {Directive[Darker[RGBColor[0.14, 0.8, 0.14]], 12, Bold], Directive[GrayLevel[0.62], 12, Bold]}]SectorChart[RandomReal[1, {20, 2}], PolarAxes -> True, PolarGridLines -> Automatic, GridLinesStyle -> Directive[Dashed, RGBColor[0.98, 0.56, 0.17]], PolarAxesOrigin -> {{Top, Right}, Automatic}]SectorChart[RandomReal[10, {10, 300, 2}], ColorFunction -> "DeepSeaColors", PerformanceGoal -> "Speed", Background -> GrayLevel[0.62], PlotStyle -> <|"Base" -> EdgeForm[None]|>]文本
Wolfram Research (2008),SectorChart,Wolfram 语言函数,https://reference.wolfram.com/language/ref/SectorChart.html (更新于 2026 年).
CMS
Wolfram 语言. 2008. "SectorChart." Wolfram 语言与系统参考资料中心. Wolfram Research. 最新版本 2026. https://reference.wolfram.com/language/ref/SectorChart.html.
APA
Wolfram 语言. (2008). SectorChart. Wolfram 语言与系统参考资料中心. 追溯自 https://reference.wolfram.com/language/ref/SectorChart.html 年