

TorusGraph
TorusGraph[{n1,n2,…,nk}]
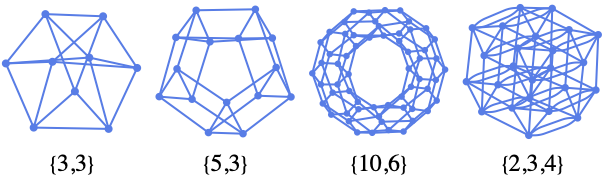
n1×n2×…×nkの頂点を持つ k-次元のトーラスグラフを与える.
詳細とオプション
- TorusGraphはトロイダルグラフとしても知られている.
- TorusGraph[{n1,n2,…,nk}]は,巡回グラフ
 の直積から形成されたグラフを与える.
 - TorusGraph[{n1,n2,…,nk},DirectedEdges->True]は有向トーラスグラフを与える.
- TorusGraphにはGraphと同じオプションが使える.
全オプションのリスト
例題
すべて開く すべて閉じる例 (2)
スコープ (2)
TorusGraph[{10, 5}]TorusGraph[{10}]TorusGraph[{10, 5}]TorusGraph[{10, 5, 2}]
TorusGraph[{10, 5, 2, 2}]TorusGraph[{8, 4}, DirectedEdges -> True]オプション (83)
AnnotationRules (3)
TorusGraph[{1, 3}, AnnotationRules -> {1 -> {VertexLabels -> "hello"}}]TorusGraph[{1, 3}, AnnotationRules -> {12 -> {EdgeLabels -> "hello"}}]TorusGraph[{1, 3}, AnnotationRules -> {"GraphProperties" -> {"Message" -> "hello"}}]AnnotationValue[%, "Message"]DirectedEdges (1)
TorusGraph[{1, 3}]DirectedEdges->Trueを使って有向グラフを生成する:
TorusGraph[{1, 3}, DirectedEdges -> True]EdgeLabels (7)
TorusGraph[{1, 3}, EdgeLabels -> {12 -> "Hello"}]el = EdgeList[TorusGraph[{1, 3}]]TorusGraph[{1, 3}, EdgeLabels -> Table[el[[i]] -> Subscript["e", i], {i, Length[el]}]]TorusGraph[{1, 3}, EdgeLabels -> {12 -> [image], 23 -> [image], 13 -> [image]}]Placedを記号的な位置と一緒に使って辺に沿ったラベル配置を制御する:
Table[TorusGraph[{1, 3}, EdgeLabels -> {12 -> Placed["■■■", p]}, PlotLabel -> p], {p, {"Start", "Middle", "End"}}]Table[TorusGraph[{1, 3}, EdgeLabels -> {12 -> Placed["■■■", p]}, PlotLabel -> p, BaselinePosition -> Bottom], {p, {0, 1 / 4, 1 / 3}}]Table[TorusGraph[{1, 3}, EdgeLabels -> {12 -> Placed["■■■", {1 / 2, p}]}, PlotLabel -> p, BaselinePosition -> Bottom], {p, {{0, 0}, {1 / 2, 1 / 2}, {1, 1}}}]TorusGraph[{1, 3}, EdgeLabels -> {31 -> Placed[{"lbl1", "lbl2"}, {"Start", "End"}]}]TorusGraph[{1, 3}, EdgeLabels -> {31 -> Placed[{"lbl1", "lbl2", "lbl3"}, {"Start", "Middle", "End"}]}]TooltipとStatusAreaの値を使って自動的にラベルを置く:
TorusGraph[{1, 3}, EdgeLabels -> Placed["Name", Tooltip]]TorusGraph[{1, 3}, EdgeLabels -> Placed["Name", StatusArea]]EdgeShapeFunction (6)
EdgeShapeFunctionの組込み設定のリストを得る:
ResourceData["EdgeShapeFunction"]TorusGraph[{1, 3}, EdgeShapeFunction -> "Line"]Table[TorusGraph[{1, 3}, EdgeShapeFunction -> {{ef, "ArrowSize" -> 0.1}}, PlotLabel -> ef], {ef, {"BoxLine", "DiamondLine", "DotLine"}}]Table[TorusGraph[{1, 3}, EdgeShapeFunction -> {{ef, "ArrowSize" -> 0.1}}, PlotLabel -> ef], {ef, ResourceData["EdgeShapeFunction", "FilledArrow"]}]Table[TorusGraph[{1, 3}, EdgeShapeFunction -> {{ef, "ArrowSize" -> 0.1}}, PlotLabel -> ef], {ef, ResourceData["EdgeShapeFunction", "UnfilledArrow"]}]Table[TorusGraph[{1, 3}, EdgeShapeFunction -> {{ef, "ArrowSize" -> 0.1}}, PlotLabel -> ef], {ef, ResourceData["EdgeShapeFunction", "CarvedArrow"]}]TorusGraph[{1, 3}, EdgeShapeFunction -> {12 -> "DotLine"}]TorusGraph[{1, 3}, EdgeShapeFunction -> {12 -> "BoxLine", "DotLine"}]ef[pts_List, e_] :=
Block[{s = 0.015, g = [image]}, {Arrowheads[{{s, 0.33, g}, {s, 0.67, g}}], Arrow[pts]}]TorusGraph[{1, 3}, EdgeShapeFunction -> ef]EdgeShapeFunctionはEdgeStyleと組み合せることができる:
TorusGraph[{1, 3}, EdgeStyle -> Blue, EdgeShapeFunction -> (Line[#1]&)]EdgeShapeFunctionはEdgeStyleより優先順位が高い:
TorusGraph[{1, 3}, EdgeStyle -> Blue, EdgeShapeFunction -> ({Red, Line[#1]}&)]EdgeStyle (2)
EdgeWeight (3)
TorusGraph[{1, 3}, EdgeWeight -> RandomInteger[5, 6]]WeightedAdjacencyMatrix[%]//MatrixFormTorusGraph[{1, 3}, EdgeWeight -> {a, b, c, d, e, f}]WeightedAdjacencyMatrix[%]//MatrixFormTorusGraph[{1, 3}, EdgeWeight -> {12 -> 2, 23 -> 4}]PropertyValue[{%, 12}, EdgeWeight]GraphHighlight (3)
TorusGraph[{1, 3}, VertexSize -> Tiny, GraphHighlight -> {1}]TorusGraph[{1, 3}, VertexSize -> Tiny, GraphHighlight -> {23}]TorusGraph[{1, 3}, VertexSize -> Tiny, GraphHighlight -> {1, 2, 13, 23}]GraphHighlightStyle (2)
GraphHighlightStyleの組込み設定のリストを得る:
ResourceData["GraphHighlightStyle"]GraphHighlightStyleの組込み設定を使う:
TorusGraph[{1, 3}, GraphHighlight -> {1, 23}, VertexSize -> Small, GraphHighlightStyle -> #, PlotLabel -> #]& /@ Select[ResourceData["GraphHighlightStyle"], # =!= Automatic&]GraphLayout (5)
TorusGraph[{1, 3}, GraphLayout -> Automatic]Table[TorusGraph[{10, 5}, GraphLayout -> l, PlotLabel -> l], {l, {"CircularEmbedding", "SpiralEmbedding"}}]Table[TorusGraph[{10, 5}, GraphLayout -> l, PlotLabel -> l], {l, {"SpringEmbedding", "SpringElectricalEmbedding", "HighDimensionalEmbedding"}}]VertexCoordinatesはGraphLayoutの座標をオーバーライドする:
{TorusGraph[{1, 3}, GraphLayout -> "SpringElectricalEmbedding"],
TorusGraph[{1, 3}, GraphLayout -> "SpringElectricalEmbedding", VertexCoordinates -> Table[{i, i}, {i, 0, 2}]]}AbsoluteOptionsを使ってレイアウトアルゴリズムで計算されたVertexCoordinatesを抽出する:
TorusGraph[{1, 3}]AbsoluteOptions[%, VertexCoordinates]PlotTheme (4)
基本テーマ (2)
VertexCoordinates (3)
TorusGraph[{1, 3}]AbsoluteOptionsを使って結果の頂点座標を抽出する:
AbsoluteOptions[%, VertexCoordinates]ellipseLayout[n_, {a_, b_}] := Table[{a Cos[2Pi / n u], b Sin[2Pi / n u]}, {u, 1, n}]Graphics[Point[ellipseLayout[10, {2, 1}]]]TorusGraph[{10, 1}, VertexCoordinates -> ellipseLayout[10, {2, 1}]]VertexCoordinatesはGraphLayoutより優先順位が高い:
TorusGraph[{1, 4}, VertexCoordinates -> Table[{i, i}, {i, 4}], GraphLayout -> "CircularEmbedding"]VertexLabels (13)
TorusGraph[{1, 3}, VertexLabels -> "Name"]TorusGraph[{1, 3}, VertexLabels -> {1 -> "one"}]TorusGraph[{1, 3}, VertexLabels -> Table[i -> Subscript[v, i], {i, 3}]]TorusGraph[{1, 3}, VertexLabels -> {1 -> [image], 2 -> [image], 3 -> [image]}, ImagePadding -> 20]Placedを記号的な位置と一緒に使って外側位置を含むラベルの置き方を制御する:
Table[TorusGraph[{1, 3}, VertexSize -> 0.1, VertexShapeFunction -> "Square", VertexLabels -> Table[i -> Placed["■■■", p], {i, 3}], PlotLabel -> p, ImagePadding -> 20], {p, {Before, After, Below, Above}}]pl = {{Before, Below}, {After, Below}, {Before, Above}, {After, Above}};Table[TorusGraph[{1, 3}, VertexSize -> 0.1, VertexShapeFunction -> "Square", ImagePadding -> 20, VertexLabels -> Table[i -> Placed["■■■", p], {i, 3}], PlotLabel -> p], {p, pl}]Table[TorusGraph[{1, 3}, VertexSize -> 0.25, VertexLabels -> Table[i -> Placed["■■■", p], {i, 3}], VertexShapeFunction -> "Square", PlotLabel -> p], {p, {Left, Top, Right, Bottom}}]pl = {{Left, Bottom}, {Right, Bottom}, {Left, Top}, {Right, Top}};Table[TorusGraph[{1, 3}, VertexSize -> 0.25, VertexShapeFunction -> "Square", VertexLabels -> Table[i -> Placed["■■■", p], {i, 3}], PlotLabel -> p], {p, pl}]Table[TorusGraph[{1, 3}, VertexSize -> 0.25, VertexShapeFunction -> "Square", VertexLabels -> Table[i -> Placed[[image], p], {i, 3}], PlotLabel -> p, BaselinePosition -> Bottom], {p, {{0, 0}, {1 / 2, 1 / 2}, {1, 1}}}]すべてのラベルを頂点の右上コーナーに置き,ラベル内の座標を変える:
Table[TorusGraph[{1, 3}, VertexSize -> 0.35, VertexShapeFunction -> "Square", VertexLabels -> Table[i -> Placed[[image], {{1, 1}, p}], {i, 3}], PlotLabel -> p, BaselinePosition -> Bottom], {p, {{0, 0}, {1 / 2, 1 / 2}, {1, 1}}}]TorusGraph[{1, 3}, VertexLabels -> {1 -> Placed[{"lbl1", "lbl2"}, {Above, Below}]}]TorusGraph[{1, 3}, VertexLabels -> {1 -> Placed[{"lbl1", "lbl2", "lbl3", "lbl4"}, {Above, After, Below, Before}]}]Placedの引数を使ってTooltipを含むフォーマットを制御する:
TorusGraph[{1, 3}, VertexLabels -> Placed["Name", Tooltip]]あるいはStatusArea:
TorusGraph[{1, 3}, VertexLabels -> Placed["Name", StatusArea]]rotateLabel[lab_] := Rotate[lab, 45Degree]TorusGraph[{1, 3}, VertexLabels -> Table[i -> Placed["xxx", Below, rotateLabel], {i, 3}]]panelLabel[lab_] := Panel[lab, FrameMargins -> 0, Background -> Lighter[Yellow, 0.7]]TorusGraph[{1, 3}, VertexLabels -> Table[i -> Placed["xxx", Center, panelLabel], {i, 3}]]hyperlinkLabel[lab_] := Hyperlink[lab, "http://www.wolfram.com"]TorusGraph[{1, 3}, VertexLabels -> Table[i -> Placed["xxx", Center, hyperlinkLabel], {i, 3}]]VertexShape (5)
任意のGraphics,ImageあるいはGraphics3Dを頂点の形状として使う:
Table[TorusGraph[{1, 3}, VertexShape -> s, VertexSize -> Medium], {s, {[image], [image], [image]}}]TorusGraph[{1, 3}, VertexShape -> {2 -> [image]}, VertexSize -> Medium]VertexShapeはVertexSizeと組み合せることができる:
Table[TorusGraph[{1, 3}, VertexSize -> s, VertexShape -> [image], PlotLabel -> s], {s, {Small, Large}}]VertexShapeはVertexStyleの影響を受けない:
TorusGraph[{1, 3}, VertexSize -> 0.2, VertexShape -> [image], VertexStyle -> Blue]VertexShapeFunctionはVertexShapeより優先順位が高い:
TorusGraph[{1, 3}, VertexSize -> 0.1, VertexShapeFunction -> "Square", VertexShape -> [image]]VertexShapeFunction (10)
VertexShapeFunctionの組込みコレクションのリストを得る:
ResourceData["VertexShapeFunction"]"Basic"コレクションの中のVertexShapeFunctionの組込み設定を使う:
ResourceData["VertexShapeFunction", "Basic"]Table[TorusGraph[{1, 3}, VertexShapeFunction -> vf, VertexSize -> 0.2, PlotLabel -> vf], {vf, {"Triangle", "Square", "Rectangle", "Pentagon", "Hexagon", "Octagon"}}]Table[TorusGraph[{1, 3}, VertexShapeFunction -> vf, VertexSize -> 0.2, PlotLabel -> vf], {vf, {"DownTrapezoid", "UpTrapezoid", "Parallelogram", "FiveDown", "Circle", "Diamond", "Star", "Capsule"}}]"Rounded"コレクションのVertexShapeFunctionの組込み設定を使う:
ResourceData["VertexShapeFunction", "Rounded"]Table[TorusGraph[{1, 3}, VertexShapeFunction -> vf, VertexSize -> 0.2, PlotLabel -> vf], {vf, ResourceData["VertexShapeFunction", "Rounded"]}]"Concave"コレクションのVertexShapeFunctionの組込み設定を使う:
ResourceData["VertexShapeFunction", "Concave"]Table[TorusGraph[{1, 3}, VertexShapeFunction -> vf, VertexSize -> 0.2, PlotLabel -> vf], {vf, ResourceData["VertexShapeFunction", "Concave"]}]TorusGraph[{1, 3}, VertexShapeFunction -> { 1 -> "Square"}, VertexSize -> 0.2]TorusGraph[{1, 3}, VertexShapeFunction -> { 1 -> "Square", "Triangle"}, VertexSize -> 0.2]TorusGraph[{1, 3}, VertexShapeFunction -> (Inset[[image], #]&)]vf[{xc_, yc_}, name_, {w_, h_}] :=
Block[{xmin = xc - w, xmax = xc + w, ymin = yc - h, ymax = yc + h},
Polygon[{{xmin, ymin}, {xmax, ymax}, {xmin, ymax}, {xmax, ymin}}]
];TorusGraph[{1, 3}, VertexShapeFunction -> vf, VertexSize -> 0.2]VertexShapeFunctionはVertexStyleと組み合せることができる:
vf1[{xc_, yc_}, name_, {w_, h_}] := Rectangle[{xc - w, yc - h}, {xc + w, yc + h}]TorusGraph[{1, 3}, VertexSize -> 0.2, VertexStyle -> Blue, VertexShapeFunction -> vf1]VertexShapeFunctionはVertexStyleより優先順位が高い:
vf2[{xc_, yc_}, name_, {w_, h_}] := {Red, Rectangle[{xc - w, yc - h}, {xc + w, yc + h}]}TorusGraph[{1, 3}, VertexSize -> 0.2, VertexStyle -> Blue, VertexShapeFunction -> vf2]VertexShapeFunctionはVertexSizeと組み合せることができる:
TorusGraph[{1, 3}, VertexShapeFunction -> "Star", VertexSize -> {1 -> Small, Medium}]VertexShapeFunctionはVertexShapeより優先順位が高い:
TorusGraph[{1, 3}, VertexSize -> 0.3, VertexShapeFunction -> "Star", VertexShape -> [image]]VertexSize (8)
TorusGraph[{1, 3}, VertexSize -> Automatic]Table[TorusGraph[{1, 3}, VertexSize -> s, PlotLabel -> s], {s, {Tiny, Small, Medium, Large}}]Table[TorusGraph[{1, 3}, VertexSize -> s, PlotLabel -> s], {s, 0.1, 1, 0.3}]Table[TorusGraph[{1, 3}, VertexSize -> {"Scaled", s}, PlotLabel -> {"Scaled", s}], {s, 0.1, 1, 0.3}]

Table[TorusGraph[{1, 3}, VertexSize -> s, PlotLabel -> s], {s, {{0.1, 0.2}, {0.2, 0.1}}}]TorusGraph[{1, 3}, VertexSize -> {1 -> 0.2, 2 -> 0.3}]VertexSizeはVertexShapeFunctionと組み合せることができる:
Table[TorusGraph[{1, 3}, VertexSize -> s, VertexShapeFunction -> "Square", PlotLabel -> s], {s, {0.05, 0.1, 0.2}}]VertexSizeはVertexShapeと組み合せることができる:
Table[TorusGraph[{1, 3}, VertexSize -> s, VertexShape -> [image], PlotLabel -> s], {s, {0.1, 0.2, 0.4}}]VertexStyle (5)
Table[TorusGraph[{1, 3}, VertexStyle -> style, VertexSize -> 0.3, PlotLabel -> style], {style, {Yellow, EdgeForm[Dashed]}}]TorusGraph[{1, 3}, VertexStyle -> {1 -> Blue, 2 -> Red}, VertexSize -> 0.2]VertexShapeFunctionはVertexStyleと組み合せることができる:
vf1[{xc_, yc_}, name_, {w_, h_}] := Rectangle[{xc - w, yc - h}, {xc + w, yc + h}]TorusGraph[{1, 3}, VertexSize -> 0.2, VertexStyle -> Blue, VertexShapeFunction -> vf1]VertexShapeFunctionはVertexStyleより優先順位が高い:
vf2[{xc_, yc_}, name_, {w_, h_}] := {Red, Rectangle[{xc - w, yc - h}, {xc + w, yc + h}]}TorusGraph[{1, 3}, VertexSize -> 0.2, VertexStyle -> Blue, VertexShapeFunction -> vf2]VertexStyleはBaseStyleと組み合せることができる:
TorusGraph[{1, 3}, VertexStyle -> LightBlue, BaseStyle -> EdgeForm[Dotted], VertexSize -> 0.2]VertexStyleはBaseStyleより優先順位が高い:
TorusGraph[{1, 3}, VertexStyle -> LightBlue, BaseStyle -> Gray, VertexSize -> 0.2]VertexShapeはVertexStyleの影響を受けない:
TorusGraph[{1, 3}, VertexSize -> 0.2, VertexShape -> [image], VertexStyle -> Blue]VertexWeight (3)
TorusGraph[{1, 3}, VertexWeight -> {2, 3, 4}]AnnotationValue[{%, 1}, VertexWeight]TorusGraph[{1, 3}, VertexWeight -> {1 -> 2}]AnnotationValue[{%, 1}, VertexWeight]TorusGraph[{1, 3}, VertexWeight -> {a, b, c}]AnnotationValue[{%, 1}, VertexWeight]アプリケーション (11)
基本的なアプリケーション (6)
Table[TorusGraph[{10, 5}, GraphLayout -> l, PlotLabel -> l], {l, {"SpringElectricalEmbedding", "RadialEmbedding", "LayeredEmbedding"}}]TorusGraph[{10, 5}, {VertexStyle -> Red, VertexSize -> 0.5, EdgeStyle -> Directive[Blue, Dashed, Thick]}]g = TorusGraph[{10, 3}];Annotate[{g, 1}, {VertexLabels -> "one", VertexSize -> Large}]Annotate[{g, 1518}, EdgeStyle -> Directive[Red, Thick]]g = TorusGraph[{10, 3}]Graph[g, GraphLayout -> "LayeredEmbedding"]Graph[g, VertexSize -> Large]Graph3D[TorusGraph[{10, 5}]]VertexCount[TorusGraph[{n, m}]]EdgeCount[TorusGraph[{n, m}]]グラフ理論 (5)
Table[MatrixPlot[AdjacencyMatrix[TorusGraph[ConstantArray[10, k]]], FrameTicks -> None, PlotLabel -> k], {k, 2, 4}]g = TorusGraph[{10, 3}];FindVertexColoring[g, ColorData[106, "ColorList"]]Annotate[g, {VertexStyle -> Thread[VertexList[g] -> %], VertexSize -> Large}]g = TorusGraph[{10, 3}];FindEdgeColoring[g, ColorData[106, "ColorList"]]Annotate[g, EdgeStyle -> Thread[EdgeList[g] -> (Directive[#, Thick]& /@ %)]]g = SimpleGraph[TorusGraph[{10, 3}]];FindShortestTour[g]HighlightGraph[g, PathGraph[%[[2]]], GraphHighlightStyle -> "Thick"]g = TorusGraph[{10, 3}];FindSpanningTree[g];HighlightGraph[g, %, GraphHighlightStyle -> "Thick"]特性と関係 (6)
TorusGraph[{n1,n2,…}]は, の一つが1なら自己ループを持つ:
TorusGraph[{1, 3}]LoopFreeGraphQ[%]TorusGraph[{n1,n2,…}]は, の一つが2なら平行辺を持つ:
TorusGraph[{2, 3}]SimpleGraphQ[%]TorusGraph[{n}]は巡回グラフである:
{TorusGraph[{5}], CycleGraph[5]}TorusGraph[{m,n}]は巡回グラフ  と
と  の直積から形成されるグラフである:
TorusGraph[{10, 6}]GraphProduct[CycleGraph[10], CycleGraph[6], GraphLayout -> "SpringElectricalEmbedding"]TorusGraphはGridGraphと同じ数の頂点を持つ:
VertexCount@TorusGraph[{n, m, k}] === VertexCount@GridGraph[{n, m, k}]TorusGraph[f]とGridGraph[f]の辺数の差:
f = {n, m, j, k};Simplify[EdgeCount@TorusGraph[f] - EdgeCount@GridGraph[f]]Total[Times@@#& /@ Subsets[f, {Length[f] - 1}]]考えられる問題 (1)
大きいツアーグラフは自動的にはグラフのプロットとして表示されない:
TorusGraph[{20, 12, 14}]GraphPlotを使ってグラフをプロットする:
GraphPlot[TorusGraph[{20, 12, 14}]]インタラクティブな例題 (1)
テキスト
Wolfram Research (2022), TorusGraph, Wolfram言語関数, https://reference.wolfram.com/language/ref/TorusGraph.html.
CMS
Wolfram Language. 2022. "TorusGraph." Wolfram Language & System Documentation Center. Wolfram Research. https://reference.wolfram.com/language/ref/TorusGraph.html.
APA
Wolfram Language. (2022). TorusGraph. Wolfram Language & System Documentation Center. Retrieved from https://reference.wolfram.com/language/ref/TorusGraph.html