


GeoGraphValuePlot
GeoGraphValuePlot[{{src1,dest1,flow1},{src2,dest2,flow2},…,{srcn,destn,flown}}]
plots the flows between geo locations.
GeoGraphValuePlot[{{e1,val1},{e2,val2},…}]
plots the values vali for the edges ei.
plots the flow for a graph g with associated edge weights.
Details and Options
- GeoGraphValuePlot is also known as a flow map, distributive flow lines, origin-destination flow maps and thematic map.
- GeoGraphValuePlot is used to show the flow of entities such as goods and people between various locations on the Earth by styling the edges in a graph according to the relative sizes of the flows.
- An undirected edge ei between vertices u and v can be given as uv, u<->v, UndirectedEdge[u,v] or TwoWayRule[u,v]. The character can be entered as
 ue
ue .
. - A directed edge ei from u to v can be given as uv, u->v, DirectedEdge[u,v] or Rule[u,v]. The character can be entered as
 de
de .
. - The geo locations srci and desti can be given in the following forms:
-
GeoPosition[{lat,lon}] latitude and longitude Entity[…] geographic entity Dated[ent,date] dated entity Image[…] geo-tagged image - The graph g can be any edge-weighted graph with geographic vertices.
- The option VertexCoordinates can be used to specify geo locations for vertices that do not already contain them, using the same forms to represent geo locations.
- The values vali can be given in the following forms:
-
vali positive number Quantity[vali,unit] magnitude with units - Data not given in these forms is omitted from the plot.
- The following special wrappers can be used for vertices and edges:
-
Annotation[a,label] provide an annotation Button[a,action] define an action to execute when the element is clicked EventHandler[a,…] define a general event handler for the element Hyperlink[a,uri] make the element act as a hyperlink Labeled[a,…] display the element with labeling PopupWindow[a,cont] attach a popup window to the element StatusArea[a,label] display in the status area when the element is moused over Style[a,opts] show the element using the specified styles Tooltip[a,label] attach an arbitrary tooltip to the element - GeoGraphValuePlot takes the same options as GeoGraphics, with the following additions and changes: [List of all options]
-
ClippingStyle Automatic how to style edges outside the value ranges ColorFunction None how to determine the coloring of edges ColorFunctionScaling True whether to scale arguments to ColorFunction EdgeLabels None labels and placements for edges EdgeLabelStyle Automatic style to use for edge labels EdgeShapeFunction Automatic generate graphic shapes for edges EdgeStyle Automatic styles for edges EdgeValueRange Automatic range of edge values to show EdgeValueSizes Automatic range of sizes for edge values GraphHighlight {} vertices and edges to highlight GraphHighlightStyle Automatic style for highlight GraphLayout Automatic how to lay out vertices and edges Method Automatic method to use MinPointSeparation Automatic when to combine nearby vertices MissingStyle None how to display edges with no weights PerformanceGoal Automatic aspects of performance to try to optimize PlotStyle Automatic graphics directives to determine styles PlotTheme Automatic overall theme for the graph ScalingFunctions None how to scale values TargetUnits Automatic units to use for values VertexCoordinates Automatic coordinates for vertices VertexLabels None labels and placements for vertices VertexLabelStyle Automatic style to use for vertex labels VertexShape Automatic graphic shape for vertices VertexShapeFunction Automatic generate graphic shapes for vertices VertexSize Automatic size of vertices VertexStyle Automatic styles for vertices - EdgeValueRange specifies what range of edge flows to include in the plot.
- The following settings can be given for for EdgeValueRange:
-
All include all edges Automatic automatically select the edges to include {min,max} include edges with weights between min and max - Edges whose sizes are outside the value range are displayed using ClippingStyle.
- EdgeValueSizes specifies the range of thicknesses used to display the edge flows.
- The following settings can be given for EdgeValueSizes:
-
Automatic determine edge sizes automatically Large,Medium,Small,Tiny use preset edge sizes {smin,smax} use minimum size smin and maximum size smax smax use maximum size smax None use the same size for all edges - With the default setting MissingStyleNone, edges without a numeric weight are omitted from the plot.
- ScalingFunctionsscale is used to scale the edge weights. Possible settings for scale include:
-
None use linear scaling "Log" use logarithmic scaling "Reciprocal" use reciprocal scaling {f,f-1} use function f and inverse function 
- GraphLayout specifies where to draw the edges connecting geographic locations.
- Possible settings for GraphLayout include:
-

Automatic automatically compute edges 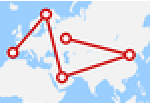
"StraightLine" use straight lines as edges 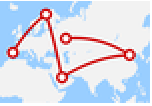
"Geodesic" use geodesics as edges 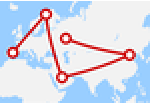
"Rhumb" use rhumb lines as edges 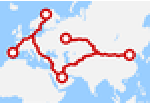
"Driving","Walking","Cycling" transportation methods - By default, the edges generated by GeoGraphValuePlot are abstract paths, showing self-loops and multiple edges between two vertices when present in the graph.
- If a travel path cannot be found between two vertices, the edge will use "StraightLine" instead.
- EdgeShapeFunctionfunc specifies that each vertex should be rendered with the primitives provided by func[{pt1,pt2},vw], where pt1 and pt2 are the geographic locations of the vertices for the edge vw.
- VertexLabelsAutomatic automatically labels vertices that are named locations. Vertices that are specified using latitude and longitude are left unlabeled.
- Graph features themes affect the plot of vertices and edges. Feature themes include:
-
"LargeGraph" large graph 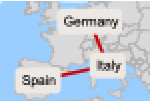
"NameLabeled" classic graph 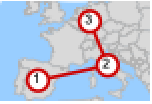
"IndexLabeled" index-labeled graph
List of all options
Examples
open all close allBasic Examples (2)
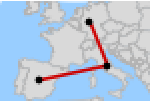
Show the flow between cities by varying the thickness of the edges:
GeoGraphValuePlot[{{Entity["City", {"Rome", "Lazio", "Italy"}], Entity["City", {"Milan", "Lombardy", "Italy"}], 2.2}, {Entity["City", {"Milan", "Lombardy", "Italy"}], Entity["City", {"Paris", "IleDeFrance", "France"}], 2.4}, {Entity["City", {"Milan", "Lombardy", "Italy"}], Entity["City", {"Frankfurt", "Hesse", "Germany"}], 5}, {Entity["City", {"Paris", "IleDeFrance", "France"}], Entity["City", {"Frankfurt", "Hesse", "Germany"}], 3.2}, {Entity["City", {"Paris", "IleDeFrance", "France"}], Entity["City", {"Madrid", "Madrid", "Spain"}], 4.3}, {Entity["City", {"Paris", "IleDeFrance", "France"}], Entity["City", {"London", "GreaterLondon", "UnitedKingdom"}], 3.3}, {Entity["City", {"Madrid", "Madrid", "Spain"}], Entity["City", {"Seville", "Seville", "Spain"}], 3.6}, {Entity["City", {"Madrid", "Madrid", "Spain"}], Entity["City", {"Barcelona", "Barcelona", "Spain"}], 1.8}}]Plot an undirected flow graph:
GeoGraphValuePlot[Graph[{Entity["City", {"Rome", "Lazio", "Italy"}]Entity["City", {"Milan", "Lombardy", "Italy"}], Entity["City", {"Milan", "Lombardy", "Italy"}]Entity["City", {"Paris", "IleDeFrance", "France"}], Entity["City", {"Milan", "Lombardy", "Italy"}]Entity["City", {"Frankfurt", "Hesse", "Germany"}], Entity["City", {"Paris", "IleDeFrance", "France"}]Entity["City", {"Frankfurt", "Hesse", "Germany"}], Entity["City", {"Paris", "IleDeFrance", "France"}]Entity["City", {"Madrid", "Madrid", "Spain"}], Entity["City", {"Paris", "IleDeFrance", "France"}]Entity["City", {"London", "GreaterLondon", "UnitedKingdom"}], Entity["City", {"Madrid", "Madrid", "Spain"}]Entity["City", {"Seville", "Seville", "Spain"}], Entity["City", {"Madrid", "Madrid", "Spain"}]Entity["City", {"Barcelona", "Barcelona", "Spain"}]}, EdgeWeight -> {5.5, 7, 9, 7.5, 14, 12, 6.5, 8}]]Scope (30)
Data (5)
Use geo entities as the vertices in a flow graph:
GeoGraphValuePlot[{{Entity["Building", "MachuPicchu::3243b"], Entity["Building", "EiffelTower::5h9w8"], 1.6}, {Entity["Building", "MachuPicchu::3243b"], Entity["City", {"Reykjavik", "Hofudhborgarsvaedhi", "Iceland"}], 2.5}, {Entity["Building", "MachuPicchu::3243b"], Entity["Airport", "YSSY"], 3}, {Entity["Building", "MachuPicchu::3243b"], Entity["Volcano", "FujiSan"], 5.6}, {Entity["Building", "EiffelTower::5h9w8"], Entity["City", {"Reykjavik", "Hofudhborgarsvaedhi", "Iceland"}], 3.5}, {Entity["Building", "EiffelTower::5h9w8"], Entity["Airport", "YSSY"], 2.7}, {Entity["Building", "EiffelTower::5h9w8"], Entity["Volcano", "FujiSan"], 2.1}, {Entity["Airport", "YSSY"], Entity["Volcano", "FujiSan"], 4.2}}]Use geo locations as the vertices in a graph:
GeoGraphValuePlot[{{GeoPosition[{-13.16, -72.54}], GeoPosition[{48.85, 2.29}], 1.6}, {GeoPosition[{-13.16, -72.54}], GeoPosition[{64.14, -21.92}], 2.5}, {GeoPosition[{-13.16, -72.54}], GeoPosition[{-33.94, 151.17}], 3}, {GeoPosition[{-13.16, -72.54}], GeoPosition[{35.35, 138.73}], 5.6}, {GeoPosition[{48.85, 2.29}], GeoPosition[{64.14, -21.92}], 3.5}, {GeoPosition[{48.85, 2.29}], GeoPosition[{-33.94, 151.17}], 2.7}, {GeoPosition[{48.85, 2.29}], GeoPosition[{35.35, 138.73}], 2.1}, {GeoPosition[{-33.94, 151.17}], GeoPosition[{35.35, 138.73}], 4.2}}]Plot an undirected flow graph:
GeoGraphValuePlot[Graph[{Entity["City", {"Rome", "Lazio", "Italy"}]Entity["City", {"Milan", "Lombardy", "Italy"}], Entity["City", {"Milan", "Lombardy", "Italy"}]Entity["City", {"Paris", "IleDeFrance", "France"}], Entity["City", {"Milan", "Lombardy", "Italy"}]Entity["City", {"Frankfurt", "Hesse", "Germany"}], Entity["City", {"Paris", "IleDeFrance", "France"}]Entity["City", {"Frankfurt", "Hesse", "Germany"}], Entity["City", {"Paris", "IleDeFrance", "France"}]Entity["City", {"Madrid", "Madrid", "Spain"}], Entity["City", {"Paris", "IleDeFrance", "France"}]Entity["City", {"London", "GreaterLondon", "UnitedKingdom"}], Entity["City", {"Madrid", "Madrid", "Spain"}]Entity["City", {"Seville", "Seville", "Spain"}], Entity["City", {"Madrid", "Madrid", "Spain"}]Entity["City", {"Barcelona", "Barcelona", "Spain"}]}, EdgeWeight -> {5.5, 7, 9, 7.5, 14, 12, 6.5, 8}]]Use geo-tagged images as graph vertices:
GeoGraphValuePlot[{{[image], [image], 12.5}, {[image], [image], 12.5}, {[image], [image], 9.3}, {[image], [image], 7.8}, {[image], [image], 12.9}, {[image], [image], 10.2}, {[image], [image], 9.4}, {[image], [image], 16.1}, {[image], [image], 9.1}}, VertexLabels -> Placed[Automatic, Tooltip]]Use VertexCoordinates to position vertices:
GeoGraphValuePlot[{{"The Big Apple", "Emerald City", 7}, {"The Big Apple", "City of Trees", 8}, {"The Big Easy", "Windy City", 5}, {"Wolfram Headquarters", "The Big Apple", 10}, {"Emerald City", "Windy City", 6}, {"Charm City", "Windy City", 4}, {"Windy City", "Wolfram Headquarters", 8}, {"Wolfram Headquarters", "City of Trees", 9}}, VertexCoordinates -> {"The Big Apple" -> Entity["City", {"NewYork", "NewYork", "UnitedStates"}], "Emerald City" -> Entity["City", {"Seattle", "Washington", "UnitedStates"}], "City of Trees" -> Entity["City", {"BoiseCity", "Idaho", "UnitedStates"}], "The Big Easy" -> Entity["City", {"Boston", "Massachusetts", "UnitedStates"}], "Windy City" -> Entity["City", {"Chicago", "Illinois", "UnitedStates"}], "Charm City" -> Entity["City", {"Baltimore", "Maryland", "UnitedStates"}], "Wolfram Headquarters" -> Entity["City", {"Champaign", "Illinois", "UnitedStates"}]}]Labeling (4)
Use Labeled to label a particular edge flow:
flows = {Labeled[{Entity["City", {"Paris", "IleDeFrance", "France"}], Entity["City", {"Madrid", "Madrid", "Spain"}], 14}, "Paris to Madrid"], {Entity["City", {"Rome", "Lazio", "Italy"}], Entity["City", {"Milan", "Lombardy", "Italy"}], 5.5}, {Entity["City", {"Milan", "Lombardy", "Italy"}], Entity["City", {"Paris", "IleDeFrance", "France"}], 7}, {Entity["City", {"Milan", "Lombardy", "Italy"}], Entity["City", {"Frankfurt", "Hesse", "Germany"}], 9}, {Entity["City", {"Paris", "IleDeFrance", "France"}], Entity["City", {"Frankfurt", "Hesse", "Germany"}], 7.5}, {Entity["City", {"Paris", "IleDeFrance", "France"}], Entity["City", {"London", "GreaterLondon", "UnitedKingdom"}], 12}, {Entity["City", {"Madrid", "Madrid", "Spain"}], Entity["City", {"Seville", "Seville", "Spain"}], 6.5}, {Entity["City", {"Madrid", "Madrid", "Spain"}], Entity["City", {"Barcelona", "Barcelona", "Spain"}], 8}};GeoGraphValuePlot[flows]flows = {{Entity["City", {"Paris", "IleDeFrance", "France"}], Entity["City", {"Madrid", "Madrid", "Spain"}], 14}, {Entity["City", {"Rome", "Lazio", "Italy"}], Entity["City", {"Milan", "Lombardy", "Italy"}], 5.5}, {Entity["City", {"Milan", "Lombardy", "Italy"}], Entity["City", {"Paris", "IleDeFrance", "France"}], 7}, {Entity["City", {"Milan", "Lombardy", "Italy"}], Entity["City", {"Frankfurt", "Hesse", "Germany"}], 9}, {Entity["City", {"Paris", "IleDeFrance", "France"}], Entity["City", {"Frankfurt", "Hesse", "Germany"}], 7.5}, {Entity["City", {"Paris", "IleDeFrance", "France"}], Entity["City", {"London", "GreaterLondon", "UnitedKingdom"}], 12}, {Entity["City", {"Madrid", "Madrid", "Spain"}], Entity["City", {"Seville", "Seville", "Spain"}], 6.5}, {Entity["City", {"Madrid", "Madrid", "Spain"}], Entity["City", {"Barcelona", "Barcelona", "Spain"}], 8}};GeoGraphValuePlot[flows, VertexLabels -> Automatic]Use Labeled to label a specific vertex:
flows = {{Labeled[Entity["City", {"Paris", "IleDeFrance", "France"}], "Paris"], Entity["City", {"Madrid", "Madrid", "Spain"}], 14}, {Entity["City", {"Rome", "Lazio", "Italy"}], Entity["City", {"Milan", "Lombardy", "Italy"}], 5.5}, {Entity["City", {"Milan", "Lombardy", "Italy"}], Entity["City", {"Paris", "IleDeFrance", "France"}], 7}, {Entity["City", {"Milan", "Lombardy", "Italy"}], Entity["City", {"Frankfurt", "Hesse", "Germany"}], 9}, {Entity["City", {"Paris", "IleDeFrance", "France"}], Entity["City", {"Frankfurt", "Hesse", "Germany"}], 7.5}, {Entity["City", {"Paris", "IleDeFrance", "France"}], Entity["City", {"London", "GreaterLondon", "UnitedKingdom"}], 12}, {Entity["City", {"Madrid", "Madrid", "Spain"}], Entity["City", {"Seville", "Seville", "Spain"}], 6.5}, {Entity["City", {"Madrid", "Madrid", "Spain"}], Labeled[Entity["City", {"Barcelona", "Barcelona", "Spain"}], "Barcelona"], 8}};GeoGraphValuePlot[flows]Use VertexLabels to label a specific vertex:
GeoGraphValuePlot[{{Entity["City", {"Paris", "IleDeFrance", "France"}], Entity["City", {"Madrid", "Madrid", "Spain"}], 14}, {Entity["City", {"Rome", "Lazio", "Italy"}], Entity["City", {"Milan", "Lombardy", "Italy"}], 5.5}, {Entity["City", {"Milan", "Lombardy", "Italy"}], Entity["City", {"Paris", "IleDeFrance", "France"}], 7}, {Entity["City", {"Milan", "Lombardy", "Italy"}], Entity["City", {"Frankfurt", "Hesse", "Germany"}], 9}, {Entity["City", {"Paris", "IleDeFrance", "France"}], Entity["City", {"Frankfurt", "Hesse", "Germany"}], 7.5}, {Entity["City", {"Paris", "IleDeFrance", "France"}], Entity["City", {"London", "GreaterLondon", "UnitedKingdom"}], 12}, {Entity["City", {"Madrid", "Madrid", "Spain"}], Entity["City", {"Seville", "Seville", "Spain"}], 6.5}, {Entity["City", {"Madrid", "Madrid", "Spain"}], Entity["City", {"Barcelona", "Barcelona", "Spain"}], 8}}, VertexLabels -> {Entity["City", {"Barcelona", "Barcelona", "Spain"}] -> "Barcelona"}]Edge and Vertex Wrappers (4)
GeoGraphValuePlot[{{Tooltip[Entity["City", {"Paris", "IleDeFrance", "France"}], "The city of love"], Entity["City", {"Madrid", "Madrid", "Spain"}], 14}, {Entity["City", {"Rome", "Lazio", "Italy"}], Entity["City", {"Milan", "Lombardy", "Italy"}], 5.5}, {Entity["City", {"Milan", "Lombardy", "Italy"}], Entity["City", {"Paris", "IleDeFrance", "France"}], 7}, {Entity["City", {"Milan", "Lombardy", "Italy"}], Entity["City", {"Frankfurt", "Hesse", "Germany"}], 9}, {Entity["City", {"Paris", "IleDeFrance", "France"}], Entity["City", {"Frankfurt", "Hesse", "Germany"}], 7.5}, {Entity["City", {"Paris", "IleDeFrance", "France"}], Entity["City", {"London", "GreaterLondon", "UnitedKingdom"}], 12}, {Entity["City", {"Madrid", "Madrid", "Spain"}], Entity["City", {"Seville", "Seville", "Spain"}], 6.5}, {Entity["City", {"Madrid", "Madrid", "Spain"}], Entity["City", {"Barcelona", "Barcelona", "Spain"}], 8}}]Give colors for specific vertices:
GeoGraphValuePlot[{{Style[Entity["City", {"Paris", "IleDeFrance", "France"}], Red], Entity["City", {"Madrid", "Madrid", "Spain"}], 14}, {Style[Entity["City", {"Rome", "Lazio", "Italy"}], Green], Entity["City", {"Milan", "Lombardy", "Italy"}], 5.5}, {Entity["City", {"Milan", "Lombardy", "Italy"}], Entity["City", {"Paris", "IleDeFrance", "France"}], 7}, {Entity["City", {"Milan", "Lombardy", "Italy"}], Entity["City", {"Frankfurt", "Hesse", "Germany"}], 9}, {Entity["City", {"Paris", "IleDeFrance", "France"}], Entity["City", {"Frankfurt", "Hesse", "Germany"}], 7.5}, {Entity["City", {"Paris", "IleDeFrance", "France"}], Style[Entity["City", {"London", "GreaterLondon", "UnitedKingdom"}], Blue], 12}, {Style[Entity["City", {"Madrid", "Madrid", "Spain"}], Yellow], Entity["City", {"Seville", "Seville", "Spain"}], 6.5}, {Entity["City", {"Madrid", "Madrid", "Spain"}], Entity["City", {"Barcelona", "Barcelona", "Spain"}], 8}}]Specify colors for specific flow edges:
GeoGraphValuePlot[{Style[{Entity["City", {"Paris", "IleDeFrance", "France"}], Entity["City", {"Madrid", "Madrid", "Spain"}], 14}, Blue], {Entity["City", {"Rome", "Lazio", "Italy"}], Entity["City", {"Milan", "Lombardy", "Italy"}], 5.5}, {Entity["City", {"Milan", "Lombardy", "Italy"}], Entity["City", {"Paris", "IleDeFrance", "France"}], 7}, {Entity["City", {"Milan", "Lombardy", "Italy"}], Entity["City", {"Frankfurt", "Hesse", "Germany"}], 9}, {Entity["City", {"Paris", "IleDeFrance", "France"}], Entity["City", {"Frankfurt", "Hesse", "Germany"}], 7.5}, {Entity["City", {"Paris", "IleDeFrance", "France"}], Entity["City", {"London", "GreaterLondon", "UnitedKingdom"}], 12}, {Entity["City", {"Madrid", "Madrid", "Spain"}], Entity["City", {"Seville", "Seville", "Spain"}], 6.5}, {Entity["City", {"Madrid", "Madrid", "Spain"}], Entity["City", {"Barcelona", "Barcelona", "Spain"}], 8}}]Attach a Hyperlink to a specific flow edge:
GeoGraphValuePlot[{Hyperlink[{Entity["City", {"Paris", "IleDeFrance", "France"}], Entity["City", {"Madrid", "Madrid", "Spain"}], 14}, "https://www.wolframalpha.com/input/?i=paris+to+madrid"], {Entity["City", {"Rome", "Lazio", "Italy"}], Entity["City", {"Milan", "Lombardy", "Italy"}], 5.5}, {Entity["City", {"Milan", "Lombardy", "Italy"}], Entity["City", {"Paris", "IleDeFrance", "France"}], 7}, {Entity["City", {"Milan", "Lombardy", "Italy"}], Entity["City", {"Frankfurt", "Hesse", "Germany"}], 9}, {Entity["City", {"Paris", "IleDeFrance", "France"}], Entity["City", {"Frankfurt", "Hesse", "Germany"}], 7.5}, {Entity["City", {"Paris", "IleDeFrance", "France"}], Entity["City", {"London", "GreaterLondon", "UnitedKingdom"}], 12}, {Entity["City", {"Madrid", "Madrid", "Spain"}], Entity["City", {"Seville", "Seville", "Spain"}], 6.5}, {Entity["City", {"Madrid", "Madrid", "Spain"}], Entity["City", {"Barcelona", "Barcelona", "Spain"}], 8}}]Graph Styling (17)
GeoGraphValuePlot[{Style[{Entity["City", {"Paris", "IleDeFrance", "France"}], Entity["City", {"Madrid", "Madrid", "Spain"}], 14}, Blue], {Entity["City", {"Rome", "Lazio", "Italy"}], Entity["City", {"Milan", "Lombardy", "Italy"}], 5.5}, Style[{Entity["City", {"Milan", "Lombardy", "Italy"}], Entity["City", {"Paris", "IleDeFrance", "France"}], 7}, Purple], {Entity["City", {"Milan", "Lombardy", "Italy"}], Entity["City", {"Frankfurt", "Hesse", "Germany"}], 9}, {Entity["City", {"Paris", "IleDeFrance", "France"}], Entity["City", {"Frankfurt", "Hesse", "Germany"}], 7.5}, {Entity["City", {"Paris", "IleDeFrance", "France"}], Entity["City", {"London", "GreaterLondon", "UnitedKingdom"}], 12}, {Entity["City", {"Madrid", "Madrid", "Spain"}], Entity["City", {"Seville", "Seville", "Spain"}], 6.5}, {Entity["City", {"Madrid", "Madrid", "Spain"}], Entity["City", {"Barcelona", "Barcelona", "Spain"}], 8}}]GeoGraphValuePlot[{{Entity["City", {"Paris", "IleDeFrance", "France"}], Entity["City", {"Madrid", "Madrid", "Spain"}], 14}, {Entity["City", {"Rome", "Lazio", "Italy"}], Entity["City", {"Milan", "Lombardy", "Italy"}], 5.5}, {Entity["City", {"Milan", "Lombardy", "Italy"}], Entity["City", {"Paris", "IleDeFrance", "France"}], 7}, {Entity["City", {"Milan", "Lombardy", "Italy"}], Entity["City", {"Frankfurt", "Hesse", "Germany"}], 9}, {Entity["City", {"Paris", "IleDeFrance", "France"}], Entity["City", {"Frankfurt", "Hesse", "Germany"}], 7.5}, {Entity["City", {"Paris", "IleDeFrance", "France"}], Entity["City", {"London", "GreaterLondon", "UnitedKingdom"}], 12}, {Entity["City", {"Madrid", "Madrid", "Spain"}], Entity["City", {"Seville", "Seville", "Spain"}], 6.5}, {Entity["City", {"Madrid", "Madrid", "Spain"}], Entity["City", {"Barcelona", "Barcelona", "Spain"}], 8}}, EdgeStyle -> Directive[Brown, Dashed]]Set the style for all vertex labels:
GeoGraphValuePlot[{{Entity["City", {"Paris", "IleDeFrance", "France"}], Entity["City", {"Madrid", "Madrid", "Spain"}], 14}, {Entity["City", {"Rome", "Lazio", "Italy"}], Entity["City", {"Milan", "Lombardy", "Italy"}], 5.5}, {Entity["City", {"Milan", "Lombardy", "Italy"}], Entity["City", {"Paris", "IleDeFrance", "France"}], 7}, {Entity["City", {"Milan", "Lombardy", "Italy"}], Entity["City", {"Frankfurt", "Hesse", "Germany"}], 9}, {Entity["City", {"Paris", "IleDeFrance", "France"}], Entity["City", {"Frankfurt", "Hesse", "Germany"}], 7.5}, {Entity["City", {"Paris", "IleDeFrance", "France"}], Entity["City", {"London", "GreaterLondon", "UnitedKingdom"}], 12}, {Entity["City", {"Madrid", "Madrid", "Spain"}], Entity["City", {"Seville", "Seville", "Spain"}], 6.5}, {Entity["City", {"Madrid", "Madrid", "Spain"}], Entity["City", {"Barcelona", "Barcelona", "Spain"}], 8}}, VertexLabels -> "Name", VertexLabelStyle -> Directive[Red, Italic, 8.5]]GeoGraphValuePlot[{{Style[Entity["City", {"Paris", "IleDeFrance", "France"}], Yellow], Entity["City", {"Madrid", "Madrid", "Spain"}], 14}, {Style[Entity["City", {"Rome", "Lazio", "Italy"}], Green], Entity["City", {"Milan", "Lombardy", "Italy"}], 5.5}, {Entity["City", {"Milan", "Lombardy", "Italy"}], Entity["City", {"Paris", "IleDeFrance", "France"}], 7}, {Entity["City", {"Milan", "Lombardy", "Italy"}], Entity["City", {"Frankfurt", "Hesse", "Germany"}], 9}, {Entity["City", {"Paris", "IleDeFrance", "France"}], Style[Entity["City", {"Frankfurt", "Hesse", "Germany"}], Blue], 7.5}, {Entity["City", {"Paris", "IleDeFrance", "France"}], Entity["City", {"London", "GreaterLondon", "UnitedKingdom"}], 12}, {Entity["City", {"Madrid", "Madrid", "Spain"}], Entity["City", {"Seville", "Seville", "Spain"}], 6.5}, {Entity["City", {"Madrid", "Madrid", "Spain"}], Entity["City", {"Barcelona", "Barcelona", "Spain"}], 8}}]Specify the style for individual vertices:
GeoGraphValuePlot[{{Entity["City", {"Paris", "IleDeFrance", "France"}], Entity["City", {"Madrid", "Madrid", "Spain"}], 14}, {Entity["City", {"Rome", "Lazio", "Italy"}], Entity["City", {"Milan", "Lombardy", "Italy"}], 5.5}, {Entity["City", {"Milan", "Lombardy", "Italy"}], Entity["City", {"Paris", "IleDeFrance", "France"}], 7}, {Entity["City", {"Milan", "Lombardy", "Italy"}], Entity["City", {"Frankfurt", "Hesse", "Germany"}], 9}, {Entity["City", {"Paris", "IleDeFrance", "France"}], Entity["City", {"Frankfurt", "Hesse", "Germany"}], 7.5}, {Entity["City", {"Paris", "IleDeFrance", "France"}], Entity["City", {"London", "GreaterLondon", "UnitedKingdom"}], 12}, {Entity["City", {"Madrid", "Madrid", "Spain"}], Entity["City", {"Seville", "Seville", "Spain"}], 6.5}, {Entity["City", {"Madrid", "Madrid", "Spain"}], Entity["City", {"Barcelona", "Barcelona", "Spain"}], 8}}, VertexStyle -> {Entity["City", {"London", "GreaterLondon", "UnitedKingdom"}] -> Blue, Entity["City", {"Rome", "Lazio", "Italy"}] -> Green}]Draw vertices using a predefined vertex function:
GeoGraphValuePlot[{{Entity["City", {"Paris", "IleDeFrance", "France"}], Entity["City", {"Madrid", "Madrid", "Spain"}], 14}, {Entity["City", {"Rome", "Lazio", "Italy"}], Entity["City", {"Milan", "Lombardy", "Italy"}], 5.5}, {Entity["City", {"Milan", "Lombardy", "Italy"}], Entity["City", {"Paris", "IleDeFrance", "France"}], 7}, {Entity["City", {"Milan", "Lombardy", "Italy"}], Entity["City", {"Frankfurt", "Hesse", "Germany"}], 9}, {Entity["City", {"Paris", "IleDeFrance", "France"}], Entity["City", {"Frankfurt", "Hesse", "Germany"}], 7.5}, {Entity["City", {"Paris", "IleDeFrance", "France"}], Entity["City", {"London", "GreaterLondon", "UnitedKingdom"}], 12}, {Entity["City", {"Madrid", "Madrid", "Spain"}], Entity["City", {"Seville", "Seville", "Spain"}], 6.5}, {Entity["City", {"Madrid", "Madrid", "Spain"}], Entity["City", {"Barcelona", "Barcelona", "Spain"}], 8}}, VertexShapeFunction -> "Square", VertexSize -> 0.2]Specify a vertex function for an individual vertex:
GeoGraphValuePlot[{{Entity["City", {"Paris", "IleDeFrance", "France"}], Entity["City", {"Madrid", "Madrid", "Spain"}], 14}, {Entity["City", {"Rome", "Lazio", "Italy"}], Entity["City", {"Milan", "Lombardy", "Italy"}], 5.5}, {Entity["City", {"Milan", "Lombardy", "Italy"}], Entity["City", {"Paris", "IleDeFrance", "France"}], 7}, {Entity["City", {"Milan", "Lombardy", "Italy"}], Entity["City", {"Frankfurt", "Hesse", "Germany"}], 9}, {Entity["City", {"Paris", "IleDeFrance", "France"}], Entity["City", {"Frankfurt", "Hesse", "Germany"}], 7.5}, {Entity["City", {"Paris", "IleDeFrance", "France"}], Entity["City", {"London", "GreaterLondon", "UnitedKingdom"}], 12}, {Entity["City", {"Madrid", "Madrid", "Spain"}], Entity["City", {"Seville", "Seville", "Spain"}], 6.5}, {Entity["City", {"Madrid", "Madrid", "Spain"}], Entity["City", {"Barcelona", "Barcelona", "Spain"}], 8}}, VertexShapeFunction -> {Entity["City", {"Frankfurt", "Hesse", "Germany"}] -> "Square"}, VertexSize -> 0.2]Draw vertices by running a program:
vf[{xc_, yc_}, name_, {w_, h_}] :=
	Block[{xmin = xc - w, xmax = xc + w, ymin = yc - h, ymax = yc + h},
	Inset[name["Country"]["Flag"], {xc, yc}, Automatic, 10 * {w, h}]
];GeoGraphValuePlot[{{Entity["City", {"Paris", "IleDeFrance", "France"}], Entity["City", {"Madrid", "Madrid", "Spain"}], 14}, {Entity["City", {"Rome", "Lazio", "Italy"}], Entity["City", {"Milan", "Lombardy", "Italy"}], 5.5}, {Entity["City", {"Milan", "Lombardy", "Italy"}], Entity["City", {"Paris", "IleDeFrance", "France"}], 7}, {Entity["City", {"Milan", "Lombardy", "Italy"}], Entity["City", {"Frankfurt", "Hesse", "Germany"}], 9}, {Entity["City", {"Paris", "IleDeFrance", "France"}], Entity["City", {"Frankfurt", "Hesse", "Germany"}], 7.5}, {Entity["City", {"Paris", "IleDeFrance", "France"}], Entity["City", {"London", "GreaterLondon", "UnitedKingdom"}], 12}, {Entity["City", {"Madrid", "Madrid", "Spain"}], Entity["City", {"Seville", "Seville", "Spain"}], 6.5}, {Entity["City", {"Madrid", "Madrid", "Spain"}], Entity["City", {"Barcelona", "Barcelona", "Spain"}], 8}}, VertexShapeFunction -> vf]Plot an undirected flow graph:
GeoGraphValuePlot[Graph[{Entity["City", {"Rome", "Lazio", "Italy"}]Entity["City", {"Milan", "Lombardy", "Italy"}], Entity["City", {"Milan", "Lombardy", "Italy"}]Entity["City", {"Paris", "IleDeFrance", "France"}], Entity["City", {"Milan", "Lombardy", "Italy"}]Entity["City", {"Frankfurt", "Hesse", "Germany"}], Entity["City", {"Paris", "IleDeFrance", "France"}]Entity["City", {"Frankfurt", "Hesse", "Germany"}], Entity["City", {"Paris", "IleDeFrance", "France"}]Entity["City", {"Madrid", "Madrid", "Spain"}], Entity["City", {"Paris", "IleDeFrance", "France"}]Entity["City", {"London", "GreaterLondon", "UnitedKingdom"}], Entity["City", {"Madrid", "Madrid", "Spain"}]Entity["City", {"Seville", "Seville", "Spain"}], Entity["City", {"Madrid", "Madrid", "Spain"}]Entity["City", {"Barcelona", "Barcelona", "Spain"}]}, EdgeWeight -> {5.5, 7, 9, 7.5, 14, 12, 6.5, 8}]]Specify a GraphLayout:
GeoGraphValuePlot[{{Entity["City", {"Paris", "IleDeFrance", "France"}], Entity["City", {"Madrid", "Madrid", "Spain"}], 14}, {Entity["City", {"Rome", "Lazio", "Italy"}], Entity["City", {"Milan", "Lombardy", "Italy"}], 5.5}, {Entity["City", {"Milan", "Lombardy", "Italy"}], Entity["City", {"Paris", "IleDeFrance", "France"}], 7}, {Entity["City", {"Milan", "Lombardy", "Italy"}], Entity["City", {"Frankfurt", "Hesse", "Germany"}], 9}, {Entity["City", {"Paris", "IleDeFrance", "France"}], Entity["City", {"Frankfurt", "Hesse", "Germany"}], 7.5}, {Entity["City", {"Paris", "IleDeFrance", "France"}], Entity["City", {"London", "GreaterLondon", "UnitedKingdom"}], 12}, {Entity["City", {"Madrid", "Madrid", "Spain"}], Entity["City", {"Seville", "Seville", "Spain"}], 6.5}, {Entity["City", {"Madrid", "Madrid", "Spain"}], Entity["City", {"Barcelona", "Barcelona", "Spain"}], 8}}, GraphLayout -> "Biking", GeoBackground -> "StreetMapNoLabels"]Use a satellite map for the background:
GeoGraphValuePlot[IconizedObject[«Major coffee exports 2017»], GeoBackground -> "Satellite"]Use the Bonne projection for the map:
GeoGraphValuePlot[IconizedObject[«Major coffee exports 2017»], GeoProjection -> "Bonne"]Use 350 kilometers of padding on each side of the map:
GeoGraphValuePlot[{{Entity["City", {"Paris", "IleDeFrance", "France"}], Entity["City", {"Madrid", "Madrid", "Spain"}], 14}, {Entity["City", {"Rome", "Lazio", "Italy"}], Entity["City", {"Milan", "Lombardy", "Italy"}], 5.5}, {Entity["City", {"Milan", "Lombardy", "Italy"}], Entity["City", {"Paris", "IleDeFrance", "France"}], 7}, {Entity["City", {"Milan", "Lombardy", "Italy"}], Entity["City", {"Frankfurt", "Hesse", "Germany"}], 9}, {Entity["City", {"Paris", "IleDeFrance", "France"}], Entity["City", {"Frankfurt", "Hesse", "Germany"}], 7.5}, {Entity["City", {"Paris", "IleDeFrance", "France"}], Entity["City", {"London", "GreaterLondon", "UnitedKingdom"}], 12}, {Entity["City", {"Madrid", "Madrid", "Spain"}], Entity["City", {"Seville", "Seville", "Spain"}], 6.5}, {Entity["City", {"Madrid", "Madrid", "Spain"}], Entity["City", {"Barcelona", "Barcelona", "Spain"}], 8}}, GeoRangePadding -> Quantity[350, "Kilometers"]]GeoGraphValuePlot[IconizedObject[«West USA major migrations 2012-2016»], GeoGridLines -> Automatic]Specify the spacing between them:
GeoGraphValuePlot[IconizedObject[«West USA major migrations 2012-2016»], GeoGridLines -> {Quantity[0.2, "AngularDegrees"], Quantity[0.3, "AngularDegrees"]}]Specify parallel and meridians rendering:
GeoGraphValuePlot[IconizedObject[«West USA major migrations 2012-2016»], GeoGridLines -> {Quantity[0.2, "AngularDegrees"], Quantity[0.3, "AngularDegrees"]}, GeoGridLinesStyle -> Directive[Dashed, Blue]]GeoGraphValuePlot[IconizedObject[«West USA major migrations 2012-2016»], GeoGridLines -> {Quantity[0.2, "AngularDegrees"], Quantity[0.3, "AngularDegrees"]}, GeoGridLinesStyle -> {Red, Blue}]GeoGraphValuePlot[IconizedObject[«flows»], PlotLegends -> Automatic]Show a color legend when the sizes of flows are None:
GeoGraphValuePlot[IconizedObject[«flows»], EdgeValueSizes -> None, PlotLegends -> Automatic]Options (55)
AspectRatio (3)
By default, the ratio of the height to the width for the plot is determined based on values:
GeoGraphValuePlot[{{Entity["City", {"NewYork", "NewYork", "UnitedStates"}], Entity["City", {"SanDiego", "California", "UnitedStates"}], 2}, {Entity["City", {"NewYork", "NewYork", "UnitedStates"}], Entity["City", {"Seattle", "Washington", "UnitedStates"}], 3}}]Make the height the same as the width with AspectRatio1:
GeoGraphValuePlot[{{Entity["City", {"NewYork", "NewYork", "UnitedStates"}], Entity["City", {"SanDiego", "California", "UnitedStates"}], 2}, {Entity["City", {"NewYork", "NewYork", "UnitedStates"}], Entity["City", {"Seattle", "Washington", "UnitedStates"}], 3}}, AspectRatio -> 1]AspectRatioFull adjusts the height and width to tightly fit inside other constructs:
plot = GeoGraphValuePlot[{{Entity["City", {"NewYork", "NewYork", "UnitedStates"}], Entity["City", {"SanDiego", "California", "UnitedStates"}], 2}, {Entity["City", {"NewYork", "NewYork", "UnitedStates"}], Entity["City", {"Seattle", "Washington", "UnitedStates"}], 3}}, AspectRatio -> Full];
{Framed[Pane[plot, {70, 150}]], Framed[Pane[plot, {150, 150}]], Framed[Pane[plot, {150, 75}]]}
Axes (4)
By default, axes are not drawn for GeoGraphPlot:
GeoGraphValuePlot[{{Entity["City", {"NewYork", "NewYork", "UnitedStates"}], Entity["City", {"SanDiego", "California", "UnitedStates"}], 2}, {Entity["City", {"NewYork", "NewYork", "UnitedStates"}], Entity["City", {"Seattle", "Washington", "UnitedStates"}], 3}}]Use AxesTrue to turn on axes:
GeoGraphValuePlot[{{Entity["City", {"NewYork", "NewYork", "UnitedStates"}], Entity["City", {"SanDiego", "California", "UnitedStates"}], 2}, {Entity["City", {"NewYork", "NewYork", "UnitedStates"}], Entity["City", {"Seattle", "Washington", "UnitedStates"}], 3}}, Axes -> True]Use AxesOrigin to specify where the axes intersect:
GeoGraphValuePlot[{{Entity["City", {"NewYork", "NewYork", "UnitedStates"}], Entity["City", {"SanDiego", "California", "UnitedStates"}], 2}, {Entity["City", {"NewYork", "NewYork", "UnitedStates"}], Entity["City", {"Seattle", "Washington", "UnitedStates"}], 3}}, Axes -> True, AxesOrigin -> {.2, 0}]Turn each axis on individually:
{GeoGraphValuePlot[{{Entity["City", {"NewYork", "NewYork", "UnitedStates"}], Entity["City", {"SanDiego", "California", "UnitedStates"}], 2}, {Entity["City", {"NewYork", "NewYork", "UnitedStates"}], Entity["City", {"Seattle", "Washington", "UnitedStates"}], 3}}, Axes -> {True, False}], GeoGraphValuePlot[{{Entity["City", {"NewYork", "NewYork", "UnitedStates"}], Entity["City", {"SanDiego", "California", "UnitedStates"}], 2}, {Entity["City", {"NewYork", "NewYork", "UnitedStates"}], Entity["City", {"Seattle", "Washington", "UnitedStates"}], 3}}, Axes -> {False, True}]}AxesStyle (4)
Change the style for the axes:
GeoGraphValuePlot[{{Entity["City", {"NewYork", "NewYork", "UnitedStates"}], Entity["City", {"SanDiego", "California", "UnitedStates"}], 2}, {Entity["City", {"NewYork", "NewYork", "UnitedStates"}], Entity["City", {"Seattle", "Washington", "UnitedStates"}], 3}}, Axes -> True, AxesStyle -> Red]Specify the style of each axis:
GeoGraphValuePlot[{{Entity["City", {"NewYork", "NewYork", "UnitedStates"}], Entity["City", {"SanDiego", "California", "UnitedStates"}], 2}, {Entity["City", {"NewYork", "NewYork", "UnitedStates"}], Entity["City", {"Seattle", "Washington", "UnitedStates"}], 3}}, Axes -> True, AxesStyle -> {{Thick, Brown}, {Thick, Blue}}]Use different styles for the ticks and the axes:
GeoGraphValuePlot[{{Entity["City", {"NewYork", "NewYork", "UnitedStates"}], Entity["City", {"SanDiego", "California", "UnitedStates"}], 2}, {Entity["City", {"NewYork", "NewYork", "UnitedStates"}], Entity["City", {"Seattle", "Washington", "UnitedStates"}], 3}}, Axes -> True, AxesStyle -> Green, TicksStyle -> Red]Use different styles for the labels and the axes:
GeoGraphValuePlot[{{Entity["City", {"NewYork", "NewYork", "UnitedStates"}], Entity["City", {"SanDiego", "California", "UnitedStates"}], 2}, {Entity["City", {"NewYork", "NewYork", "UnitedStates"}], Entity["City", {"Seattle", "Washington", "UnitedStates"}], 3}}, Axes -> True, AxesStyle -> Green, LabelStyle -> Red]ClippingStyle (1)
ColorFunction (1)
EdgeShapeFunction (2)
Draw edges using a predefined edge function:
GeoGraphValuePlot[IconizedObject[«West USA major migrations 2012-2016»], EdgeShapeFunction -> {{"HalfFilledArrow", "ArrowSize" -> .1}}]Draw edges by running a program:
ef[pts_List, e_] :=
Block[{s = 0.015, g = [image]}, {Arrowheads[{{s, 0.33, g}, {s, 0.67, g}}], Arrow[pts]}]GeoGraphValuePlot[IconizedObject[«West USA major migrations 2012-2016»], EdgeShapeFunction -> ef]EdgeStyle (1)
EdgeWeight (2)
Label each edge with its weight, in this case corresponding to the distance between vertices:
GeoGraphValuePlot[IconizedObject[«flows»], EdgeWeight -> Table[GeoDistance[e[[1]], e[[2]]], {e, IconizedObject[«flows»]}], EdgeLabels -> "EdgeWeight"]Set the weights of the edges of a flow graph:
GeoGraphValuePlot[Graph[{Entity["City", {"Madrid", "Madrid", "Spain"}]Entity["City", {"Paris", "IleDeFrance", "France"}], Entity["City", {"Paris", "IleDeFrance", "France"}]Entity["City", {"Rome", "Lazio", "Italy"}], Entity["City", {"Rome", "Lazio", "Italy"}]Entity["City", {"Madrid", "Madrid", "Spain"}]}, EdgeWeight -> {Entity["City", {"Madrid", "Madrid", "Spain"}]Entity["City", {"Paris", "IleDeFrance", "France"}] -> 6, Entity["City", {"Paris", "IleDeFrance", "France"}]Entity["City", {"Rome", "Lazio", "Italy"}] -> 8, Entity["City", {"Rome", "Lazio", "Italy"}]Entity["City", {"Madrid", "Madrid", "Spain"}] -> 12}]]EdgeValueRange (1)
EdgeValueSizes (4)
GeoGraphValuePlot[IconizedObject[«flows»], EdgeValueSizes -> None]{GeoGraphValuePlot[IconizedObject[«flows»], EdgeValueSizes -> Tiny], GeoGraphValuePlot[IconizedObject[«flows»], EdgeValueSizes -> Small], GeoGraphValuePlot[IconizedObject[«flows»], EdgeValueSizes -> Medium], GeoGraphValuePlot[IconizedObject[«flows»], EdgeValueSizes -> Large]}GeoGraphValuePlot[IconizedObject[«flows»], EdgeValueSizes -> 0.06]GeoGraphValuePlot[IconizedObject[«flows»], EdgeValueSizes -> {0.03, 0.05}]GeoBackground (1)
Use a vector map style as geo background:
{GeoGraphValuePlot[IconizedObject[«West USA major migrations 2012-2016»], GeoBackground -> "ReliefMap"], GeoGraphValuePlot[IconizedObject[«West USA major migrations 2012-2016»], GeoBackground -> "StreetMap"], GeoGraphValuePlot[IconizedObject[«West USA major migrations 2012-2016»], GeoBackground -> "ContourMap"]}GeoCenter (1)
GeoGridLines (1)
GeoGraphValuePlot[IconizedObject[«West USA major migrations 2012-2016»], GeoGridLines -> Automatic]GeoGraphValuePlot[IconizedObject[«West USA major migrations 2012-2016»], GeoGridLines -> {Quantity[0.25, "AngularDegrees"], Quantity[15, "AngularDegrees"]}]GeoGridLinesStyle (1)
Specify parallel and meridians rendering:
GeoGraphValuePlot[IconizedObject[«West USA major migrations 2012-2016»], GeoGridLines -> {Quantity[0.25, "AngularDegrees"], Quantity[15, "AngularDegrees"]}, GeoGridLinesStyle -> Directive[Dashed, Blue]]GeoGraphValuePlot[IconizedObject[«West USA major migrations 2012-2016»], GeoGridLines -> {Quantity[0.25, "AngularDegrees"], Quantity[15, "AngularDegrees"]}, GeoGridLinesStyle -> {Red, Blue}]GeoModel (1)
GeoProjection (1)
Use the Mercator projection for the map:
GeoGraphValuePlot[IconizedObject[«Major coffee exports 2017»], GeoProjection -> "Mercator"]GeoGraphValuePlot[IconizedObject[«Major coffee exports 2017»], GeoProjection -> "Bonne"]GeoGraphValuePlot[IconizedObject[«Major coffee exports 2017»], GeoProjection -> "Sinusoidal"]GeoRange (2)
GeoGraphValuePlot[IconizedObject[«Major USA flight flows 2018»], GeoRange -> Entity["AdministrativeDivision", {"California", "UnitedStates"}]]Specify the corners of the geo range as geo positions:
GeoGraphValuePlot[IconizedObject[«Major USA flight flows 2018»], GeoRange -> {GeoPosition[{45, -90}], GeoPosition[{35, -70}]}]GeoRangePadding (1)
GraphLayout (2)
Method (1)
MinPointSeparation (2)
Combine vertices that are separated by less than 10% of the overall map size:
GeoGraphValuePlot[{...}, VertexCoordinates -> {...},
	MinPointSeparation -> 0.1]
Show all the vertices in the graph:
GeoGraphValuePlot[{...}, VertexCoordinates -> {...},
	MinPointSeparation -> 0]
PlotLegends (2)
GeoGraphValuePlot[IconizedObject[«flows»], PlotLegends -> Automatic]Show a color legend when the sizes of flows are None:
GeoGraphValuePlot[IconizedObject[«flows»], EdgeValueSizes -> None, PlotLegends -> Automatic]PlotTheme (1)
ScalingFunctions (2)
VertexCoordinates (2)
Use VertexCoordinates to locate vertices:
GeoGraphValuePlot[{{"The Big Apple", "Emerald City", 2.2}, {"The Big Apple", "City of Trees", 1.5}, {"The Big Easy", "The Big Apple", 1.3}, {"Wolfram Headquarters", "The Big Apple", 2.5}, {"Emerald City", "Windy City", 3.6}, {"Charm City", "Windy City", 3}, {"Windy City", "Wolfram Headquarters", 2.8}, {"Wolfram Headquarters", "Wolfram Headquarters", 2.3}}, VertexCoordinates -> {"The Big Apple" -> Entity["City", {"NewYork", "NewYork", "UnitedStates"}], "Emerald City" -> Entity["City", {"Seattle", "Washington", "UnitedStates"}], "City of Trees" -> Entity["City", {"BoiseCity", "Idaho", "UnitedStates"}], "The Big Easy" -> Entity["City", {"Boston", "Massachusetts", "UnitedStates"}], "Windy City" -> Entity["City", {"Chicago", "Illinois", "UnitedStates"}], "Charm City" -> Entity["City", {"Baltimore", "Maryland", "UnitedStates"}], "Wolfram Headquarters" -> Entity["City", {"Champaign", "Illinois", "UnitedStates"}]}]Use VertexCoordinates to specify the location of a vertex:
GeoGraphValuePlot[{{Entity["City", {"Rome", "Lazio", "Italy"}], Entity["City", {"Milan", "Lombardy", "Italy"}], 7.5}, {Entity["City", {"Milan", "Lombardy", "Italy"}], Entity["City", {"Paris", "IleDeFrance", "France"}], 4.5}, {Entity["City", {"Milan", "Lombardy", "Italy"}], Entity["City", {"Frankfurt", "Hesse", "Germany"}], 3.9}, {Entity["City", {"Paris", "IleDeFrance", "France"}], Entity["City", {"Frankfurt", "Hesse", "Germany"}], 5.5}, {Entity["City", {"Paris", "IleDeFrance", "France"}], Entity["City", {"Madrid", "Madrid", "Spain"}], 5}, {Entity["City", {"Paris", "IleDeFrance", "France"}], Entity["City", {"London", "GreaterLondon", "UnitedKingdom"}], 6.8}, {Entity["City", {"Madrid", "Madrid", "Spain"}], Entity["City", {"Seville", "Seville", "Spain"}], 4.8}, {Entity["City", {"Madrid", "Madrid", "Spain"}], Entity["City", {"Barcelona", "Barcelona", "Spain"}], 6.7}, {"Norway Coastline", Entity["City", {"London", "GreaterLondon", "UnitedKingdom"}], 7.3}, {Entity["City", {"Paris", "IleDeFrance", "France"}], "Norway Coastline", 9}}, VertexCoordinates -> {"Norway Coastline" -> GeoPosition[{62.2, 5.4}]}]VertexLabels (2)
VertexLabelStyle (2)
Set the style for all vertex labels:
GeoGraphValuePlot[IconizedObject[«flows»], VertexLabels -> "Name", VertexLabelStyle -> Directive[Red, Italic, 8.5]]Specify the style for individual vertex labels:
GeoGraphValuePlot[IconizedObject[«flows»], VertexLabels -> "Name", VertexLabelStyle -> {Entity["City", {"Paris", "IleDeFrance", "France"}] -> Directive[Red, Italic, 12]}]VertexShape (1)
VertexShapeFunction (3)
Draw vertices using a predefined vertex function:
GeoGraphValuePlot[IconizedObject[«flows»], VertexShapeFunction -> "Square", VertexSize -> 0.2]Specify a vertex function for an individual vertex:
GeoGraphValuePlot[IconizedObject[«flows»], VertexShapeFunction -> {Entity["City", {"Frankfurt", "Hesse", "Germany"}] -> "Square"}, VertexSize -> 0.2]Draw vertices by running a program:
vf[{xc_, yc_}, name_, {w_, h_}] :=
	Block[{xmin = xc - w, xmax = xc + w, ymin = yc - h, ymax = yc + h},
	Inset[name["Country"]["Flag"], {xc, yc}, Automatic, 10 * {w, h}]
];GeoGraphValuePlot[IconizedObject[«flows»], VertexShapeFunction -> vf]VertexSize (1)
Use named sizes for the vertices:
{GeoGraphValuePlot[IconizedObject[«flows»], VertexSize -> Tiny], GeoGraphValuePlot[IconizedObject[«flows»], VertexSize -> Small], GeoGraphValuePlot[IconizedObject[«flows»], VertexSize -> Medium], GeoGraphValuePlot[IconizedObject[«flows»], VertexSize -> Large]}VertexStyle (2)
Set the style for all vertices:
GeoGraphValuePlot[IconizedObject[«flows»], VertexStyle -> Black]Specify the style for individual vertices:
GeoGraphValuePlot[IconizedObject[«flows»], VertexStyle -> {Entity["City", {"Paris", "IleDeFrance", "France"}] -> Blue}]Applications (4)
Display the import partners for the largest world economies:
top8countries = EntityClass["Country", {"GDP" -> TakeLargest[8]}]//EntityListdata = Flatten[Table[With[{importpartnersfraction = CountryData[importer, "ImportPartnersFractions"]},
Block[{exporter, importfraction},
exporter = First[#];
importfraction = Last[#];
{exporter, importer, importfraction}]
& /@ importpartnersfraction
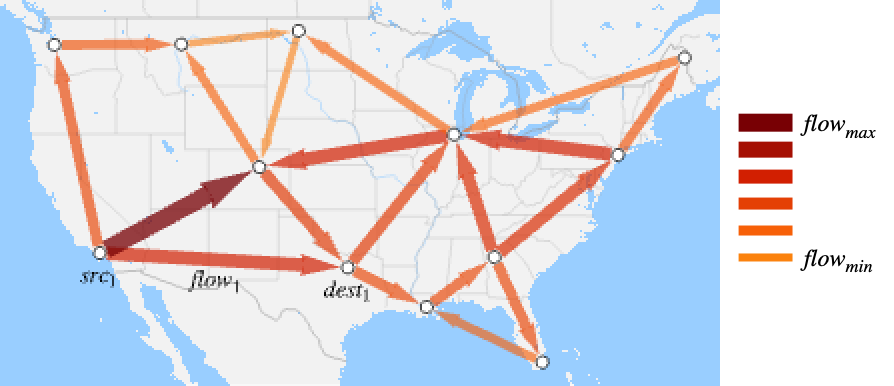
], {importer, top8countries}], 1];GeoGraphValuePlot[data, MinPointSeparation -> 0.04, GraphLayout -> "Geodesic", GeoProjection -> "WinkelTripel", GeoBackground -> "ClassicDark", ColorFunction -> "NeonColors", GeoRange -> All]Show the number of flights in the USA during 2018:
GeoGraphValuePlot[IconizedObject[«USA Flights 2018»], GeoRange -> Entity["Country", "UnitedStates"], MinPointSeparation -> .07, VertexSize -> Medium, ColorFunction -> "DarkRainbow"]Plot the total migration flow greater than 100,000 people around the world:
GeoGraphValuePlot[IconizedObject[«international migration»], MinPointSeparation -> 0.02, Method -> {"MinDisplayedEdgeValue" -> 100000}, GraphLayout -> "Rhumb", EdgeValueSizes -> {0.002, 0.02}, GeoProjection -> "WinkelTripel", ColorFunction -> "TemperatureMap", GeoCenter -> Entity["Country", "UnitedStates"]]Show Minard's visualization of the successive losses of the French Army during the Russian Campaign between 1812 and 1813:
GeoGraphValuePlot[IconizedObject[«Minard data»], GeoBackground -> "StreetMap", Method -> {"MinDisplayedEdgeValue" -> 0},
	ColorFunction -> "Rainbow", EdgeValueSizes -> {0, .04}, MinPointSeparation -> 0, PlotLegends -> Automatic]
Properties & Relations (9)
Use GeoGraphPlot to plot relationships between geographic locations on a map:
GeoGraphPlot[IconizedObject[«nearest US cities»]]Use GeoBubbleChart to show values with scaled bubbles:
states = EntityValue[EntityClass["AdministrativeDivision", "USStatesAllStates"], EntityFunction[e, {e, e["Population"]}]];GeoBubbleChart[states]Use GeoRegionValuePlot to show values with colored regions:
states = EntityValue[EntityClass["AdministrativeDivision", "USStatesAllStates"], EntityFunction[e, {e, e["Population"]}]];GeoRegionValuePlot[states]Use GeoListPlot to show the locations of geographic locations and entities:
GeoListPlot[RandomGeoPosition[100]]Use GeoHistogram to aggregate locations into bins:
pts = RandomGeoPosition[["US"], 500];GeoHistogram[pts, "AdministrativeDivision1"]Use GeoSmoothHistogram to generate smooth densities from locations:
pts = RandomGeoPosition[["US"], 500];GeoSmoothHistogram[pts]Use GeoVectorPlot and GeoStreamPlot for vector fields:
vecs = GeoVectorENU[GeoPosition[{{41.72044646550199, -97.44319222116899},
    {46.35277665685431, -111.4315456426783}, {38.869826216010324, -106.10009940692615},
    {31.787574043650135, -96.48279364395346}, {39.852469082609225, -93.15525687634982},
   ... 25157985637201197},
   {0.4901023278760972, 0.9891989981823661}, {0.8720928861484118, 0.30133102014639235},
   {-0.9277032216653329, -0.5872478295734753}, {0.947583037831254, -0.6748021812104095},
{-0.6838608673381241, 0.12312620699389898}}];{GeoVectorPlot[vecs], GeoStreamPlot[vecs]}Draw contours on a map with GeoContourPlot:
GeoContourPlot[IconizedObject[«locs»] -> IconizedObject[«vals»]]Smoothly shade a map using color with GeoDensityPlot:
GeoDensityPlot[IconizedObject[«locs»] -> IconizedObject[«vals»]]Text
Wolfram Research (2021), GeoGraphValuePlot, Wolfram Language function, https://reference.wolfram.com/language/ref/GeoGraphValuePlot.html.
CMS
Wolfram Language. 2021. "GeoGraphValuePlot." Wolfram Language & System Documentation Center. Wolfram Research. https://reference.wolfram.com/language/ref/GeoGraphValuePlot.html.
APA
Wolfram Language. (2021). GeoGraphValuePlot. Wolfram Language & System Documentation Center. Retrieved from https://reference.wolfram.com/language/ref/GeoGraphValuePlot.html