



ListLinePlot
ListLinePlot[{y1,…,yn}]
点{1,y1}, …, {n,yn}を通る線をプロットする.
ListLinePlot[{{x1,y1},…,{xn,yn}}]
点{x1,y1}, …, {xn,yn}を通る線をプロットする.
ListLinePlot[{data1,data2,…}]
すべての dataiからの線をプロットする.
ListLinePlot[{…,w[datai,…],…}]
記号的ラッパー w で定義された特徴を持つ dataiをプロットする.
詳細とオプション
- ListLinePlotは線プロットあるいは線グラフとしても知られている.
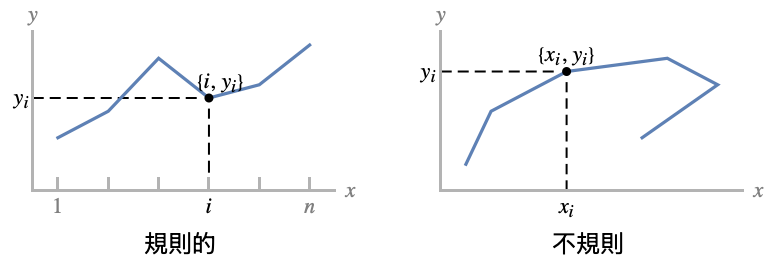
- 規則的なデータ{y1,…,yn}は点{i,yi}を通る関数的曲線としてプロットされる.
- 不規則データ{{x1,y1},…,{xn,yn}}は点{xi,yi}を通る自由形式の曲線としてプロットされる.
- データの値 xiと yiは次の形式で与えることができる.
-
xi 実数値の数 Quantity[xi,unit] 単位のある数量 Around[xi,ei] 不確かさが eiの値 xi Interval[{xmin,xmax}] xminから xmaxまでの値 - 上記の形式ではない値 xiと yiは欠落しているとみなされ,表示されない.
- dataiは次の形式と解釈を持つ.
-
<"k1"y1,"k2"y2,…> 値{y1,y2,…} <x1y1,x2y2,…> キーと値のペア{{x1,y1},{x2,y2},…} {y1"lbl1",y2"lbl2",…}, {y1,y2,…}{"lbl1","lbl2",…} ラベル{lbl1,lbl2,…}が付いた値{y1,y2,…} SparseArray 正規配列としての値 TimeSeries, EventSeries 時と値のペア QuantityArray 大きさ WeightedData 重みのない値 - ListLinePlot[Tabular[…]cspec]は,列指定 cspec を使って表オブジェクトから値を抽出し,これをプロットする.
- 次は,表データのプロットに使用可能な列指定 cspec の形式である.
-
{colx,coly} 列 y と列 x をプロットする {{colx1,coly1},{colx2,coly2},…} 列 y1と列x1,列 y2と列 x2をプロットする等 coly, {coly} 列 y を一連の値としてプロットする {{coly1},…,{colyi},…} 列 y1, y2, …を一連の値としてプロットする - colxはAutomaticでもよい.この場合は,DataRangeを使って一連の値が生成される.
- ListLinePlot[TimeSeries[…]cspec]およびListLinePlot[EventSeries[…]cspec]は,成分指定 cspec によって時系列および事象系列から値を抽出してプロットする.
- 次は,列データのプロットに使える成分指定 cspec の形式である.
-
com タイムスタンプに対するプロット成分 com {com1,com2,…} タイムスタンプに対して書く成分 comiをプロットする - dataiには次のラッパー w を使うことができる.
-
Annotation[datai,label] データについての注釈を与える Button[datai,action] データがクリックされた際に実行するアクションを定義する Callout[datai,label] コールアウトでデータにラベルを付ける Callout[datai,label,pos] 相対位置 pos にコールアウトを置く EventHandler[datai,events] データの一般的なイベントハンドラを定義する Highlighted[datai,effect] 効果を使って fiを動的にハイライトする Highlighted[datai,Placed[effect,pos]] 効果を使って位置 pos の fiを静的にハイライトする Hyperlink[datai,uri] データをハイパーリンクにする Labeled[datai,label] データにラベルを付ける Labeled[datai,label,pos] ラベルを相対位置 pos に置く Legended[datai,label] データを凡例で識別する PopupWindow[datai,cont] データにポップアップウィンドウを付ける StatusArea[datai,label] マウスが来たときにステータスエリアに表示する Style[datai,styles] 指定したスタイルを使ってデータを示す Tooltip[datai,label] 曲線にツールチップを付ける - ラッパー w は複数のレベルで適用することができる.
-
{…,w[yi],…} データの値 yiを囲む {…,w[{xi,yi}],…} 点{xi,yi}を囲む w[datai] データを囲む w[{data1,…}] dataiの集合を囲む w1[w2[…]] ネストしたラッパーを使う - Callout,LabeledとPlacedには次の位置 pos が使える.
-
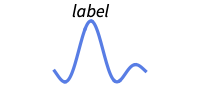
Above 曲線の上の位置 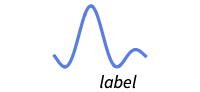
Below 曲線の下の位置 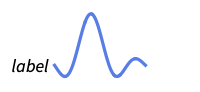
Before 曲線の前の位置 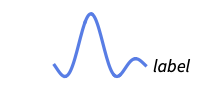
After 曲線の後ろの位置 
"Start" 各曲線の開始位置 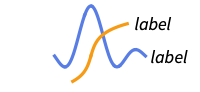
"End" 各曲線の終了位置 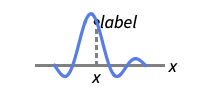
x 位置 x における曲線の近く 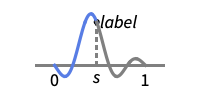
Scaled[s] 曲線に沿ってスケールされた位置 s 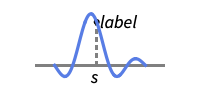
{s,Above} 曲線に沿った位置 s と相対的な位置の上 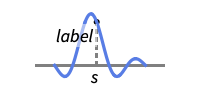
{s,Below} 曲線に沿った位置 s と相対的な位置の下 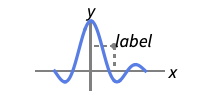
{pos,epos} 曲線の相対位置 pos に置かれたラベルの中の epos - ListLinePlotには,Graphicsと同じオプションに以下の追加・修正を加えたものが使われる. [全オプションのリスト]
- DataRangeは,値{y1,…,yn}をどのように{{x1,y1},…,{xn,yn}}と解釈するかを決定する.次は使用可能な設定である.
-
Automatic,All 1から n まで一様に {xmin,xmax} xminから xmaxまで一様に - 一般に,ペアのリスト{{x1,y1},{x2,y2},…}は点のリストとして解釈されるが,DataRangeAllという設定はそれを複数のデータソース{{y11,y12},{y21,y23},…}として解釈するように強制する. »
- LabelingFunction->f は,各点に f[value,index,lbls]で与えられたラベルを付けるように指定する.ただし,value は点に関連付けた値,index は data 内の位置,lbls は関係するラベルのリストである.
- 以下は,単一のプロットパネル中に複数の曲線を表示する際のPlotLayoutの可能な設定である.
-
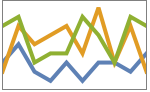
"Overlaid" すべてのデータを重ねて表示する 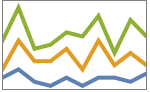
"Stacked" データを積み重ねる 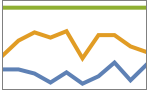
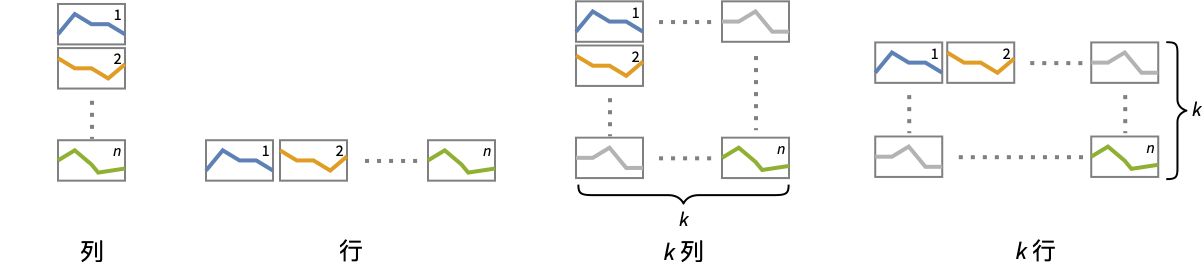
"Percentile" データを積み重ねて正規化する - 次は,複数のプロットパネル中に単一の曲線を表示する際のPlotLayoutの可能な設定である.
-
"Column" パネルの列で別々の曲線を使う "Row" パネルの行で別々の曲線を使う {"Column",k},{"Row",k} k 本の列または行を使う {"Column",UpTo[k]},{"Row",UpTo[k]} 最高で k 本の列または行を使う - HighlightedとPlotHighlightingの可能なハイライト効果には以下がある.
-
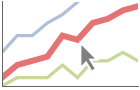
style 指定された曲線をハイライトする 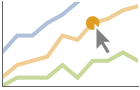
"Ball" 曲線上の指定された点をハイライトしてラベルを付ける 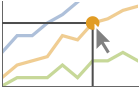
"Dropline" 曲線上の指定された点にラベルを付け,軸へのドロップラインでハイライトする 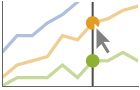
"XSlice" 垂直スライスに沿ったすべての点をハイライトしてラベルを付ける 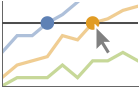
"YSlice" 水平スライスに沿ったすべての点をハイライトしてラベルを付ける 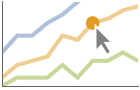
Placed[effect,pos] 指定の位置 pos を静的にハイライトする - PlotLegendsのよく使われる設定値
-
None 凡例は付けない Automatic 凡例を自動的に決定する {lbl1,lbl2,…} 凡例のラベルとして lbl1, lbl2, …を使う Placed[lspec,…] 凡例の置き方を指定する - PlotStylesty は,各曲線に使用するスタイルを指定する.次は,使用可能な設定である.
-
{sty1,sty2,…} データ集合についてのスタイルのシーケンス <"key"val,…> データの異なるレベルについてのスタイル要素 - 次は,使用可能なキーである.
-
"Base" 全データ dataiの全体的なスタイル "Lists" 各 dataiについてのスタイル styiのリスト - ColorData["DefaultPlotColors"]は,PlotStyleで使われるデフォルトの色のシーケンスを与える.
- ScalingFunctions->"scale" が
 座標をスケールする.ScalingFunctions{"scalex","scaley"}は
 座標と
 座標の両方をスケールする.
全オプションのリスト
例題
すべて開く すべて閉じる例 (6)

ListLinePlot[{1, 1, 2, 3, 5, 8}]ListLinePlot[Prime[Range[25]], Filling -> Axis]

ListLinePlot[Table[{Cos[k 2Pi / 7], Sin[k 2Pi / 7]}, {k, 0, 21, 3}], Frame -> True, Axes -> False]ListLinePlot[Table[Accumulate[RandomReal[{-1, 1}, 250]], {3}], Filling -> Axis, PlotLegends -> {"one", "two", "three"}]ListLinePlot[{Labeled[Sqrt[Range[40]], "sqrt"], Labeled[Log[Range[40, 80]], "log"]}, PlotLayout -> "Row"]ListLinePlot[Quantity[{0, 3, 6, 8, 10, 11, 11, 16, 20, 22}, "Centimeters"], AxesLabel -> Automatic]スコープ (58)
一般的なデータ (10)
ListLinePlot[{1, 2, 3, 5, 8, 13, 21}]

ListLinePlot[{{1, 1}, {2, 2}, {3, 4}, {5, 8}, {8, 16}, {13, 32}, {21, 64}}]ListLinePlot[{{1, 2, 3, 5, 8, 13, 21}, {1, 2, 4, 8, 16, 32, 64}}]ListLinePlot[{1, 2, 3, 4, 25, 8, 9}]ListLinePlot[{1, 2, 4, 3, 5, 9, 8, 7}, DataRange -> {0, 1}]ListLinePlot[{1, 2, 3, None, 5, 6, Missing["NotAvailable"], 8, 9}]InterpolationOrderを使ってデータを平滑化する:
{ListLinePlot[{1, 2, 4, 7, 3, 5, 8, 10, 9}], ListLinePlot[{1, 2, 4, 7, 3, 5, 8, 10, 9}, InterpolationOrder -> 2]}MaxPlotPointsを使って使用する点の数を制限する:
ListLinePlot[Table[Sin[5x], {x, 0, 2Pi, 0.1}], MaxPlotPoints -> 10]ListLinePlot[Table[{x, Sin[5x]}, {x, 0, 2Pi, 0.1}], MaxPlotPoints -> 10]PlotRangeを使って関心領域に焦点を当てる:
{ListLinePlot[Table[x ^ 4 - x ^ 2 + 1, {x, -2, 2, 0.1}]], ListLinePlot[Table[x ^ 4 - x ^ 2 + 1, {x, -2, 2, 0.1}], PlotRange -> {0, 2}]}ScalingFunctionsを使って軸をスケールする:
ListLinePlot[Factorial[Range[20]], ScalingFunctions -> "Log"]表形式データ (3)
timings = Tabular[IconizedObject[«timings»], {"vertices", "edges", "connected", "edge coloring", "spanning tree", "shortest tour"}]ListLinePlot[timings -> {"vertices", "edge coloring"}]ListLinePlot[timings -> "edge coloring"]ListLinePlot[timings -> {{"vertices", "edge coloring"}, {"vertices", "shortest tour"}}, MultiaxisArrangement -> All]TimeSeriesまたはEventSeriesの全データをプロットする:
ListLinePlot[TimeSeries[TimeEventSeries`TimestampData[Association["UniformlySpacedQ" -> False,
   "Timestamps" -> TabularColumn[Association[
      "Data" -> {7, {{NumericArray[{-248, 118, 298, 638, 865, 1006, 1216}, "Integer32"], {},
          None}}, None},  ...   "Data" -> {{32, 62, 112, 167, 179, 209, 214}, {}, None}, "ElementType" -> "Integer64"]],
         TabularColumn[Association["Data" -> {{30, 49, 81, 125, 142, 174, 177}, {}, None},
"ElementType" -> "Integer64"]]}}]]]], Association[]]]TimeSeriesまたはEventSeriesの特定の成分をプロットする:
trees = TimeSeries[TimeEventSeries`TimestampData[Association["UniformlySpacedQ" -> False,
   "Timestamps" -> TabularColumn[Association[
      "Data" -> {7, {{NumericArray[{-248, 118, 298, 638, 865, 1006, 1216}, "Integer32"], {},
          None}}, None},  ...   "Data" -> {{32, 62, 112, 167, 179, 209, 214}, {}, None}, "ElementType" -> "Integer64"]],
         TabularColumn[Association["Data" -> {{30, 49, 81, 125, 142, 174, 177}, {}, None},
"ElementType" -> "Integer64"]]}}]]]], Association[]];ListLinePlot[trees -> "tree 1"]ListLinePlot[trees -> {"tree 1", "tree 2"}]特殊データ (9)
Quantityを使ってデータに単位を加える:
ListLinePlot[Quantity[Sqrt[Range[10]], "Meters"], AxesLabel -> Automatic]data = EntityValue[EntityClass["Element", All], {"AtomicMass", "MeltingPoint"}];ListLinePlot[data, AxesLabel -> Automatic]QuantityArray中のデータをプロットする:
data = QuantityArray[EntityValue[EntityClass["Element", All], {"AtomicMass", "MeltingPoint"}]]ListLinePlot[data, AxesLabel -> Automatic]TargetUnitsで使われる単位を指定する:
ListLinePlot[data, TargetUnits -> {Automatic, "Kelvin"}, AxesLabel -> Automatic]ListLinePlot[Table[Around[RandomReal[5], RandomReal[0.5]], 20]]ListLinePlot[Table[Interval[RandomReal[5] + {-0.5, 0.5}], 20]]ListLinePlot[Table[Interval[RandomReal[5] + {-0.5, 0.5}], 20], IntervalMarkers -> "Bands"]ListLinePlot[{2 -> "a", 3 -> "b", 5 -> "c", 7 -> "d", 11 -> "e", 13 -> "f", 17 -> "g"}]ListLinePlot[{2, 3, 5, 7, 11, 13, 17} -> {"a", "b", "c", "d", "e", "f", "g"}]ListLinePlot[{2, 3, 5, 7, 11, 13, 17} -> {"a", "b", "c", "d", "e", "f", "g"}, LabelingFunction -> Below]Association中の数値は y 座標として使われる:
ListLinePlot[<|"a" -> 2, "b" -> 3, "c" -> 5, "d" -> 7, "e" -> 11, "f" -> 13|>]Association中の数値キーと値は x 座標と y 座標として使われる:
ListLinePlot[<|2 -> 1, 3 -> 2, 5 -> 3, 7 -> 4, 11 -> 5, 13 -> 6|>]TimeSeriesを自動日付目盛で直接プロットする:
data = CountryData["UnitedStates", {{"Population"}, {1988, 2013}}]ListLinePlot[data, AxesLabel -> Automatic]SparseArray中のデータをプロットする:
ListLinePlot[SparseArray[Table[Prime[i] -> 1, {i, 25}]]]WeightedData中の重みは無視される:
ListLinePlot[WeightedData[{2, 3, 5, 7, 11, 13, 17, 19, 23, 29}, {1, 2, 3, 4, 5, 6, 7, 8, 9, 10}]]データのラッパー (7)
{ListLinePlot[{Style[{1, 2, 3}, Green], {4, 5, 6}}], ListLinePlot[Style[{{1, 2, 3}, {4, 5, 6}}, Blue]]}ListLinePlot[Tooltip[Prime[Range[20]]], Mesh -> Full]ListLinePlot[Tooltip[Prime[Range[20]], "primes"]]PopupWindowを使って追加的なドリルダウン情報を与える:
ListLinePlot[PopupWindow[{1, 2, 3}, DateListPlot[FinancialData["IBM", "Jan. 1, 2004"]]]]Buttonを使って任意のアクションを引き起こすことができる:
ListLinePlot[Button[{1, 2, 3}, Speak["Hello"]]]マウスがプロット内に入ったときに,Annotationを動的アクションに使う:
{ListLinePlot[Annotation[Prime[Range[20]], "label", "Mouse"]], Dynamic[MouseAnnotation[]]}Hyperlinkを使って,クリックされたときに指定されたリンクにジャンプする:
ListLinePlot[Hyperlink[Prime[Range[20]], "http://www.wolfram.com"]]StatusAreaを使って現行ノートブックのステータスエリアに文字列を表示する:
ListLinePlot[StatusArea[Prime[Range[20]], "String"]]ラベルと凡例 (14)
Labeledでデータソースにラベルを付ける:
data = Table[Table[{x, f}, {x, 0, 2Pi, 0.1}], {f, {Sin[x], Sin[2x]}}];ListLinePlot[MapThread[Labeled[#1, #2]&, {data, {Sin[x], Sin[2x]}}]]PlotLabelsでラベルを指定する:
data = Table[Table[{x, f}, {x, 0, 2Pi, 0.1}], {f, {Sin[x], Sin[2x]}}];ListLinePlot[data, PlotLabels -> {Sin[x], Sin[2x]}]ListLinePlot[Labeled[Table[{x, Sin[x]}, {x, 0, 2Pi, 0.1}], "sin(x)", 3]]ListLinePlot[Labeled[Table[{x, Sin[x]}, {x, 0, 2Pi, 0.1}], "sin(x)", Scaled[0.25]]]ListLinePlot[Labeled[Table[{x, Sin[x]}, {x, 0, 2Pi, 0.1}], Sin[x], {Scaled[0.25], Above}]]Calloutで自動的にデータにラベルを付ける:
ListLinePlot[{Callout[Table[PartitionsQ[n], {n, 18}], PartitionsQ[n]], Callout[Table[n, {n, 18}], n]}]ListLinePlot[Callout[Table[n ^ Sin[n], {n, 1, 10, 0.25}], "label", Above]]ListLinePlot[Callout[Table[n ^ Sin[n], {n, 1, 10, 0.25}], "label", 25]]LabelingFunctionでラベルの名前を指定する:
ListLinePlot[Prime[Range[10]], LabelingFunction -> (#1 &)]data = Table[Labeled[Prime[i], RandomWord[]], {i, 10}];ListLinePlot[data, LabelingSize -> 30]ListLinePlot[data, LabelingSize -> Full]data = Table[Table[{x, f}, {x, 0, 2Pi, 0.1}], {f, {Sin[x], Sin[2x]}}];ListLinePlot[data, PlotLegends -> {Sin[x], Sin[2x]}]Legendedを使って指定されたデータ集合に凡例を加える:
upper = RandomReal[{1.5, 2}, 50];
lower = RandomReal[0.5, 50];ListLinePlot[{lower, Legended[Mean[{lower, upper}], "average"], upper}]Placedを使って凡例の位置を変える:
ListLinePlot[{lower, Legended[Mean[{lower, upper}], Placed["average", Below]], upper}]ListLinePlot[<|"fibonacci" -> Fibonacci[Range[10]], "primes" -> Prime[Range[10]]|>, PlotLabels -> Automatic, PlotLegends -> None]プロットには,通常,マウスオーバーされた座標を示すインタラクティブなコールアウトが付いている:
ListLinePlot[{...}]特定のラッパーやツールチップのようなインタラクションを含めることでインタラクティブな特徴がオフにできる:
ListLinePlot[Callout[{...}, "hello", 13]]{ListLinePlot[{{...}, {...}}, PlotHighlighting -> "Dropline"], ListLinePlot[{{...}, {...}}, PlotHighlighting -> "XSlice"]}Highlightedを使ってプロット中の特定の点を強調する:
ListLinePlot[Highlighted[{...}, Placed["Ball", 7]]]ListLinePlot[Highlighted[{...}, Placed["Ball", {{7}, {17}}]]]プレゼンテーション (15)
data = Table[Table[{x, f}, {x, 0, 2Pi, 0.1}], {f, {Sin[x], Sin[2x]}}];ListLinePlot[data]data = Table[Table[{x, f}, {x, 0, 2Pi, 0.1}], {f, {Sin[x], Sin[2x]}}];ListLinePlot[data, PlotStyle -> {Dashed, Red}]ListLinePlot[{Prime[Range[20]], Range[20]}, PlotTheme -> "Marketing"]data = Table[Table[{x, f}, {x, 0, 2Pi, 0.1}], {f, {Sin[x], Sin[2x]}}];ListLinePlot[data, PlotLegends -> {Sin[x], Sin[2x]}]Legendedを使って特定のデータ集合に凡例を与える:
upper = RandomReal[{1.5, 2}, 50];
lower = RandomReal[0.5, 50];ListLinePlot[{lower, Legended[Mean[{lower, upper}], "average"], upper}]ListLinePlot[Table[{k, Binomial[15, k]}, {k, 0, 15}], AxesLabel -> {k, None}, PlotLabel -> Binomial[15, k]]データにインタラクティブなTooltipを加える:
ListLinePlot[Tooltip[Table[If[PrimeQ[x], Tooltip[x, Row[{"prime: ", x}]], x], {x, 1, 25}]], Mesh -> All]ListLinePlot[{Tooltip[{1, 2, 4, 8, 16, 32, 64}, TraditionalForm[2 ^ k]], Tooltip[{1, 2, 3, 5, 8, 13, 21}, TraditionalForm[Fibonacci[k]]]}, Mesh -> Full]ListLinePlot[{{1, 2, 4, 8, 16, 32, 64}, {1, 2, 3, 5, 8, 13, 21}}, Filling -> {1 -> {2}}]ListLinePlot[{1, 2, 3, 5, 8, 13, 21}, Mesh -> 10]ListLinePlot[{Tooltip[{1, 2, 4, 8, 16, 32, 64}, TraditionalForm[2 ^ k]], Tooltip[{1, 2, 3, 5, 8, 13, 21}, TraditionalForm[Fibonacci[k]]]}, Mesh -> Full, PlotMarkers -> Automatic]ListLinePlot[{1, 2, 3, 5, 8, 13, 21}, Mesh -> 10, MeshShading -> {Red, None, Blue}]ListLinePlot[{IconizedObject[«walk #1»], IconizedObject[«walk #2»]}, PlotLayout -> "Row"]ListLinePlot[{IconizedObject[«walk #1»], IconizedObject[«walk #2»]}, PlotLayout -> "Column"]ListLinePlot[{IconizedObject[«walk #1»], IconizedObject[«walk #2»], IconizedObject[«walk #3»], IconizedObject[«walk #4»]}, PlotLayout -> {"Row", 2}]data = {{10, 9, 4, 3, 5, 3, 5, 5, 2, 6}, {2, 10, 5, 6, 9, 4, 9, 3, 7, 2}, {7, 8, 3, 4, 4, 2, 6, 3, 8, 7}};ListLinePlot[data, PlotLayout -> "Stacked", Joined -> True]ListLinePlot[data, PlotLayout -> "Percentile", Joined -> True]ListLinePlot[{Prime[Range[10]], Range[10] ^ 2}, MultiaxisArrangement -> All]ListLinePlot[{Range[10], Prime[Range[10]], Range[10] ^ 2}, MultiaxisArrangement -> {Right -> {1, 2}, Left -> 3}]ListLinePlot[{Range[10], Prime[Range[10]], Range[10] ^ 2}, MultiaxisArrangement -> {Right -> {{1, 2}}, Left -> 3}]オプション (162)
ClippingStyle (5)
ListLinePlot[Table[{x, Sin[x] / x ^ 2}, {x, -10, 10, 0.2}], ClippingStyle -> None]//QuietListLinePlot[Table[{x, Sin[x] / x ^ 2}, {x, -10, 10, 0.2}], ClippingStyle -> Automatic, PlotStyle -> Thick]//QuietListLinePlot[Table[{x, Sin[x] / x ^ 2}, {x, -10, 10, 0.2}], ClippingStyle -> Red]//QuietListLinePlot[Table[{x, Sin[x] / x ^ 2}, {x, -10, 10, 0.2}], ClippingStyle -> {Red, Thick}]//QuietListLinePlot[Table[{x, Sin[x] / x ^ 2}, {x, -10, 10, 0.2}], ClippingStyle -> Directive[Red, Thick]]//QuietColorFunction (5)


Table[ListLinePlot[Sinc[Range[0, 10, 0.1]], ColorFunction -> Function[{x, y}, f], PlotLabel -> f, PlotStyle -> Thick], {f, {Hue[x], Hue[y]}}]ListLinePlot[Sinc[Range[0, 10, 0.1]], ColorFunction -> "DarkRainbow"]ListLinePlot[Sinc[Range[0, 10, 0.1]], ColorFunction -> Function[{x, y}, Hue[x]], Filling -> Axis]ListLinePlot[Array[Prime, 100], ColorFunction -> Function[{x, y}, Blend[{Yellow, Red}, x]], Filling -> Axis]ColorFunctionは,曲線の色付けに関してはPlotStyleよりも優先順位が高い:
ListLinePlot[Sinc[Range[0, 10, 0.1]], ColorFunction -> "DarkRainbow", PlotStyle -> Directive[Red, Thick]]ColorFunctionを使うためには,MeshShadingをAutomaticにする:
ListLinePlot[Sin[Range[0, 10, 0.1]], ColorFunction -> "Rainbow", PlotStyle -> Directive[Red, Thick], Mesh -> 10, MeshShading -> {Automatic, StandardGray}, MeshStyle -> None]ColorFunctionScaling (2)

ListLinePlot[Table[x ^ 2Exp[-x ^ 2], {x, -5, 5, 0.1}], ColorFunction -> Function[{x, y}, Hue[y]], PlotStyle -> Thick, ColorFunctionScaling -> True]
ListLinePlot[Table[x ^ 2Exp[-x ^ 2], {x, -5, 5, 0.1}], ColorFunction -> Function[{x, y}, Hue[y]], PlotStyle -> Thick, ColorFunctionScaling -> False]DataRange (5)
ListLinePlot[Table[Sin[x], {x, 0, 2Pi, 0.1}]]ListLinePlot[Table[Sin[x], {x, 0, 2Pi, 0.1}], DataRange -> {0, 2Pi}]ListLinePlot[{{1, 2, 3}, {4, 5, 6, 7}, {8, 9, 10, 11, 12}}, DataRange -> {0, 1}]

ListLinePlot[{{1, 1}, {2, 2}, {3, 2}}] の値がデータの一部なので,この場合はDataRangeを指定しても効果はない:
ListLinePlot[{{1, 1}, {2, 2}, {3, 2}}, DataRange -> {0, 1}]ListLinePlot[{{1, 1}, {2, 2}, {3, 2}}, DataRange -> All, AxesOrigin -> {0, 0}]Filling (8)
Table[ListLinePlot[Table[Prime[n], {n, 30}], Filling -> c], {c, {Top, Bottom, Axis, Prime[15]}}]ListLinePlot[{Table[Sin[n / 3], {n, 20}], Table[Cos[n / 3], {n, 20}]}, Filling -> Axis]ListLinePlot[{Table[Sin[n / 3], {n, 20}], Table[Cos[n / 3], {n, 20}]}, Filling -> {1 -> Axis}]ListLinePlot[{Table[Sin[n / 3], {n, 20}], Table[Cos[n / 3], {n, 20}]}, Filling -> {1 -> {2}}]ListLinePlot[{Table[Sin[n / 3], {n, 20}], Table[Cos[n / 3], {n, 20}]}, Filling -> {1 -> {{2}, StandardCyan}}]
ListLinePlot[{Table[Sin[n / 3], {n, 20}], Table[Cos[n / 3], {n, 20}]}, Filling -> {1 -> {1 / 2, Orange}}]曲線1と2の間を塗り潰す.曲線1が曲線2の下になっている部分を黄色で,その逆の部分を緑で塗り潰す:
ListLinePlot[{Table[Sin[n / 3], {n, 20}], Table[Cos[n / 3], {n, 20}]}, Filling -> {1 -> {{2}, {StandardYellow, StandardGreen}}}]ListLinePlot[{Table[{i, i ^ 2 + 1}, {i, 0, 5}], Table[{i, i ^ 2 - 20}, {i, 2, 7}]}, Filling -> {1 -> {2}}]FillingStyle (4)
Table[ListLinePlot[Table[{x, Sin[x]}, {x, 0, 2Pi, 0.1}], Filling -> Axis, FillingStyle -> c], {c, {Red, StandardGreen, Blue, StandardYellow}}]ListLinePlot[{Table[{x, Sin[x]}, {x, 0, 2Pi, 0.1}], Table[{x, Cos[x]}, {x, 0, 2Pi, 0.1}]}, Filling -> Axis, FillingStyle -> Directive[Opacity[0.5], Orange]]ListLinePlot[Table[{x, Sin[x]}, {x, 0, 2Pi, 0.1}], Filling -> Axis, FillingStyle -> {Red, Blue}]ColorFunctionから得られる変数の塗り潰しスタイルを使う:
ListLinePlot[Table[{x, Sin[x]}, {x, 0, 2Pi, 0.1}], ColorFunction -> Function[{x, y}, Hue[y]], Filling -> Axis, FillingStyle -> Automatic]InterpolationOrder (3)
ListLinePlot[{{1, 4, 2, 3, 10, 8, 2}}, Mesh -> Full]ListLinePlot[{{1, 4, 2, 3, 10, 8, 2}}, InterpolationOrder -> 2, Mesh -> Full]ListLinePlot[{{1, 4, 2, 3, 10, 8, 2}}, InterpolationOrder -> 0, Mesh -> Full]IntervalMarkers (3)
ListLinePlot[Table[Around[RandomReal[], 0.1], 10]]ListLinePlot[Table[Around[RandomReal[], 0.1], 10], IntervalMarkers -> "Bars"]ListLinePlot[Table[Around[RandomReal[], .1], 10], IntervalMarkers -> "Bands"]IntervalMarkersStyle (2)
ListLinePlot[{Table[Around[RandomReal[20], 1], 10], Table[Around[RandomReal[20], 1], 10]}, PlotStyle -> {Red, Blue}]ListLinePlot[{Table[Around[RandomReal[20], 1], 10], Table[Around[RandomReal[20], 1], 10]}, IntervalMarkersStyle -> Gray]Joined (3)
LabelingFunction (6)
ListLinePlot[{1, 1, 2, 3, 5, 8} -> {"a", "b", "c", "d", "e", "f"}]LabelingFunction->Noneを使ってラベルを付けないようにする:
ListLinePlot[{1, 1, 2, 3, 5, 8} -> {"a", "b", "c", "d", "e", "f"}, LabelingFunction -> None]ListLinePlot[{1, 1, 2, 3, 5, 8} -> {"a", "b", "c", "d", "e", "f"}, LabelingFunction -> Above]ListLinePlot[{1, 1, 2, 3, 5, 8} -> {"a", "b", "c", "d", "e", "f"}, LabelingFunction -> Callout[Automatic, Automatic]]ListLinePlot[{1, 1, 2, 3, 5, 8} -> {"a", "b", "c", "d", "e", "f"}, LabelingFunction -> (#1&)]ListLinePlot[{1, 1, 2, 3, 5, 8} -> {"a", "b", "c", "d", "e", "f"}, LabelingFunction -> (#2&)]LabelingSize (4)
ListLinePlot[{1, 1, 2, 3, 5, 8} -> {"healthfulness", "obstreperous", "spectrogram", "vestige", "coinage", "limey"}, ImageSize -> Medium]ListLinePlot[{1, 1, 2, 3, 5, 8} -> {[image], [image], [image], [image], [image], [image]}, ImageSize -> Medium]ListLinePlot[{1, 1, 2, 3, 5, 8} -> {"healthfulness", "obstreperous", "spectrogram", "vestige", "coinage", "limey"}, ImageSize -> Medium, LabelingSize -> 30]ListLinePlot[{1, 1, 2, 3, 5, 8} -> {[image], [image], [image], [image], [image], [image]}, ImageSize -> Medium, LabelingSize -> 20]ListLinePlot[{1, 1, 2, 3, 5, 8} -> {[image], [image], [image], [image], [image], [image]}, ImageSize -> Medium, LabelingSize -> Full]LabelingTarget (6)
ListLinePlot[IconizedObject[«data»]]ListLinePlot[IconizedObject[«data»], LabelingTarget -> All]ListLinePlot[IconizedObject[«data»], LabelingTarget -> "Dense"]ListLinePlot[IconizedObject[«data»], LabelingTarget -> 0.5]ListLinePlot[IconizedObject[«data»], LabelingTarget -> <|"AllowedLabelingPositions" -> "Sides"|>]ListLinePlot[IconizedObject[«data»], LabelingTarget -> <|"AllowedLabelingPositions" -> "Corners"|>]ListLinePlot[IconizedObject[«data»], LabelingTarget -> <|"AllowLabelClipping" -> True|>]MaxPlotPoints (4)
ListLinePlot[Table[Sin[10x], {x, 0, 2Pi, 0.1}]]Table[ListLinePlot[Table[Sin[2Pi n / 10], {n, 100}], MaxPlotPoints -> mp], {mp, {Infinity, 50, 30}}]

ListLinePlot[Sin[Range[10^6]2.Pi / 10^5] + RandomReal[0.3, 10^6], MaxPlotPoints -> 10^3]一様ではないデータは特徴を保存するために位相的に副次サンプルを取ることになる:
Table[ListLinePlot[Table[{n, Sin[2Pi n / 10]}, {n, 100}], MaxPlotPoints -> mp], {mp, {Infinity, 50, 30}}]Table[ListLinePlot[Table[{Sqrt[n]Cos[n / 5], Sqrt[n]Sin[n / 5]}, {n, 100}], MaxPlotPoints -> mp], {mp, {Infinity, 50, 30}}]ListLinePlot[{1, 2, 3, None, 5, 6, 7, 8, None, 10, 11, 12}, MaxPlotPoints -> 3, Mesh -> All]Mesh (5)
{ListLinePlot[Table[Sin[x], {x, 8}], Mesh -> Full], ListLinePlot[Table[Sin[x], {x, 8}], Mesh -> All]}{ListLinePlot[Table[Sin[x], {x, 8}], Mesh -> Full, InterpolationOrder -> 2], ListLinePlot[Table[Sin[x], {x, 8}], Mesh -> All, InterpolationOrder -> 2]}
ListLinePlot[Table[Sin[x], {x, 0, 2Pi, 0.1}], Mesh -> 20]
ListLinePlot[Table[{x, Sin[x]}, {x, 0, 2Pi, 0.1}], Mesh -> {Range[0, 2Pi, Pi / 4]}, MeshStyle -> PointSize[Medium]]
ListLinePlot[Table[{x, Sin[x]}, {x, 0, 2Pi, 2Pi / 20}], Mesh -> {Table[{x, Hue[x / (2Pi)]}, {x, 0., 2Pi, 2Pi / 8}]}]MeshFunctions (2)


Table[ListLinePlot[Table[Binomial[15, k], {k, 0, 15}], MeshFunctions -> {Function[{x, y}, Evaluate[f]]}, Mesh -> 9, PlotLabel -> f], {f, {x, y}}] 方向に赤で5個のメッシュレベルを,
 方向に青で10個のメッシュレベルを示す:
ListLinePlot[Table[Binomial[15, k], {k, 0, 15}], Mesh -> {5, 10}, MeshFunctions -> {#1&, #2&}, MeshStyle -> {Directive[PointSize[Medium], Red], Blue}]MeshShading (6)

ListLinePlot[Table[Binomial[15, k], {k, 0, 15}], Mesh -> 10, MeshFunctions -> {#1&}, MeshShading -> {Red, Blue}]Noneを使って線分を取り除く:
ListLinePlot[Table[Binomial[15, k], {k, 0, 15}], Mesh -> 10, MeshFunctions -> {#1&}, MeshShading -> {Red, None}]MeshShadingはPlotStyleとともに使うことができる:
ListLinePlot[Table[Binomial[15, k], {k, 0, 15}], Mesh -> 10, PlotStyle -> Thick, MeshFunctions -> {#1&}, MeshShading -> {Red, Blue}]MeshShadingは,曲線のスタイリングに関してはPlotStyleよりも優先順位が高い:
ListLinePlot[Table[Binomial[15, k], {k, 0, 15}], Mesh -> 10, PlotStyle -> Green, MeshFunctions -> {#1&}, MeshShading -> {Red, Blue}]MeshShadingをAutomaticに設定し,線分にPlotStyleを使う:
ListLinePlot[Table[Binomial[15, k], {k, 0, 15}], Mesh -> 10, PlotStyle -> Directive[Thick, Yellow], MeshFunctions -> {#1&}, MeshShading -> {Red, Automatic}]MeshShadingはColorFunctionとともに使うことができる:
ListLinePlot[Table[Binomial[15, k], {k, 0, 15}], Mesh -> 10, PlotStyle -> Thick, MeshFunctions -> {#1&}, MeshShading -> {StandardGray, Automatic},
	ColorFunction -> Function[{x, y}, Hue[x]]]
MeshStyle (4)
ListLinePlot[Table[Binomial[15, k], {k, 0, 15}], Mesh -> 10, MeshStyle -> Automatic]
ListLinePlot[Table[Binomial[15, k], {k, 0, 15}], Mesh -> 10, MeshStyle -> Red]

ListLinePlot[Table[Binomial[15, k], {k, 0, 15}], Mesh -> 10, MeshStyle -> {Red, Blue}, MeshFunctions -> {#1&, #2&}]
ListLinePlot[Table[Binomial[15, k], {k, 0, 15}], Mesh -> 10, MeshStyle -> Directive[PointSize[Large], Red]]MultiaxisArrangement (5)
デフォルトで,プロット中の全ての項目が同じスケールを共有する:
ListLinePlot[{Range[10], Prime[Range[10]]}]ListLinePlot[{Range[10], Prime[Range[10]]}, MultiaxisArrangement -> All]ListLinePlot[{Range[10], Prime[Range[10]], Range[10] ^ 2}, MultiaxisArrangement -> All]ListLinePlot[{Range[10], Prime[Range[10]], Range[10] ^ 2}, MultiaxisArrangement -> {{1, 2}, 3}]ListLinePlot[{Range[10], Prime[Range[10]], Range[10] ^ 2}, MultiaxisArrangement -> {Right -> {1, 2}, Left -> 3}]ListLinePlot[{Range[10], Prime[Range[10]], Range[10] ^ 2}, MultiaxisArrangement -> {Right -> {{1, 2}}, Left -> 3}]PlotFit (4)
ListLinePlot[IconizedObject[«data»], PlotFit -> Automatic]ListLinePlot[IconizedObject[«data»], PlotFit -> "Linear"]ListLinePlot[IconizedObject[«data»], PlotFit -> "Quadratic"]KernelModelFitを使ってデータを近似する:
ListLinePlot[IconizedObject[«data»], PlotFit -> PowerModel[]]PlotFitElements (3)
デフォルトで,フィットされたモデルがデータとともに表示される:
ListLinePlot[IconizedObject[«data»], PlotFit -> Automatic]データの信頼帯をプロットする.デフォルトでは信頼水準は0.95である:
ListLinePlot[IconizedObject[«data»], PlotFit -> Automatic, PlotFitElements -> "BandCurves"]ListLinePlot[IconizedObject[«data»], PlotFit -> Automatic, PlotFitElements -> {"BandCurves", <|"ConfidenceLevel" -> 0.5|>}]点が繋がれていないときに,データ点からフィットされた曲線までの残差線を表示する:
ListLinePlot[IconizedObject[«data»], PlotFit -> Automatic, PlotFitElements -> "Residuals"]ListLinePlot[IconizedObject[«data»], PlotFit -> Automatic, PlotFitElements -> {"DataPoints", {"Residuals", <|"Style" -> Opacity[1, StandardRed]|>}}]PlotHighlighting (9)
デフォルト設定のPlotHighlightingAutomaticのとき,プロットにはインタラクティブな座標のコールアウトが付いている:
ListPlot[{IconizedObject[«primes»], IconizedObject[«squares»]}]PlotHighlightingNoneを使ってプロット全体のハイライト効果をオフにする:
ListPlot[{IconizedObject[«primes»], IconizedObject[«squares»]}, PlotHighlighting -> None]Highlighted[…,None]を使って単一の集合についてのハイライト効果をオフにする:
ListPlot[{IconizedObject[«primes»], Highlighted[IconizedObject[«squares»], None]}]点集合にマウスオーバーして,任意のグラフィックス指示子でハイライトする:
ListPlot[{IconizedObject[«primes»], IconizedObject[«squares»]}, PlotHighlighting -> Directive[Red, AbsolutePointSize[10], DropShadowing[]]]ListPlot[IconizedObject[«primes»], PlotHighlighting -> "Ball"]ListPlot[Highlighted[IconizedObject[«primes»], Placed["Ball", 7]]]曲線にマウスオーバーしてラベルと軸へのドロップラインでハイライトする:
ListPlot[IconizedObject[«primes»], PlotHighlighting -> "Dropline"]ListPlot[Highlighted[IconizedObject[«primes»], Placed["Dropline", 7]]]プロットにマウスオーバーして  位置に対応する
 値を示すスライスでハイライトする:
ListPlot[{IconizedObject[«primes»], IconizedObject[«squares»]}, PlotHighlighting -> "XSlice"]
ListPlot[{Highlighted[IconizedObject[«primes»], Placed["XSlice", 17]], IconizedObject[«squares»]}]プロットにマウスオーバーして  位置に対応する
 の値のスライスでハイライトする:
ListPlot[{IconizedObject[«primes»], IconizedObject[«squares»]}, PlotHighlighting -> "YSlice"]
ListPlot[{IconizedObject[«primes»], IconizedObject[«squares»]}, PlotHighlighting -> Placed["YSlice", 300]]マウスカーソルの  位置に最も近いプロット上の点を示す成分を使う:
ListLinePlot[{IconizedObject[«primes»], IconizedObject[«squares»]}, PlotHighlighting -> "XNearestPoint"]ListLinePlot[{IconizedObject[«primes»], IconizedObject[«squares»]}, PlotHighlighting -> {"XNearestPoint", <|"Style" -> StandardGray|>}]ListLinePlot[{IconizedObject[«primes»], IconizedObject[«squares»]}, PlotHighlighting -> "XYLabel"]Calloutオプションを使ってラベルの外観を変える:
ListLinePlot[IconizedObject[«primes»], PlotHighlighting -> {"XYLabel", <|"Appearance" -> "Corners", "CalloutMarker" -> "Circle"|>}]ListLinePlot[IconizedObject[«primes»], PlotHighlighting -> {{"XNearestPoint", <|"Style" -> StandardGray|>}, {"XYLabel", <|"Appearance" -> "Corners", "CalloutMarker" -> "Circle"|>}}]PlotInteractivity (3)
デフォルトで,プロットにはインタラクティブなハイライト機能がある:
ListLinePlot[{2, 3, 5, 7, 11, 13, 17, 19, 23, 29}]ListLinePlot[{2, 3, 5, 7, 11, 13, 17, 19, 23, 29}, PlotInteractivity -> False]与えられたインタラクティブ要素は有効にして,自動のものを無効にする:
ListLinePlot[{2, 3, 5, 7, 11, 13, 17, 19, 23, Tooltip[29, "hello"]}, PlotInteractivity -> <|"User" -> True, "System" -> False|>]PlotLabel (1)
PlotLabels (6)
ListLinePlot[{Sin[Range[0, 2Pi, 0.1]], Cos[Range[0, 2Pi, 0.1]]}, PlotLabels -> {"sine", "cosine"}]Association形式を使ってラベルを指定する:
ListLinePlot[{Sin[Range[0, 2Pi, 0.1]], Cos[Range[0, 2Pi, 0.1]]}, PlotLabels -> <|"Lists" -> {"sine", "cosine"}|>]ListLinePlot[{Sin[Range[0, 2Pi, 0.1]], Cos[Range[0, 2Pi, 0.1]]}, PlotLabels -> Placed[{"sine", "cosine"}, Above]]ListLinePlot[{Sin[Range[0, 2Pi, 0.1]], Cos[Range[0, 2Pi, 0.1]]}, PlotLabels -> {Callout["sin", {Scaled[0.25], Above}], Callout["cos", {Scaled[0.5], Below}]}]ListLinePlot[<|"sine" -> Sin[Range[0, 2Pi, 0.1]], "cosine" -> Cos[Range[0, 2Pi, 0.1]]|>, PlotLabels -> Automatic, PlotLegends -> None]Noneを使ってラベルは加えない:
ListLinePlot[{Sin[Range[0, 2Pi, 0.1]], Cos[Range[0, 2Pi, 0.1]]}, PlotLabels -> {"sine", None}]PlotLayout (3)
data = {{10, 9, 4, 3, 5, 3, 5, 5, 2, 6}, {2, 10, 5, 6, 9, 4, 9, 3, 7, 2}, {7, 8, 3, 4, 4, 2, 6, 3, 8, 7}};ListLinePlot[data]ListLinePlot[data, PlotLayout -> "Stacked"]ListLinePlot[data, PlotLayout -> "Percentile"]ListLinePlot[data, PlotLayout -> "Column", ImageSize -> Medium]ListLinePlot[data, PlotLayout -> "Row", ImageSize -> Medium]ListLinePlot[IconizedObject[«data»], ImageSize -> Medium, Joined -> True, PlotLayout -> {"Column", 4}]ListLinePlot[IconizedObject[«data»], ImageSize -> Medium, Joined -> True, PlotLayout -> {"Column", UpTo[4]}]ListLinePlot[{{...}, {...}}, Joined -> True, PlotLayout -> "Column", ImageSize -> Medium, PlotLabels -> {"First", "Second"}]PlotLegends (6)
ListLinePlot[{Sqrt[Range[40]], Log[Range[40]]}, PlotLegends -> {"sqrt", "log"}]Association形式を使って凡例を指定する:
ListLinePlot[{Sqrt[Range[40]], Log[Range[40]]}, PlotLegends -> <|"Lists" -> {"sqrt", "log"}|>]ListLinePlot[{Sqrt[Range[40]], Log[Range[40]]}, PlotLegends -> Automatic]ListLinePlot[{Sqrt[Range[40]], Log[Range[40]]}, PlotStyle -> {Red, Blue}, PlotLegends -> {"sqrt", "log"}]Placedを使って凡例を置く場所を指定する:
Table[ListLinePlot[{Sqrt[Range[40]], Log[Range[40]]}, PlotLabel -> pos, PlotLegends -> Placed[{"sqrt", "log"}, pos]], {pos, {Above, Below, Before, After}}]ListLinePlot[{Sqrt[Range[40]], Log[Range[40]]}, PlotStyle -> {Red, Blue}, PlotLegends -> Placed[{"sqrt", "log"}, {0.85, 0.3}]]LineLegendを使って凡例の外観を変える:
ListLinePlot[{Sqrt[Range[40]], Log[Range[40]]}, PlotStyle -> {Red, Blue}, PlotLegends -> LineLegend[{"sqrt", "log"}, LegendMarkerSize -> 10, LegendFunction -> Frame]]PlotMarkers (8)
ListLinePlotは通常異なるデータ集合を区別するために別々の色を使う:
ListLinePlot[Table[n ^ (1 / p), {p, 4}, {n, 10}], PlotMarkers -> None]ListLinePlot[Table[n ^ (1 / p), {p, 4}, {n, 10}], PlotMarkers -> Automatic]ListLinePlot[Table[n ^ (1 / p), {p, 4}, {n, 10}], PlotMarkers -> Automatic, PlotStyle -> StandardBlue]Table[ListLinePlot[Table[n ^ (1 / p), {p, 4}, {n, 5}], PlotMarkers -> {Automatic, s}], {s, {Small, Medium}}]ListLinePlot[Table[n ^ (1 / p), {p, 4}, {n, 10}], PlotMarkers -> {"1", "2", "3", "4"}]{m1, m2, m3, m4} = Graphics /@ {Circle[{0, 0}, 1], Disk[{0, 0}, 1], Line[{{-0.5, -0.5}, {0.5, -0.5}, {0.5, 0.5}, {-0.5, 0.5}, {-0.5, -0.5}}], Polygon[{{-0.5, -0.5}, {0.5, -0.5}, {0.5, 0.5}, {-0.5, 0.5}}]}ListLinePlot[Table[n ^ (1 / p), {p, 4}, {n, 10}], PlotMarkers -> Table[{s, 0.05}, {s, {m1, m2, m3, m4}}]]ListLinePlot[Table[n ^ (1 / p), {p, 4}, {n, 10}], PlotMarkers -> "●"]Table[ListLinePlot[Table[n ^ (1 / p), {p, 4}, {n, 10}], PlotMarkers -> {"●", s}], {s, {4, 8, 12}}]PlotRange (2)
PlotRangeは自動的に計算される:
ListLinePlot[{1, 2, 3, 45, 6, 7, 8}]ListLinePlot[{1, 2, 3, 45, 6, 7, 8}, PlotRange -> All]PlotStyle (7)
Table[ListLinePlot[Table[Binomial[10, k], {k, 0, 10}], PlotStyle -> ps], {ps, {Red, Thick, Dashed, Directive[Red, Thick]}}]ListLinePlot[Table[Table[Sin[k x], {x, 0, 2Pi, 0.1}], {k, {1, 2, 3}}]]ListLinePlot[Table[Table[Sin[k x], {x, 0, 2Pi, 0.1}], {k, {1, 2, 3}}], PlotStyle -> {Red, Green, Blue}]連想に基づくシンタックスを使ってすべてのデータのベーススタイルを設定する:
ListLinePlot[{IconizedObject[«p»], IconizedObject[«p^2»], IconizedObject[«p^3»]}, PlotStyle -> <|"Base" -> AbsoluteThickness[1]|>]ListLinePlot[{IconizedObject[«p»], IconizedObject[«p^2»], IconizedObject[«p^3»]}, PlotStyle -> <|"Lists" -> {StandardGreen, StandardRed, StandardBlue}|>]各データ集合のスタイルに加えて全体的なベーススタイルも与える:
ListLinePlot[{IconizedObject[«p»], IconizedObject[«p^2»], IconizedObject[«p^3»]}, PlotStyle -> <|"Base" -> AbsoluteThickness[1], "Lists" -> {StandardGreen, StandardRed, StandardBlue}|>]PlotStyleはColorFunctionと組み合せることができる:
ListLinePlot[Table[Sin[x], {x, 0, 2Pi, 0.1}], PlotStyle -> Thick, ColorFunction -> Function[{x, y}, Hue[y]]]PlotStyleはMeshShadingと組み合せることができる:
ListLinePlot[Table[Sin[x], {x, 0, 2Pi, 0.1}], PlotStyle -> Directive[Opacity[0.5], Thick], Mesh -> 10, MeshFunctions -> {#1&}, MeshShading -> {Red, Blue}]MeshStyleはデフォルトでPlotStyleと同じスタイルを使う:
ListLinePlot[Table[Sin[x], {x, 0, 2Pi, 0.1}], PlotStyle -> Red, Mesh -> All]PlotTheme (3)
単純なスタイリングとプロットマーカーで明るいカラースキームのテーマを使う:
ListLinePlot[{Prime[Range[10]], Fibonacci[Range[10]], Range[10]}, PlotTheme -> "Business"]ListLinePlot[{Prime[Range[10]], Fibonacci[Range[10]], Range[10]}, PlotTheme -> "Business", PlotStyle -> {StandardPurple, StandardYellow, StandardCyan}]ListLinePlot[{Prime[Range[10]], Fibonacci[Range[10]], Range[10]}, PlotTheme -> "Minimal"]ScalingFunctions (9)
ListLinePlot[{1, 5, 10, 35, 60, 75, 140}]
ListLinePlot[{1, 5, 10, 35, 60, 75, 140}, ScalingFunctions -> "Log"]
ListLinePlot[{1, 5, 10, 35, 60, 75, 140}, ScalingFunctions -> "Reverse"]
ListLinePlot[{1, 5, 10, 35, 60, 75, 140}, ScalingFunctions -> "Reciprocal"]

ListLinePlot[{1, 5, 10, 35, 60, 75, 140}, ScalingFunctions -> {"Reverse", "Log"}]

ListLinePlot[{1, 5, 10, 35, 60, 75, 140}, ScalingFunctions -> {"Reverse", None}]ListLinePlot[{1, 5, 10, 35, 60, 75, 140}, ScalingFunctions -> {None, {-Log[#]&, Exp[-#]&}}]TicksとGridLinesの位置は自動的にスケールされる:
ListLinePlot[{1, 5, 10, 35, 60, 75, 140}, ScalingFunctions -> "Log", Ticks -> {Automatic, 2 ^ Range[10]}, GridLines -> {None, 2 ^ Range[10]}]PlotRangeとAxesOriginは自動的にスケールされる:
ListLinePlot[{1, 5, 10, 35, 60, 75, 140}, ScalingFunctions -> "Log", PlotRange -> {1, 100}, AxesOrigin -> {Automatic, 10}]TargetUnits (2)
Ticks (10)
ListLinePlot[Sinc[Range[0, 10, 0.1]]]ListLinePlot[Sinc[Range[0, 10, 0.1]], Ticks -> None]

ListLinePlot[Sinc[Range[0, 10, 0.1]], Ticks -> {Automatic, None}]ListLinePlot[Sinc[Range[0, 10, 0.1]], Ticks -> {{1, 50, 80}, {.1, .5, 1}}]ListLinePlot[Sinc[Range[0, 10, 0.1]], Ticks -> {{{10, a}, {50, b}, {80, c}}, {{.1, d}, {.5, e}, {1, f}}}]ListLinePlot[Sinc[Range[0, 10, 0.1]], Ticks -> {{{10, a}, {50, b}, {80, c}}, {{.1, d}, {.5, e}, {1, f}}}]ListLinePlot[Sinc[Range[0, 10, 0.1]], Ticks -> {{{10, a}, {50, b}, {80, c}}, Automatic}]ListLinePlot[Sinc[Range[0, 10, 0.1]], Ticks -> {{{10, a, 0.1}, {50, b, 0.1}, {80, c, 0.1}}, Automatic}]ListLinePlot[Sinc[Range[0, 10, 0.1]], Ticks -> {{{10, a, {0.5, 0.25}}, {50, b, {0.45, 0.15}}, {80, c, {0.35, 0.05}}}, Automatic}]ListLinePlot[Sinc[Range[0, 10, 0.1]], Ticks -> {{{10, a, 0.1, Red}, {50, b, 0.1, Blue}, {80, c, 0.1, Purple}}, Automatic}, TicksStyle -> Thick]minMeanMax[min_, max_] := {{min, min}, {(max + min) / 2, (max + min) / 2}, {max, max}}ListLinePlot[Sinc[Range[0, 10, 0.1]], Ticks -> {Automatic, minMeanMax}, PlotRangePadding -> None]TicksStyle (4)
デフォルトで,目盛と目盛ラベルには軸と同じスタイルが使われる:
ListLinePlot[Sinc[Range[0, 10, 0.1]], AxesStyle -> Red]ListLinePlot[Sinc[Range[0, 10, 0.1]], TicksStyle -> Red]ListLinePlot[Sinc[Range[0, 10, 0.1]], TicksStyle -> {Directive[StandardBlue, Thick], Directive[StandardGray, 15]}]ListLinePlot[Sinc[Range[0, 10, 0.1]],
TicksStyle -> Directive[Red, Thick], LabelStyle -> StandardBlue]アプリケーション (9)
 番目の素数を推測値と比べる:
ListLinePlot[{Table[Prime[n], {n, 80}], Table[n Log[n], {n, 80}]}]ListLinePlot[Accumulate[RandomReal[{-1, 1}, 250]]]ListLinePlot[Accumulate[RandomReal[{-1, 1}, {250, 2}]]]ListLinePlot[Accumulate[RandomChoice[{{1, 0}, {-1, 0}, {0, 1}, {0, -1}}, 250]], AspectRatio -> Automatic]100個のランダムな点を通る最短コースを計算し,これをプロットする:
pts = RandomReal[10, {100, 2}];ListLinePlot[pts[[Last@FindShortestTour[pts]]], Mesh -> All]data = {{2, 3, 3, 4, 8, 8, 8, 8, 9, 10}, {1, 1, 4, 5, 5, 6, 7, 9, 9, 10}, {1, 2, 4, 5, 7, 7, 8, 9, 9, 10}};ListLinePlot[Accumulate[data], Filling -> {1 -> Axis, 2 -> {1}, 3 -> {2}}, PlotStyle -> {Red, Orange, Blue}]GraphDataで使用可能な,さまざまなノード数のグラフの数を示す:
ListLinePlot[Table[Length[GraphData[n]], {n, 50}]]ListLinePlot[Table[ElementData[z, "Density"], {z, 118}]]n = StringLength /@ Names["System`*"];ListLinePlot[Sort[Tally[n]]]いくつかのWolfram言語の関数についてサンプルの動作をプロットする:
Table[ListLinePlot[Sort@Reap[f[Sinc[x], {x, 0, 15}, EvaluationMonitor :> Sow[{x, Sinc[x]}]]][[2, 1]], Filling -> Axis, Mesh -> All, PlotLabel -> f, PlotRange -> All], {f, {NIntegrate, Plot, NSum}}]Plot3Dを使う ,
 空間で,サンプルの順序をプロットする:
Reap[Plot3D[Sin[x y], {x, 0, 2}, {y, 0, 2}, EvaluationMonitor :> Sow[{x, y}]], _, ListLinePlot[#2, AspectRatio -> Automatic]&]特性と関係 (13)

ListLinePlot[{{1, 2}, {3, 6}, {7, 5}}]ListLinePlot[{{1, 2}, {3, 6}, {7, 5}}, DataRange -> All]ListLinePlotはListPlotの特殊ケースである:
{ListLinePlot[Table[Binomial[9, k], {k, 0, 9}]],
ListPlot[Table[Binomial[9, k], {k, 0, 9}], Joined -> True]}Plotを使って関数を可視化する:
{Plot[Sin[x ^ 2], {x, 0, 5}], ListLinePlot[Table[{x, Sin[x ^ 2]}, {x, 0, 5, 0.1}]]}対数データのプロットにListLogPlot,ListLogLogPlot,ListLogLinearPlotを使う:
ListLogPlot[Table[Binomial[25, k], {k, 0, 25}], Joined -> True]極座標のプロットにListPolarPlotを使う:
ListPolarPlot[Table[{x, Sqrt[x]}, {x, 0, 2Pi, 0.1}], Joined -> True]DateListPlotを使ってある時間幅でデータを示す:
DateListPlot[{34, 51, 11, 5, 39, 47, 28, 42, 66, 13, 24, 31}, {2006, 1}, Joined -> True]ListPointPlot3Dを使って三次元データプロットを示す:
ListPointPlot3D[Table[Sin[j ^ 2 + i], {i, 0, Pi, 0.1}, {j, 0, Pi, 0.1}]]ListLinePlot3Dを使って点のリストを通る曲線をプロットする:
ListLinePlot3D[Table[{Cos[t], Sin[t], Sin[5t]}, {t, 0, 2Pi, 0.1}]]ListLinePlot3D[Table[Sin[j ^ 2 + i], {i, 0, 3, 0.25}, {j, 0, 3, 0.1}]]ListPlot3Dを使ってデータから曲面を作成する:
ListPlot3D[Table[Sin[j ^ 2 + i], {i, 0, Pi, 0.1}, {j, 0, Pi, 0.1}]]ListContourPlotを使って連続データから等高線を作成する:
ListContourPlot[Table[Sin[j ^ 2 + i], {i, 0, Pi, 0.1}, {j, 0, Pi, 0.1}]]ListDensityPlotを使って連続データから密度を作成する:
ListDensityPlot[Table[Sin[j ^ 2 + i], {i, 0, Pi, 0.1}, {j, 0, Pi, 0.1}]]離散値の配列にArrayPlotとMatrixPlotを使う:
ArrayPlot[Table[GCD[i, j], {i, 1, 20}, {j, 1, 20}]]パラメトリック曲線にParametricPlotを使う:
{ParametricPlot[{Cos[θ], Sin[θ]}, {θ, 0, 2Pi}], ListLinePlot[Table[{Cos[θ], Sin[θ]}, {θ, 0, 2Pi, 0.1}], AspectRatio -> 1]}考えられる問題 (2)
ListLinePlot[Table[Sin[10x], {x, 0, 2Pi, 0.1}], MaxPlotPoints -> 30]ListLinePlot[Table[Sin[10x], {x, 0, 2Pi, 0.1}], MaxPlotPoints -> 50]順序付けられていないデータは思いがけない方法で表示されることがある:
data = Table[{x, Sin[x]}, {x, RandomReal[{0, 2Pi}, 100]}];ListLinePlot[data]ListLinePlot[Sort[data]]
 An Elementary Introduction to the Wolfram Language

 An Elementary Introduction to the Wolfram Language
テキスト
Wolfram Research (2007), ListLinePlot, Wolfram言語関数, https://reference.wolfram.com/language/ref/ListLinePlot.html (2026年に更新).
CMS
Wolfram Language. 2007. "ListLinePlot." Wolfram Language & System Documentation Center. Wolfram Research. Last Modified 2026. https://reference.wolfram.com/language/ref/ListLinePlot.html.
APA
Wolfram Language. (2007). ListLinePlot. Wolfram Language & System Documentation Center. Retrieved from https://reference.wolfram.com/language/ref/ListLinePlot.html