

RipleyK
Details and Options
- The product
 , where
  is the mean density, gives the expected number of points within distance r of a typical point, not counting the point itself.
 -
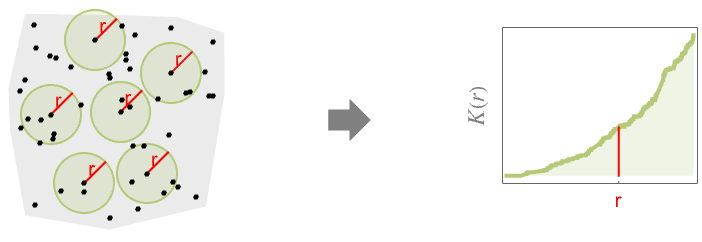
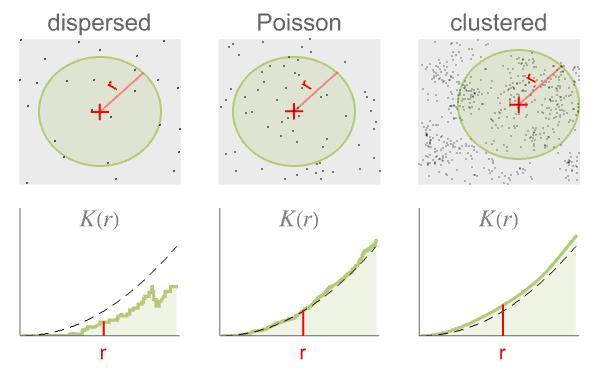
- RipleyK measures spatial homogeneity of a point collection within distance r. In comparing with a Poisson point process, the results are:
-

more dispersed than Poisson 
like Poisson, i.e. complete spatial randomness 
more clustered than Poisson - Here,
 is the volume of a unit ball in
  .
. -
- The radius r can be a single value or a list of values. With no radius r specified, RipleyK returns a PointStatisticFunction that can be used to evaluate the
 function repeatedly.
 - The points pdata can have the following forms:
-
{p1,p2,…} points pi GeoPosition[…],GeoPositionXYZ[…],… geographic points SpatialPointData[…] spatial point collection {pts,reg} point collection pts and observation region reg - If the observation region reg is not given, a region is automatically computed using RipleyRassonRegion.
- The point process pproc can have the following forms:
-
proc a point process proc {proc,reg} a point process proc and observation region reg - The observation region reg should be a parameter-free SpatialObservationRegionQ.
- The binned data bdata is from SpatialBinnedPointData and is treated as an InhomogeneousPoissonPointProcess with a piecewise-constant density function.
- For pdata,
 is computed by counting distinct pairs of points within distance r of each other.
 - For pproc,
 is computed by using exact formulas or by simulation to generate point data.
 - The following options can be given:
-
Method Automatic what methods to use SpatialBoundaryCorrection Automatic what boundary correction to use - The following settings can be used for SpatialBoundaryCorrection:
-
Automatic automatically determined boundary correction None no boundary correction "BorderMargin" use interior margin for observation region "Ripley" uses weights depending on the point distance to boundary
Examples
open all close allBasic Examples (3)
Estimate Ripley's ![]() function at a given radius:
function at a given radius:
region = Ball[{0, 0}];
pts = RandomPoint[region, 100];RipleyK[{pts, region}, 0.2]Estimate Ripley's ![]() function within a range of distances:
function within a range of distances:
spd = SpatialPointData[RandomReal[1, {500, 3}]]rspec = Range[0.1, 0.4, 0.01];est = RipleyK[spd, rspec];Visualize the result with ListPlot:
ListPlot[est, DataRange -> MinMax[rspec], AxesLabel -> {r}, Filling -> Axis]Ripley's ![]() function of a cluster point process:
function of a cluster point process:
kfun = RipleyK[MaternPointProcess[μ, λ, R, 2], r]Visualize the function with given parameter values:
Plot[kfun /. {μ -> 3, λ -> 2, R -> 1}, {r, 0, 3}, AxesLabel -> Automatic]Scope (10)
Point Data (5)
Estimate Ripley's ![]() function at distance 0.2:
function at distance 0.2:
region = Rectangle[{0, 0}, {1, 2}];
pts = RandomPoint[region, 100];RipleyK[{pts, region}, 0.2]Obtain empirical estimates of Ripley's ![]() function from a list of given distances:
function from a list of given distances:
RipleyK[{pts, region}, {0.1, 0.3, 0.05, 0.23}]Use RipleyK with SpatialPointData:
spd = SpatialPointData[RandomReal[1, {500, 2}]]res = RipleyK[spd, {0.01, 0.02}]Create a PointStatisticFunction for future use:
reg = Disk[];
pts = RandomPoint[Disk[], 100];psf = RipleyK[{pts, reg}]Find the value of the function at a given radius:
psf[0.5]Estimate Ripley's ![]() function without explicitly providing the observation region:
function without explicitly providing the observation region:
BlockRandom[
	SeedRandom[1];
pts = RandomReal[1, {100, 2}]];psf = RipleyK[pts]Observation region generated by the Ripley–Rasson estimator:
psf["ObservationRegion"]Estimated ![]() function at distance 0.3:
function at distance 0.3:
psf[0.3]Use RipleyK with GeoPosition:
pts = RandomGeoPosition[GeoDisk[GeoPosition[{0, 0}], Quantity[10, "Kilometers"]], 10 ^ 2]psf = RipleyK[pts]Plot the point statistics function:
ListPlot[Table[{x, psf[x]}, {x, Quantity[0, "km"], psf["MaxRadius"], Quantity[.1, "km"]}], AxesLabel -> {"km"}]Point Processes (5)
Ripley's ![]() function for PoissonPointProcess has a closed form that does not depend on the intensity:
function for PoissonPointProcess has a closed form that does not depend on the intensity:
proc = PoissonPointProcess[μ, d];RipleyK[proc, r]The function is proportional to ![]() :
:
Plot[Table[RipleyK[proc, r], {d, 1, 4}]//Evaluate, {r, 0, 1.3}, AxesLabel -> Automatic, PlotLegends -> (Row[{#, "D"}]& /@ Range[4])]Ripley's ![]() function for a cluster process ThomasPointProcess with specified dimension:
function for a cluster process ThomasPointProcess with specified dimension:
proc2D = ThomasPointProcess[μ, λ, σ, 2];RipleyK[proc2D, r]It is always greater than the two-dimensional PoissonPointProcess of the same density:
RipleyK[PoissonPointProcess[μ, 2], r]Refine[%% - %, r ≥ 0]proc3D = ThomasPointProcess[μ, λ, σ, 3];RipleyK[proc3D, r]Compare with the corresponding Poisson point process:
RipleyK[PoissonPointProcess[μ, 3], r]Refine[%% - %, r ≥ 0]Ripley's ![]() function for a cluster process MaternPointProcess with specified dimension:
function for a cluster process MaternPointProcess with specified dimension:
proc2D = MaternPointProcess[μ, λ, rad, 2];RipleyK[proc2D, r]proc3D = MaternPointProcess[μ, λ, rad, 3];RipleyK[proc3D, rad]Ripley's ![]() function for a cluster process CauchyPointProcess:
function for a cluster process CauchyPointProcess:
proc = CauchyPointProcess[μ, λ, b, dim];RipleyK[proc, r]Ripley's ![]() function for a cluster process VarianceGammaPointProcess:
function for a cluster process VarianceGammaPointProcess:
proc = VarianceGammaPointProcess[μ, λ, α, β, dim];RipleyK[proc, r]Options (2)
SpatialBoundaryCorrection (2)
The RipleyK estimator without boundary correction is biased and should not be used unless with a large point set:
region = Rectangle[{0, 0}, {2, 1}];
pts = RandomPoint[region, 100];r = 0.2;RipleyK[{pts, region}, r, SpatialBoundaryCorrection -> None]The default method "BorderMargin" only considers the points that are distance ![]() from the boundary:
from the boundary:
inregion = Rectangle[{r, r}, {2 - r, 1 - r}];
Show[RegionPlot[{region, inregion}, AspectRatio -> Automatic], ListPlot[pts]]RipleyK[{pts, region}, r, SpatialBoundaryCorrection -> "BorderMargin"]The boundary correction method "Ripley" weights each pair of points to make the estimator unbiased:
RipleyK[{pts, region}, r, SpatialBoundaryCorrection -> "Ripley"]Compare different edge correction methods:
reg = Ball[{0, 0, 0}];
pts = RandomPoint[reg, 200];
Estimate the values of Ripley's ![]() function with three different methods:
function with three different methods:
rad = Range[0.01, 0.5, 0.02];
m = {"None", "BorderMargin", "Ripley"};data = RipleyK[{pts, reg}, rad, SpatialBoundaryCorrection -> #]& /@ m;Visualize the results and compare to the theoretical value:
val = RipleyK[PoissonPointProcess[λ, 3], r]Show[ListPlot[data, DataRange -> MinMax[rad], PlotLegends -> m], Plot[val, {r, 0, 0.5}, PlotStyle -> Gray, PlotLegends -> {val}], AxesLabel -> {r}]Applications (6)
Ripley's ![]() function is cumulative in the distance and hence monotone increasing:
function is cumulative in the distance and hence monotone increasing:
region = Ellipsoid[{0, 0}, {2, 3}];
pts = RandomPoint[region, 500];fun = RipleyK[pts]Plot[fun[r], {r, 0, 1}, AxesLabel -> Automatic]Ripley's ![]() function for complete spatial randomness:
function for complete spatial randomness:
region[d_] := Ball[d]
pts[d_] := RandomPoint[region[d], 500];
Compute Ripley's ![]() function for a few dimensions:
function for a few dimensions:
rspec = Range[0.02, 0.8, 0.02];
data = Table[RipleyK[{pts[d], region[d]}, rspec], {d, 1, 5}];ListLinePlot[data, DataRange -> MinMax[rspec], AxesLabel -> {r}, PlotLegends -> (Row[{#, "D"}]& /@ Range[5])]Points in a hardcore point process cannot be closer than the hardcore radius ![]() :
:
region = Ellipsoid[{0, 0}, {1, 2}];
radii = {0.05, 0.1, 0.15};
spds = Table[RandomPointConfiguration[HardcorePointProcess[200, R, 2], region, Method -> {"MCMC", "LengthOfRun" -> 30000}], {R, radii}];Table[Graphics[Point[spds[[k]]["Points"]], PlotRange -> {{-1, 1}, {-2, 2}}, Frame -> True, FrameLabel -> Row[{"hard-core R = ", radii[[k]]}]], {k, 3}]Estimate the values of Ripley's ![]() function:
function:
rspec = Range[0.01, 0.3, 0.01];
data = Table[RipleyK[spd, rspec], {spd, spds}];ListLinePlot[data, DataRange -> MinMax[rspec], AxesLabel -> {r}, PlotLegends -> (Row[{"hard-core R = ", #}]& /@ radii)]Find hardcore radii estimates for the three samples:
Map[rspec[[FirstPosition[#, _ ? Positive]]]&, data]//FlattenRipley's ![]() of clustered data is higher than complete, spatially random data. Sample from a cluster process:
of clustered data is higher than complete, spatially random data. Sample from a cluster process:
reg = Rectangle[{0, 0}, {4, 4}];
ptsT = RandomPointConfiguration[ThomasPointProcess[30, 20, .5, 2], reg];
Generate a control sample from a Poisson point process with the same intensity:
ptsP = RandomPointConfiguration[PoissonPointProcess[30, 2], reg];ListPlot[#["Points"], AspectRatio -> 1]& /@ {ptsP, ptsT}Compare the RipleyK functions:
rspec = Range[0.02, 2, 0.02];ListLinePlot[{RipleyK[ptsP, rspec], RipleyK[ptsT, rspec]}, PlotLegends -> {"Poisson", "Thomas"}, DataRange -> MinMax[rspec], AxesLabel -> {r}]Earthquakes of magnitude 4 or greater in California for the years 2000–2015:
reg = Polygon[Entity["AdministrativeDivision", {"California", "UnitedStates"}]];series = EarthquakeData[reg, 4, {DateObject[{2000}], DateObject[{2015}]}, "Position"]Extract the earthquakes' positions:
data = Normal[series["Values"]];Compute RipleyK:
psf = RipleyK[data]Mean point density of the data:
density = Length[data] / GeoArea[reg];The expected number of earthquakes in within a radius of 2 miles of a typical point in the data:
psf[Quantity[2, "Miles"]] * densityUse Ripley's ![]() function to estimate PairCorrelationG:
function to estimate PairCorrelationG:
reg = Disk[];
pts = RandomPoint[reg, 10 ^ 3];rlist = Range[0.01, 0.2, 0.01];pc = PairCorrelationG[{pts, reg}, rlist];ripleyK = RipleyK[pts]pcK = PairCorrelationG[{ripleyK, {0, 0.2, 0.01}}, rlist];Compare the estimate with the pair correlation computed from the data:
ListLinePlot[{pc, pcK}, DataRange -> MinMax@rlist, PlotLegends -> {"PC from data", "PC estimated from K"}, AxesLabel -> {r}]Properties & Relations (1)
BesagL is the variance-stabilized RipleyK: ![]() , where
, where ![]() is Ripley's
is Ripley's ![]() function,
function, ![]() is the spatial dimension and
is the spatial dimension and ![]() is the volume of a unit ball in
is the volume of a unit ball in ![]() :
:
region = Ball[{0, 0, 0}];
pts = RandomPoint[region, 100];v1 = RipleyK[{pts, region}, 0.2];
v2 = BesagL[{pts, region}, 0.2];Power[v1 / RegionMeasure[Ball[3]], 1 / 3] == v2Possible Issues (1)
Empirical RipleyK with border correction may not be increasing (especially for smaller sets):
region = Rectangle[];
data = RandomPoint[region, 30];Plot[RipleyK[{data, region}][r], {r, 0, 1 / 2}]The uncorrected RipleyK is increasing:
Plot[RipleyK[{data, region}, r, SpatialBoundaryCorrection -> None], {r, 0, 1 / 2}]Text
Wolfram Research (2020), RipleyK, Wolfram Language function, https://reference.wolfram.com/language/ref/RipleyK.html.
CMS
Wolfram Language. 2020. "RipleyK." Wolfram Language & System Documentation Center. Wolfram Research. https://reference.wolfram.com/language/ref/RipleyK.html.
APA
Wolfram Language. (2020). RipleyK. Wolfram Language & System Documentation Center. Retrieved from https://reference.wolfram.com/language/ref/RipleyK.html