---
title: "TreeForm"
language: "en"
type: "Symbol"
summary: "TreeForm[expr] displays expr as a tree with different levels at different depths. TreeForm[expr, n] displays expr as a tree only down to level n."
keywords: 
- pointer structure
- tree formatted expression
- tree formatting
- tree structure
- binary tree
- kary tree
- expression tree
- formula tree
canonical_url: "https://reference.wolfram.com/language/ref/TreeForm.html"
source: "Wolfram Language Documentation"
related_guides: 
  - 
    title: "Expression Structure"
    link: "https://reference.wolfram.com/language/guide/ExpressionStructure.en.md"
  - 
    title: "Expressions"
    link: "https://reference.wolfram.com/language/guide/Expressions.en.md"
  - 
    title: "Tree Visualization"
    link: "https://reference.wolfram.com/language/guide/TreeVisualization.en.md"
  - 
    title: "Graph Visualization"
    link: "https://reference.wolfram.com/language/guide/GraphVisualization.en.md"
  - 
    title: "Trees"
    link: "https://reference.wolfram.com/language/guide/Trees.en.md"
related_workflows: 
  - 
    title: "Find the Underlying Tree Structure of an Expression"
    link: "https://reference.wolfram.com/language/workflow/FindTheUnderlyingTreeStructureOfAnExpression.en.md"
related_functions: 
  - 
    title: "FullForm"
    link: "https://reference.wolfram.com/language/ref/FullForm.en.md"
  - 
    title: "MatrixForm"
    link: "https://reference.wolfram.com/language/ref/MatrixForm.en.md"
  - 
    title: "LeafCount"
    link: "https://reference.wolfram.com/language/ref/LeafCount.en.md"
  - 
    title: "ExpressionTree"
    link: "https://reference.wolfram.com/language/ref/ExpressionTree.en.md"
  - 
    title: "TreePlot"
    link: "https://reference.wolfram.com/language/ref/TreePlot.en.md"
  - 
    title: "TreeGraph"
    link: "https://reference.wolfram.com/language/ref/TreeGraph.en.md"
  - 
    title: "ExpressionGraph"
    link: "https://reference.wolfram.com/language/ref/ExpressionGraph.en.md"
  - 
    title: "Graph"
    link: "https://reference.wolfram.com/language/ref/Graph.en.md"
related_tutorials: 
  - 
    title: "Expressions as Trees"
    link: "https://reference.wolfram.com/language/tutorial/Expressions.en.md#14609"
---
# TreeForm

TreeForm[expr] displays expr as a tree with different levels at different depths. 

TreeForm[expr, n] displays expr as a tree only down to level n.

## Details and Options

* With a notebook front end, ``TreeForm`` displays as a graphical tree in ``StandardForm`` and ``TraditionalForm``.

* ``TreeForm`` takes the same options as ``TreePlot``.

* ``VertexLabeling -> Automatic`` does not display expression fragments at each node, but still gives subtree expressions as tooltips.

* ``VertexLabeling -> False`` does not give expression fragments or tooltips.

* The typeset form of ``TreeForm[expr]`` is interpreted the same as ``expr`` when used in input. »

* When an input evaluates to ``TreeForm[expr]``, ``TreeForm`` does not appear in the output. »

### List of all options

|                        |                 |                                                                                    |
| ---------------------- | --------------- | ---------------------------------------------------------------------------------- |
| AlignmentPoint         | Center          | the default point in the graphic to align with                                     |
| AspectRatio            | Automatic       | ratio of height to width                                                           |
| Axes                   | False           | whether to draw axes                                                               |
| AxesLabel              | None            | axes labels                                                                        |
| AxesOrigin             | Automatic       | where axes should cross                                                            |
| AxesStyle              | {}              | style specifications for the axes                                                  |
| Background             | None            | background color for the plot                                                      |
| BaselinePosition       | Automatic       | how to align with a surrounding text baseline                                      |
| BaseStyle              | {}              | base style specifications for the graphic                                          |
| ContentSelectable      | Automatic       | whether to allow contents to be selected                                           |
| CoordinatesToolOptions | Automatic       | detailed behavior of the coordinates tool                                          |
| DataRange              | Automatic       | the range of vertex coordinates to generate                                        |
| DirectedEdges          | False           | whether to interpret Rule as DirectedEdge                                          |
| EdgeLabels             | None            | labels and placements for edges                                                    |
| EdgeLabelStyle         | Automatic       | style to use for edge labels                                                       |
| EdgeShapeFunction      | Automatic       | generate graphic shapes for edges                                                  |
| EdgeStyle              | Automatic       | styles for edges                                                                   |
| Epilog                 | {}              | primitives rendered after the main plot                                            |
| FormatType             | TraditionalForm | the default format type for text                                                   |
| Frame                  | False           | whether to put a frame around the plot                                             |
| FrameLabel             | None            | frame labels                                                                       |
| FrameStyle             | {}              | style specifications for the frame                                                 |
| FrameTicks             | Automatic       | frame ticks                                                                        |
| FrameTicksStyle        | {}              | style specifications for frame ticks                                               |
| GraphHighlight         | {}              | vertices and edges to highlight                                                    |
| GraphHighlightStyle    | Automatic       | style for highlight                                                                |
| GridLines              | None            | grid lines to draw                                                                 |
| GridLinesStyle         | {}              | style specifications for grid lines                                                |
| ImageMargins           | 0.              | the margins to leave around the graphic                                            |
| ImagePadding           | All             | what extra padding to allow for labels etc.                                        |
| ImageSize              | Automatic       | the absolute size at which to render the graphic                                   |
| LabelStyle             | {}              | style specifications for labels                                                    |
| LayerSizeFunction      | (1)             | the height to allow for each layer                                                 |
| Method                 | Automatic       | details of graphics methods to use                                                 |
| PerformanceGoal        | Automatic       | aspects of performance to try to optimize                                          |
| PlotLabel              | None            | an overall label for the plot                                                      |
| PlotRange              | All             | range of values to include                                                         |
| PlotRangeClipping      | False           | whether to clip at the plot range                                                  |
| PlotRangePadding       | Automatic       | how much to pad the range of values                                                |
| PlotRegion             | Automatic       | the final display region to be filled                                              |
| PlotStyle              | Automatic       | graphics directives to determine styles                                            |
| PlotTheme              | Automatic       | overall theme for the graph                                                        |
| PreserveImageOptions   | Automatic       | whether to preserve image options when displaying new versions of the same graphic |
| Prolog                 | {}              | primitives rendered before the main plot                                           |
| RotateLabel            | True            | whether to rotate y labels on the frame                                            |
| Ticks                  | Automatic       | axes ticks                                                                         |
| TicksStyle             | {}              | style specifications for axes ticks                                                |
| VertexCoordinates      | Automatic       | coordinates for vertices                                                           |
| VertexLabels           | None            | labels and placements for vertices                                                 |
| VertexLabelStyle       | Automatic       | style to use for vertex labels                                                     |
| VertexShape            | Automatic       | graphic shape for vertices                                                         |
| VertexShapeFunction    | Automatic       | generate graphic shapes for vertices                                               |
| VertexSize             | Automatic       | size of vertices                                                                   |
| VertexStyle            | Automatic       | styles for vertices                                                                |

---

## Examples (37)

### Basic Examples (3)

A symbolic expression formatted as a tree:

```wl
In[1]:= TreeForm[a + b ^ 2 + c ^ 3 + d]

Out[1]//TreeForm= TreeForm[a + b^2 + c^3 + d]
```

---

Show the tree form for the first two levels in the expression:

```wl
In[1]:= p = HornerForm[1 + x + x ^ 2 + x ^ 3, x]

Out[1]= 1 + x (1 + x (1 + x))

In[2]:= TreeForm[p, 2]

Out[2]//TreeForm= TreeForm[1 + x*(1 + x*(1 + x)), 2]
```

---

A graphics expression formatted as a tree:

```wl
In[1]:= [image]//TreeForm

Out[1]//TreeForm= TreeForm[Graphics[{RGBColor[1, 0, 0], Disk[{0, 0}]}, ImageSize -> 80]]
```

### Scope (9)

A formatted symbolic expression with mathematical constants:

```wl
In[1]:= TreeForm[E^n I π]

Out[1]//TreeForm= TreeForm[E^((Complex[0, 1]*n)*Pi)]
```

---

A formatted expression with symbolic, exact and inexact values:

```wl
In[1]:= TreeForm[(1/3) Sqrt[10]E^.25^x]

Out[1]//TreeForm= TreeForm[(Rational[1, 3]*Sqrt[10])*E^0.25^x]
```

---

A nested list:

```wl
In[1]:= TreeForm[{1, {2, {3}}}]

Out[1]//TreeForm= TreeForm[{1, {2, {3}}}]
```

---

An expression containing subscripted variables:

```wl
In[1]:= TreeForm[Subscript[x, 1] + Subscript[x, 2]]

Out[1]//TreeForm= TreeForm[Subscript[x, 1] + Subscript[x, 2]]
```

---

A formatted expression with a special superscript and ``OverBar`` :

```wl
In[1]:= TreeForm[x^† + Overscript[y, _]]

Out[1]//TreeForm= TreeForm[OverBar[y] + SuperDagger[x]]
```

---

A graphic object:

```wl
In[1]:= [image]//TreeForm

Out[1]//TreeForm= TreeForm[Graphics[{RGBColor[1, 0, 0], Disk[{0, 0}]}, ImageSize -> 80]]
```

---

A ``Series`` expression:

```wl
In[1]:= ser = Series[Sin[x], {x, 0, 5}]

Out[1]= SeriesData[x, 0, {1, 0, Rational[-1, 6], 0, Rational[1, 120]}, 1, 6, 1]

In[2]:= TreeForm[ser]

Out[2]//TreeForm= TreeForm[SeriesData[x, 0, {1, 0, Rational[-1, 6], 0, Rational[1, 120]}, 1, 6, 1]]
```

---

An expression containing ``Hold`` :

```wl
In[1]:= TreeForm[Hold[1 + 2 + 3]]

Out[1]//TreeForm= TreeForm[Hold[1 + 2 + 3]]
```

---

Limit the levels shown:

```wl
In[1]:= TreeForm[Nest[{#, {#, {#}}}&, x, 2], 4]

Out[1]//TreeForm= TreeForm[{{x, {x, {x}}}, {{x, {x, {x}}}, {{x, {x, {x}}}}}}, 4]
```

### Options (14)

#### AspectRatio (2)

By default a suitable aspect ratio is calculated for good visual appearance:

```wl
In[1]:= TreeForm[Nest[{#, #, #}&, x, 2]]

Out[1]//TreeForm= TreeForm[{{x, x, x}, {x, x, x}, {x, x, x}}]
```

---

Change the aspect ratio:

```wl
In[1]:= TreeForm[Nest[{#, #, #}&, x, 2], AspectRatio -> .3]

Out[1]//TreeForm= TreeForm[{{x, x, x}, {x, x, x}, {x, x, x}}, AspectRatio -> 0.3]
```

#### DirectedEdges (1)

Show directed edges:

```wl
In[1]:= TreeForm[Integrate[1 / (1 + 1 / (1 + x)), x], DirectedEdges -> True]

Out[1]//TreeForm= TreeForm[x - Log[2 + x], DirectedEdges -> True]
```

#### EdgeRenderingFunction (2)

Draw edges using blue arrows set back by 30%:

```wl
In[1]:= TreeForm[D[x Exp[x], x], EdgeRenderingFunction -> ({Blue, Arrow[#, .3]}&)]

Out[1]//TreeForm= TreeForm[E^x + E^x*x, EdgeRenderingFunction -> ({Blue, Arrow[#1, 0.3]} & )]
```

---

Draw vertices only:

```wl
In[1]:= TreeForm[D[x Exp[x], x], EdgeRenderingFunction -> None]

Out[1]//TreeForm= TreeForm[E^x + E^x*x, EdgeRenderingFunction -> None]
```

#### LayerSizeFunction (1)

Draw a tree with the first level of height 1, the second level 2, etc.:

```wl
In[1]:= TreeForm[Nest[{#, #}&, x, 4], LayerSizeFunction -> (#&)]

Out[1]//TreeForm=
TreeForm[{{{{x, x}, {x, x}}, {{x, x}, {x, x}}}, {{{x, x}, {x, x}}, {{x, x}, {x, x}}}}, 
 LayerSizeFunction -> (#1 & )]
```

#### PlotRangePadding (1)

Use different ``PlotRangePadding`` around the drawing:

```wl
In[1]:= Table[Framed[TreeForm[D[x Cos[x] Sin[x], x], PlotRangePadding -> p], FrameMargins -> 0], {p, {0, Scaled[0.2]}}]

Out[1]= [image]
```

#### PlotStyle (3)

Specify an overall style for the drawing:

```wl
In[1]:= Table[TreeForm[Cos[Exp[x]], PlotStyle -> ps], {ps, {Red, PointSize[Medium], Dashed, Directive[Red, PointSize[Medium], Dashed]}}]

Out[1]=
{TreeForm[Cos[E^x], PlotStyle -> RGBColor[1, 0, 0]], TreeForm[Cos[E^x], PlotStyle -> PointSize[Medium]], TreeForm[Cos[E^x], PlotStyle -> Dashing[{Small, Small}]], TreeForm[Cos[E^x], PlotStyle -> Directive[RGBColor[1, 0, 0], PointSize[Medium], 
   Dashing[{Small, Small}]]]}
```

---

``PlotStyle`` can be combined with ``VertexRenderingFunction``, which has higher priority:

```wl
In[1]:= TreeForm[Cos[Exp[x]], PlotStyle -> Directive[PointSize[Large], Red], VertexRenderingFunction -> Function[{p, l}, {Green, Point[p]}]]

Out[1]//TreeForm=
TreeForm[Cos[E^x], PlotStyle -> Directive[PointSize[Large], RGBColor[1, 0, 0]], 
 VertexRenderingFunction -> Function[{p, l}, {Green, Point[p]}]]
```

---

``PlotStyle`` can be combined with ``EdgeRenderingFunction``, which has higher priority:

```wl
In[1]:= TreeForm[Cos[Exp[x]], PlotStyle -> Directive[Dashed, Red], EdgeRenderingFunction -> Function[{p, vl, el}, {Green, Line[p]}]]

Out[1]//TreeForm=
TreeForm[Cos[E^x], PlotStyle -> Directive[Dashing[{Small, Small}], RGBColor[1, 0, 0]], 
 EdgeRenderingFunction -> Function[{p, vl, el}, {Green, Line[p]}]]
```

#### VertexLabeling (1)

Display subtree expressions as tooltips:

```wl
In[1]:= TreeForm[Nest[{#, {#}, #}&, x, 3], VertexLabeling -> Automatic]

Out[1]//TreeForm=
TreeForm[{{{x, {x}, x}, {{x, {x}, x}}, {x, {x}, x}}, {{{x, {x}, x}, {{x, {x}, x}}, {x, {x}, x}}}, 
  {{x, {x}, x}, {{x, {x}, x}}, {x, {x}, x}}}, VertexLabeling -> Automatic]
```

#### VertexRenderingFunction (2)

Show no vertices:

```wl
In[1]:= TreeForm[D[Sin[Cos[x]], x], VertexRenderingFunction -> None]

Out[1]//TreeForm= TreeForm[(-Cos[Cos[x]])*Sin[x], VertexRenderingFunction -> None]
```

---

Render vertices using a predefined graphic:

```wl
In[1]:= gr = [image];

In[2]:= TreeForm[Nest[{#, {#}}&, x, 3], VertexRenderingFunction -> (Inset[gr, #1]&)]

Out[2]//TreeForm=
TreeForm[{{{x, {x}}, {{x, {x}}}}, {{{x, {x}}, {{x, {x}}}}}}, 
 VertexRenderingFunction -> (Inset[gr, #1] & )]
```

#### VertexCoordinateRules (1)

Explicitly specify all vertex coordinates:

```wl
In[1]:= TreeForm[x ^ 2 + x ^ 4, VertexCoordinateRules -> {{0, 2}, {0, 1}, {0, 0}, {2, -1}, {2, 1}, {1, 3}, {3, 1}}]

Out[1]//TreeForm=
TreeForm[x^2 + x^4, VertexCoordinateRules -> {{0, 2}, {0, 1}, {0, 0}, {2, -1}, {2, 1}, {1, 3}, 
   {3, 1}}]
```

### Applications (1)

Visualize the Wolfram Axiom for Boolean algebra as a tree:

```wl
In[1]:= TreeForm[f[f[f[p, q], r], f[p, f[f[p, r], p]]] == r]

Out[1]//TreeForm= TreeForm[f[f[f[p, q], r], f[p, f[f[p, r], p]]] == r]
```

### Properties & Relations (6)

``FullForm`` gives a linear expression similar to ``TreeForm`` :

```wl
In[1]:= FullForm[1 / (a + b) * x ^ 2]

Out[1]//FullForm= Times[Power[Plus[a, b], -1], Power[x, 2]]

In[2]:= TreeForm[1 / (a + b) * x ^ 2]

Out[2]//TreeForm= TreeForm[x^2/(a + b)]
```

``OutputForm`` of ``TreeForm`` gives a textual display of the expression:

```wl
In[3]:= TreeForm[1 / (a + b) * x ^ 2]//OutputForm
```

Out[3]//OutputForm= x^2/(a + b)

---

Use ``TreePlot`` to plot a tree graph:

```wl
In[1]:= TreePlot[Table[i -> RandomInteger[{0, i - 1}], {i, 50}]]

Out[1]= [image]
```

---

Use ``GraphPlot`` or ``GraphPlot3D`` for general undirected graphs:

```wl
In[1]:= GraphPlot[Table[i -> Mod[i ^ 2, 150], {i, 0, 150}]]

Out[1]= [image]

In[2]:= GraphPlot3D[Table[i -> Mod[i ^ 2, 150], {i, 0, 150}]]

Out[2]= [image]
```

---

Use ``LayeredGraphPlot`` for hierarchical-style drawing of directed graphs:

```wl
In[1]:= LayeredGraphPlot[Table[RandomInteger[{0, 50}] -> i, {i, 50}]]

Out[1]= [image]
```

---

The typeset form of ``TreeForm[expr]`` is interpreted the same as ``expr`` when used in input:

```wl
In[1]:= {TreeForm[x ^ 2]}

Out[1]= {TreeForm[x^2]}
```

Copy the output and paste it into an input cell. The
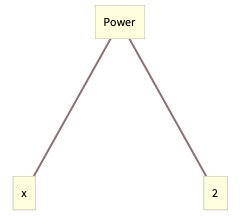
 ``TreeForm[x^2]`` is interpreted as ``x^2`` :

```wl
In[2]:= {TreeForm[x^2]}

Out[2]= {x^2}
```

---

When an input evaluates to ``TreeForm[expr]``, ``TreeForm`` does not appear in the output:

```wl
In[1]:= TreeForm[x ^ 2]

Out[1]//TreeForm= TreeForm[x^2]
```

``Out`` is assigned the value ``x^2``, not ``TreeForm[x ^ 2]`` :

```wl
In[2]:= %

Out[2]= x^2
```

### Possible Issues (2)

Compound heads are not laid out as trees:

```wl
In[1]:= TreeForm[g[a][b]]

Out[1]//TreeForm= TreeForm[g[a][b]]
```

---

Even when an output omits ``TreeForm`` from the top level, it is not stripped from subexpressions:

```wl
In[1]:= e = TreeForm[x ^ 2]

Out[1]//TreeForm= TreeForm[x^2]
```

The output does not have ``TreeForm`` in it:

```wl
In[2]:= %

Out[2]= x^2
```

However, the variable ``e`` does have ``TreeForm`` in it, which may affect subsequent evaluations:

```wl
In[3]:= FullForm[e]

Out[3]//FullForm= TreeForm[Power[x, 2]]
```

The product is not evaluated due to the intervening ``TreeForm`` :

```wl
In[4]:= x * e

Out[4]= x TreeForm[x^2]
```

Assign variables first and then apply ``TreeForm`` to the result to maintain computability:

```wl
In[5]:= (f = x ^ 2)//TreeForm

Out[5]//TreeForm= TreeForm[x^2]

In[6]:= x * f

Out[6]= x^3
```

### Neat Examples (2)

A complete binary tree:

```wl
In[1]:= Nest[{#, #}&, x, 4]

Out[1]= {{{{x, x}, {x, x}}, {{x, x}, {x, x}}}, {{{x, x}, {x, x}}, {{x, x}, {x, x}}}}

In[2]:= TreeForm[%]

Out[2]//TreeForm= TreeForm[{{{{x, x}, {x, x}}, {{x, x}, {x, x}}}, {{{x, x}, {x, x}}, {{x, x}, {x, x}}}}]
```

A complete ternary tree:

```wl
In[3]:= Nest[{#, #, #}&, x, 3]

Out[3]= {{{x, x, x}, {x, x, x}, {x, x, x}}, {{x, x, x}, {x, x, x}, {x, x, x}}, {{x, x, x}, {x, x, x}, {x, x, x}}}

In[4]:= TreeForm[%]

Out[4]//TreeForm=
TreeForm[{{{x, x, x}, {x, x, x}, {x, x, x}}, {{x, x, x}, {x, x, x}, {x, x, x}}, 
  {{x, x, x}, {x, x, x}, {x, x, x}}}]
```

---

A symmetric tree:

```wl
In[1]:= TreeForm[Nest[{#, {#}, #}&, x, 5], VertexLabeling -> Automatic]

Out[1]//TreeForm=
TreeForm[{{{{{x, {x}, x}, {{x, {x}, x}}, {x, {x}, x}}, {{{x, {x}, x}, {{x, {x}, x}}, {x, {x}, x}}}, 
    {{x, {x}, x}, {{x, {x}, x}}, {x, {x}, x}}}, {{{{x, {x}, x}, {{x, {x}, x}}, {x, {x}, x}}, 
     {{{x, {x}, x}, {{x, {x}, x}}, {x, {x}, x}}}, {{x ... {{x, {x}, x}}, {x, {x}, x}}}, {{x, {x}, x}, {{x, {x}, x}}, {x, {x}, x}}}}, 
   {{{x, {x}, x}, {{x, {x}, x}}, {x, {x}, x}}, {{{x, {x}, x}, {{x, {x}, x}}, {x, {x}, x}}}, 
    {{x, {x}, x}, {{x, {x}, x}}, {x, {x}, x}}}}}, VertexLabeling -> Automatic]
```

An asymmetric tree:

```wl
In[2]:= TreeForm[Nest[{{#}, #, #}&, x, 5], VertexLabeling -> Automatic]

Out[2]//TreeForm=
TreeForm[{{{{{{{{{{x}, x, x}}, {{x}, x, x}, {{x}, x, x}}}, {{{{x}, x, x}}, {{x}, x, x}, 
       {{x}, x, x}}, {{{{x}, x, x}}, {{x}, x, x}, {{x}, x, x}}}}, 
    {{{{{{x}, x, x}}, {{x}, x, x}, {{x}, x, x}}}, {{{{x}, x, x}}, {{x}, x, x}, {{x}, x, x}}, ... }}, {{x}, x, x}, {{x}, x, x}}, {{{{x}, x, x}}, {{x}, x, x}, {{x}, x, x}}}, 
   {{{{{{x}, x, x}}, {{x}, x, x}, {{x}, x, x}}}, {{{{x}, x, x}}, {{x}, x, x}, {{x}, x, x}}, 
    {{{{x}, x, x}}, {{x}, x, x}, {{x}, x, x}}}}}, VertexLabeling -> Automatic]
```

## See Also

* [`FullForm`](https://reference.wolfram.com/language/ref/FullForm.en.md)
* [`MatrixForm`](https://reference.wolfram.com/language/ref/MatrixForm.en.md)
* [`LeafCount`](https://reference.wolfram.com/language/ref/LeafCount.en.md)
* [`ExpressionTree`](https://reference.wolfram.com/language/ref/ExpressionTree.en.md)
* [`TreePlot`](https://reference.wolfram.com/language/ref/TreePlot.en.md)
* [`TreeGraph`](https://reference.wolfram.com/language/ref/TreeGraph.en.md)
* [`ExpressionGraph`](https://reference.wolfram.com/language/ref/ExpressionGraph.en.md)
* [`Graph`](https://reference.wolfram.com/language/ref/Graph.en.md)

## Tech Notes

* [Expressions as Trees](https://reference.wolfram.com/language/tutorial/Expressions.en.md#14609)

## Related Guides

* [Expression Structure](https://reference.wolfram.com/language/guide/ExpressionStructure.en.md)
* [`Expressions`](https://reference.wolfram.com/language/guide/Expressions.en.md)
* [Tree Visualization](https://reference.wolfram.com/language/guide/TreeVisualization.en.md)
* [Graph Visualization](https://reference.wolfram.com/language/guide/GraphVisualization.en.md)
* [`Trees`](https://reference.wolfram.com/language/guide/Trees.en.md)

## Related Workflows

* [Find the Underlying Tree Structure of an Expression](https://reference.wolfram.com/language/workflow/FindTheUnderlyingTreeStructureOfAnExpression.en.md)

## Related Links

* [An Elementary Introduction to the Wolfram Language: Expressions and Their Structure](https://www.wolfram.com/language/elementary-introduction/33-expressions-and-their-structure.html)

## History

* Introduced in 1988 (1.0) \| [Updated in 2007 (6.0)](https://reference.wolfram.com/language/guide/SummaryOfNewFeaturesIn60.en.md)