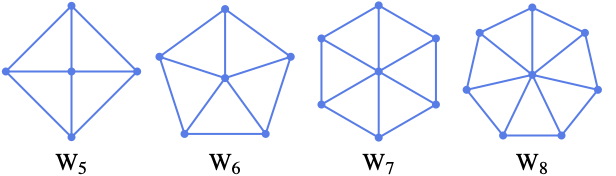
---
title: "WheelGraph"
language: "en"
type: "Symbol"
summary: "WheelGraph[n] gives the wheel graph with n vertices Wn."
keywords: 
- wheel graph
- circle graph with center
- standard graph
canonical_url: "https://reference.wolfram.com/language/ref/WheelGraph.html"
source: "Wolfram Language Documentation"
related_guides: 
  - 
    title: "Graph Construction & Representation"
    link: "https://reference.wolfram.com/language/guide/GraphConstructionAndRepresentation.en.md"
related_functions: 
  - 
    title: "Graph"
    link: "https://reference.wolfram.com/language/ref/Graph.en.md"
  - 
    title: "GraphData"
    link: "https://reference.wolfram.com/language/ref/GraphData.en.md"
  - 
    title: "CycleGraph"
    link: "https://reference.wolfram.com/language/ref/CycleGraph.en.md"
  - 
    title: "StarGraph"
    link: "https://reference.wolfram.com/language/ref/StarGraph.en.md"
---
# WheelGraph

WheelGraph[n] gives the wheel graph with n vertices $W_n$.

## Details and Options

* A wheel graph of order ``n`` is a graph formed by connecting a single vertex to all the vertices of a cycle of order ``n - 1``.

[image]

* ``WheelGraph[…, DirectedEdges -> True]`` gives a directed wheel graph.

* ``WheelGraph`` takes the same options as ``Graph``.

### List of all options

|                        |                 |                                                                                    |
| ---------------------- | --------------- | ---------------------------------------------------------------------------------- |
| AlignmentPoint         | Center          | the default point in the graphic to align with                                     |
| AnnotationRules        | {}              | annotations for graph, edges and vertices                                          |
| AspectRatio            | Automatic       | ratio of height to width                                                           |
| Axes                   | False           | whether to draw axes                                                               |
| AxesLabel              | None            | axes labels                                                                        |
| AxesOrigin             | Automatic       | where axes should cross                                                            |
| AxesStyle              | {}              | style specifications for the axes                                                  |
| Background             | None            | background color for the plot                                                      |
| BaselinePosition       | Automatic       | how to align with a surrounding text baseline                                      |
| BaseStyle              | {}              | base style specifications for the graphic                                          |
| ContentSelectable      | Automatic       | whether to allow contents to be selected                                           |
| CoordinatesToolOptions | Automatic       | detailed behavior of the coordinates tool                                          |
| DirectedEdges          | Automatic       | whether to interpret Rule as DirectedEdge                                          |
| EdgeLabels             | None            | labels and label placements for edges                                              |
| EdgeLabelStyle         | Automatic       | style to use for edge labels                                                       |
| EdgeShapeFunction      | Automatic       | generate graphic shapes for edges                                                  |
| EdgeStyle              | Automatic       | style used for edges                                                               |
| EdgeWeight             | Automatic       | weights for edges                                                                  |
| Epilog                 | {}              | primitives rendered after the main plot                                            |
| FormatType             | TraditionalForm | the default format type for text                                                   |
| Frame                  | False           | whether to put a frame around the plot                                             |
| FrameLabel             | None            | frame labels                                                                       |
| FrameStyle             | {}              | style specifications for the frame                                                 |
| FrameTicks             | Automatic       | frame ticks                                                                        |
| FrameTicksStyle        | {}              | style specifications for frame ticks                                               |
| GraphHighlight         | {}              | graph elements to highlight                                                        |
| GraphHighlightStyle    | Automatic       | style for highlight                                                                |
| GraphLayout            | Automatic       | how to lay out vertices and edges                                                  |
| GridLines              | None            | grid lines to draw                                                                 |
| GridLinesStyle         | {}              | style specifications for grid lines                                                |
| ImageMargins           | 0.              | the margins to leave around the graphic                                            |
| ImagePadding           | All             | what extra padding to allow for labels etc.                                        |
| ImageSize              | Automatic       | the absolute size at which to render the graphic                                   |
| LabelStyle             | {}              | style specifications for labels                                                    |
| Method                 | Automatic       | details of graphics methods to use                                                 |
| PerformanceGoal        | Automatic       | aspects of performance to try to optimize                                          |
| PlotLabel              | None            | an overall label for the plot                                                      |
| PlotRange              | All             | range of values to include                                                         |
| PlotRangeClipping      | False           | whether to clip at the plot range                                                  |
| PlotRangePadding       | Automatic       | how much to pad the range of values                                                |
| PlotRegion             | Automatic       | the final display region to be filled                                              |
| PlotTheme              | \$PlotTheme     | overall theme for the graph                                                        |
| PreserveImageOptions   | Automatic       | whether to preserve image options when displaying new versions of the same graphic |
| Prolog                 | {}              | primitives rendered before the main plot                                           |
| RotateLabel            | True            | whether to rotate y labels on the frame                                            |
| Ticks                  | Automatic       | axes ticks                                                                         |
| TicksStyle             | {}              | style specifications for axes ticks                                                |
| VertexCoordinates      | Automatic       | coordinates for vertices                                                           |
| VertexLabels           | None            | labels and placements for vertices                                                 |
| VertexLabelStyle       | Automatic       | style to use for vertex labels                                                     |
| VertexShape            | Automatic       | graphic shape for vertices                                                         |
| VertexShapeFunction    | Automatic       | generate graphic shapes for vertices                                               |
| VertexSize             | Medium          | size of vertices                                                                   |
| VertexStyle            | Automatic       | styles for vertices                                                                |
| VertexWeight           | Automatic       | weights for vertices                                                               |

---

## Examples (94)

### Basic Examples (2)

The first few wheel graphs $W_i$ :

```wl
In[1]:= Table[WheelGraph[i, PlotLabel -> Subscript[W, i]], {i, 5, 7}]

Out[1]= {[image], [image], [image]}
```

---

Directed wheel graphs:

```wl
In[1]:= Table[WheelGraph[i, DirectedEdges -> True, EdgeStyle -> Arrowheads[Medium], PlotLabel -> Subscript[W, i]], {i, 5, 7}]

Out[1]= {[image], [image], [image]}
```

### Options (80)

#### AnnotationRules (2)

Specify a property for vertices:

```wl
In[1]:= WheelGraph[4, AnnotationRules -> {1 -> {VertexLabels -> "hello"}}]

Out[1]= [image]
```

---

Edges:

```wl
In[1]:= WheelGraph[4, AnnotationRules -> {1\[UndirectedEdge]2 -> {EdgeLabels -> "hello"}}]

Out[1]= [image]
```

#### DirectedEdges (1)

By default, an undirected graph is generated:

```wl
In[1]:= WheelGraph[8]

Out[1]= [image]
```

Use ``DirectedEdges -> True`` to generate a directed graph:

```wl
In[2]:= WheelGraph[8, DirectedEdges -> True, EdgeStyle -> Arrowheads[Medium]]

Out[2]= [image]
```

#### EdgeLabels (7)

Label the edge ``1\[UndirectedEdge]2``:

```wl
In[1]:= WheelGraph[4, EdgeLabels -> {1\[UndirectedEdge]2 -> "Hello"}]

Out[1]= [image]
```

---

Label all edges individually:

```wl
In[1]:= el = EdgeList[WheelGraph[4]]

Out[1]= {1\[UndirectedEdge]2, 1\[UndirectedEdge]3, 1\[UndirectedEdge]4, 2\[UndirectedEdge]3, 2\[UndirectedEdge]4, 3\[UndirectedEdge]4}

In[2]:= WheelGraph[4, EdgeLabels -> Table[el[[i]] -> Subscript["e", i], {i, Length[el]}]]

Out[2]= [image]
```

---

Use any expression as a label:

```wl
In[1]:= WheelGraph[4, EdgeLabels -> {2\[UndirectedEdge]4 -> [image], 3\[UndirectedEdge]4 -> [image], 1\[UndirectedEdge]3 -> [image]}]

Out[1]= [image]
```

---

Use ``Placed`` with symbolic locations to control label placement along an edge:

```wl
In[1]:= Table[WheelGraph[4, EdgeLabels -> {3\[UndirectedEdge]4 -> Placed["■■■", p]}, PlotLabel -> p], {p, {"Start", "Middle", "End"}}]

Out[1]= {[image], [image], [image]}
```

---

Use explicit coordinates to place labels:

```wl
In[1]:= Table[WheelGraph[4, EdgeLabels -> {2\[UndirectedEdge]3 -> Placed["■■■", p]}, PlotLabel -> p, BaselinePosition -> Bottom], {p, {0, 1 / 4, 1 / 3}}]

Out[1]= {[image], [image], [image]}
```

Vary positions within the label:

```wl
In[2]:= Table[WheelGraph[4, EdgeLabels -> {2\[UndirectedEdge]3 -> Placed["■■■", {1 / 2, p}]}, PlotLabel -> p, BaselinePosition -> Bottom], {p, {{0, 0}, {1 / 2, 1 / 2}, {1, 1}}}]

Out[2]= {[image], [image], [image]}
```

---

Place multiple labels:

```wl
In[1]:= WheelGraph[6, EdgeLabels -> {3\[UndirectedEdge]1 -> Placed[{"lbl1", "lbl2"}, {"Start", "End"}]}]

Out[1]= [image]

In[2]:= WheelGraph[6, EdgeLabels -> {3\[UndirectedEdge]1 -> Placed[{"lbl1", "lbl2", "lbl3"}, {"Start", "Middle", "End"}]}]

Out[2]= [image]
```

---

Use automatic labeling by values through ``Tooltip`` and ``StatusArea``:

```wl
In[1]:= WheelGraph[6, EdgeLabels -> Placed["Name", Tooltip]]

Out[1]= [image]

In[2]:= WheelGraph[6, EdgeLabels -> Placed["Name", StatusArea]]

Out[2]= [image]
```

#### EdgeShapeFunction (6)

Get a list of built-in settings for ``EdgeShapeFunction``:

```wl
In[1]:= ResourceData["EdgeShapeFunction"]

Out[1]= {"Arrow", "BoxLine", "CarvedArcArrow", "CarvedArrow", "DashedLine", "DiamondLine", "DotLine", "DottedLine", "FilledArcArrow", "FilledArrow", "HalfFilledArrow", "HalfFilledDoubleArrow", "HalfUnfilledArrow", "HalfUnfilledDoubleArrow", "Line", "ShortCarvedArcArrow", "ShortCarvedArrow", "ShortFilledArcArrow", "ShortFilledArrow", "ShortUnfilledArcArrow", "ShortUnfilledArrow", "UnfilledArcArrow", "UnfilledArrow"}
```

---

Undirected edges including the basic line:

```wl
In[1]:= WheelGraph[6, EdgeShapeFunction -> "Line"]

Out[1]= [image]
```

Lines with different glyphs on the edges:

```wl
In[2]:= Table[WheelGraph[6, EdgeShapeFunction -> {{ef, "ArrowSize" -> 0.1}}, PlotLabel -> ef], {ef, {"BoxLine", "DiamondLine", "DotLine"}}]

Out[2]= {[image], [image], [image]}
```

---

Directed edges including solid arrows:

```wl
In[1]:= Table[WheelGraph[6, EdgeShapeFunction -> {{ef, "ArrowSize" -> 0.1}}, PlotLabel -> ef], {ef, ResourceData["EdgeShapeFunction", "FilledArrow"]}]

Out[1]= {[image], [image], [image], [image], [image], [image]}
```

Line arrows:

```wl
In[2]:= Table[WheelGraph[6, EdgeShapeFunction -> {{ef, "ArrowSize" -> 0.1}}, PlotLabel -> ef], {ef, ResourceData["EdgeShapeFunction", "UnfilledArrow"]}]

Out[2]= {[image], [image], [image], [image], [image], [image]}
```

Open arrows:

```wl
In[3]:= Table[WheelGraph[6, EdgeShapeFunction -> {{ef, "ArrowSize" -> 0.1}}, PlotLabel -> ef], {ef, ResourceData["EdgeShapeFunction", "CarvedArrow"]}]

Out[3]= {[image], [image], [image], [image]}
```

---

Specify an edge function for an individual edge:

```wl
In[1]:= WheelGraph[6, EdgeShapeFunction -> {1\[UndirectedEdge]2 -> "DotLine"}]

Out[1]= [image]
```

Combine with a different default edge function:

```wl
In[2]:= WheelGraph[6, EdgeShapeFunction -> {1\[UndirectedEdge]2 -> "BoxLine", "DotLine"}]

Out[2]= [image]
```

---

Draw edges by running a program:

```wl
In[1]:=
ef[pts_List, e_] := 
	Block[{s = 0.015, g = [image]}, {Arrowheads[{{s, 0.33, g}, {s, 0.67, g}}], Arrow[pts]}]

In[2]:= WheelGraph[6, EdgeShapeFunction -> ef]

Out[2]= [image]
```

---

``EdgeShapeFunction`` can be combined with ``EdgeStyle``:

```wl
In[1]:= WheelGraph[6, EdgeStyle -> Blue, EdgeShapeFunction -> (Line[#1]&)]

Out[1]= [image]
```

``EdgeShapeFunction`` has higher priority than ``EdgeStyle``:

```wl
In[2]:= WheelGraph[6, EdgeStyle -> Blue, EdgeShapeFunction -> ({Red, Line[#1]}&)]

Out[2]= [image]
```

#### EdgeStyle (2)

Style all edges:

```wl
In[1]:= Table[WheelGraph[6, EdgeStyle -> style, PlotLabel -> style], {style, {Gray, Dashed, Thick}}]

Out[1]= {[image], [image], [image]}
```

---

Style individual edges:

```wl
In[1]:= WheelGraph[6, EdgeStyle -> {1\[UndirectedEdge]2 -> Blue, 1\[UndirectedEdge]3 -> Dashed}]

Out[1]= [image]
```

#### EdgeWeight (2)

Specify a weight for all edges:

```wl
In[1]:= WheelGraph[4, EdgeWeight -> RandomInteger[5, 6]]

Out[1]= [image]

In[2]:= WeightedAdjacencyMatrix[%]//MatrixForm

Out[2]//MatrixForm=
(⁠|   |   |   |   |
| - | - | - | - |
| 0 | 5 | 2 | 2 |
| 5 | 0 | 3 | 3 |
| 2 | 3 | 0 | 2 |
| 2 | 3 | 2 | 0 |⁠)
```

---

Use any numeric expression as a weight:

```wl
In[1]:= WheelGraph[4, EdgeWeight -> {a, b, c, d, e, f}]

Out[1]= [image]

In[2]:= WeightedAdjacencyMatrix[%]//MatrixForm

Out[2]//MatrixForm=
(⁠|   |   |   |   |
| - | - | - | - |
| 0 | a | b | c |
| a | 0 | d | e |
| b | d | 0 | f |
| c | e | f | 0 |⁠)
```

#### GraphHighlight (3)

Highlight the vertex ``1`` :

```wl
In[1]:= WheelGraph[4, VertexSize -> Tiny, GraphHighlight -> {1}]

Out[1]= [image]
```

---

Highlight the edge ``2\[UndirectedEdge]3`` :

```wl
In[1]:= WheelGraph[4, VertexSize -> Tiny, GraphHighlight -> {2\[UndirectedEdge]3}]

Out[1]= [image]
```

---

Highlight vertices and edges:

```wl
In[1]:= WheelGraph[4, VertexSize -> Tiny, GraphHighlight -> {1, 2, 1\[UndirectedEdge]3, 1\[UndirectedEdge]4}]

Out[1]= [image]
```

#### GraphHighlightStyle (2)

Get a list of built-in settings for ``GraphHighlightStyle``:

```wl
In[1]:= ResourceData["GraphHighlightStyle"]

Out[1]= {Automatic, "Dashed", "Dotted", "Thick", "VertexConcaveDiamond", "VertexDiamond", "VertexTriangle", "DehighlightFade", "DehighlightGray", "DehighlightHide"}
```

---

Use built-in settings for ``GraphHighlightStyle`` :

```wl
In[1]:= WheelGraph[4, GraphHighlight -> {1, 2\[UndirectedEdge]3}, VertexSize -> Small, GraphHighlightStyle -> #, PlotLabel -> #]& /@ Select[ResourceData["GraphHighlightStyle"], # =!= Automatic&]

Out[1]= {[image], [image], [image], [image], [image], [image], [image], [image], [image]}
```

#### GraphLayout (5)

By default, the layout is chosen automatically:

```wl
In[1]:= WheelGraph[10, GraphLayout -> Automatic]

Out[1]= [image]
```

---

Specify layouts on special curves:

```wl
In[1]:= Table[WheelGraph[20, GraphLayout -> l, PlotLabel -> l], {l, {"CircularEmbedding", "SpiralEmbedding"}}]

Out[1]= {[image], [image]}
```

---

Specify layouts that satisfy optimality criteria:

```wl
In[1]:= Table[WheelGraph[20, GraphLayout -> l, PlotLabel -> l], {l, {"SpringEmbedding", "SpringElectricalEmbedding", "HighDimensionalEmbedding"}}]

Out[1]= {[image], [image], [image]}
```

---

``VertexCoordinates`` overrides ``GraphLayout`` coordinates:

```wl
In[1]:=
{WheelGraph[5, GraphLayout -> "SpringElectricalEmbedding"], 
	WheelGraph[5, GraphLayout -> "SpringElectricalEmbedding", VertexCoordinates -> Table[{i, i}, {i, 0, 4}]]}

Out[1]= {[image], [image]}
```

---

Use ``AbsoluteOptions`` to extract ``VertexCoordinates`` computed using a layout algorithm:

```wl
In[1]:= WheelGraph[5]

Out[1]= [image]

In[2]:= AbsoluteOptions[%, VertexCoordinates]

Out[2]= {VertexCoordinates -> {{0., 0.}, {6.049014748177263`*^-16, -1.}, {1., -1.133107779529596`*^-15}, {-7.044813998280222`*^-16, 1.}, {-1., 3.6739403974420594`*^-16}}}
```

#### PlotTheme (4)

##### Base Themes (2)

---

Use a common base theme:

```wl
In[1]:= WheelGraph[4, PlotTheme -> "Business"]

Out[1]= [image]
```

---

Use a monochrome theme:

```wl
In[1]:= WheelGraph[4, PlotTheme -> "Monochrome"]

Out[1]= [image]
```

##### Feature Themes (2)

---

Use a large graph theme:

```wl
In[1]:= WheelGraph[4, PlotTheme -> "LargeGraph"]

Out[1]= [image]
```

---

Use a classic diagram theme:

```wl
In[1]:= WheelGraph[4, PlotTheme -> "ClassicDiagram"]

Out[1]= [image]
```

#### VertexCoordinates (3)

By default, any vertex coordinates are computed automatically:

```wl
In[1]:= WheelGraph[6]

Out[1]= [image]
```

Extract the resulting vertex coordinates using ``AbsoluteOptions``:

```wl
In[2]:= AbsoluteOptions[%, VertexCoordinates]

Out[2]= {VertexCoordinates -> {{0., 0.}, {-0.587785, -0.809017}, {0.587785, -0.809017}, {0.951057, 0.309017}, {-7.044813998280222`*^-16, 1.}, {-0.951057, 0.309017}}}
```

---

Specify a layout function along an ellipse:

```wl
In[1]:= ellipseLayout[n_, {a_, b_}] := Table[{a Cos[2Pi / n u], b Sin[2Pi / n u]}, {u, 1, n}]

In[2]:= Graphics[Point[ellipseLayout[20, {2, 1}]]]

Out[2]= [image]
```

Use it to generate vertex coordinates for a graph:

```wl
In[3]:= WheelGraph[20, VertexCoordinates -> ellipseLayout[20, {2, 1}]]

Out[3]= [image]
```

---

``VertexCoordinates`` has higher priority than ``GraphLayout`` :

```wl
In[1]:= WheelGraph[4, VertexCoordinates -> Table[{i, i}, {i, 4}], GraphLayout -> "CircularEmbedding"]

Out[1]= [image]
```

#### VertexLabels (13)

Use vertex names as labels:

```wl
In[1]:= WheelGraph[4, VertexLabels -> "Name"]

Out[1]= [image]
```

---

Label individual vertices:

```wl
In[1]:= WheelGraph[4, VertexLabels -> {2 -> "one"}]

Out[1]= [image]
```

---

Label all vertices:

```wl
In[1]:= WheelGraph[4, VertexLabels -> Table[i -> Subscript[v, i], {i, 4}]]

Out[1]= [image]
```

---

Use any expression as a label:

```wl
In[1]:= WheelGraph[4, VertexLabels -> {1 -> [image], 2 -> [image], 3 -> [image]}, ImagePadding -> 20]

Out[1]= [image]
```

---

Use ``Placed`` with symbolic locations to control label placement, including outside positions:

```wl
In[1]:= Table[WheelGraph[4, VertexSize -> 0.1, VertexShapeFunction -> "Square", VertexLabels -> Table[i -> Placed["■■■", p], {i, 4}], PlotLabel -> p, ImagePadding -> 20], {p, {Before, After, Below, Above}}]

Out[1]= {[image], [image], [image], [image]}
```

---

Symbolic outside corner positions:

```wl
In[1]:= pl = {{Before, Below}, {After, Below}, {Before, Above}, {After, Above}};

In[2]:= Table[WheelGraph[4, VertexSize -> 0.1, VertexShapeFunction -> "Square", ImagePadding -> 20, VertexLabels -> Table[i -> Placed["■■■", p], {i, 4}], PlotLabel -> p], {p, pl}]

Out[2]= {[image], [image], [image], [image]}
```

---

Symbolic inside positions:

```wl
In[1]:= Table[WheelGraph[4, VertexSize -> 0.45, VertexLabels -> Table[i -> Placed["■■■", p], {i, 4}], VertexShapeFunction -> "Square", PlotLabel -> p], {p, {Left, Top, Right, Bottom}}]

Out[1]= {[image], [image], [image], [image]}
```

---

Symbolic inside corner positions:

```wl
In[1]:= pl = {{Left, Bottom}, {Right, Bottom}, {Left, Top}, {Right, Top}};

In[2]:= Table[WheelGraph[4, VertexSize -> 0.45, VertexShapeFunction -> "Square", VertexLabels -> Table[i -> Placed["■■■", p], {i, 4}], PlotLabel -> p], {p, pl}]

Out[2]= {[image], [image], [image], [image]}
```

---

Use explicit coordinates to place the center of labels:

```wl
In[1]:= Table[WheelGraph[4, VertexSize -> 0.25, VertexShapeFunction -> "Square", VertexLabels -> Table[i -> Placed[[image], p], {i, 4}], PlotLabel -> p, BaselinePosition -> Bottom], {p, {{0, 0}, {1 / 2, 1 / 2}, {1, 1}}}]

Out[1]= {[image], [image], [image]}
```

---

Place all labels at the upper-right corner of the vertex and vary the coordinates within the label:

```wl
In[1]:= Table[WheelGraph[4, VertexSize -> 0.35, VertexShapeFunction -> "Square", VertexLabels -> Table[i -> Placed[[image], {{1, 1}, p}], {i, 4}], PlotLabel -> p, BaselinePosition -> Bottom], {p, {{0, 0}, {1 / 2, 1 / 2}, {1, 1}}}]

Out[1]= {[image], [image], [image]}
```

---

Place multiple labels:

```wl
In[1]:= WheelGraph[4, VertexLabels -> {1 -> Placed[{"lbl1", "lbl2"}, {Above, Below}]}]

Out[1]= [image]
```

Any number of labels can be used:

```wl
In[2]:= WheelGraph[4, VertexLabels -> {1 -> Placed[{"lbl1", "lbl2", "lbl3", "lbl4"}, {Above, After, Below, Before}]}]

Out[2]= [image]
```

---

Use the argument to ``Placed`` to control formatting including ``Tooltip``:

```wl
In[1]:= WheelGraph[4, VertexLabels -> Placed["Name", Tooltip]]

Out[1]= [image]
```

Or ``StatusArea``:

```wl
In[2]:= WheelGraph[4, VertexLabels -> Placed["Name", StatusArea]]

Out[2]= [image]
```

---

Use more elaborate formatting functions:

```wl
In[1]:= rotateLabel[lbl_] := Rotate[lbl, 45Degree]

In[2]:= WheelGraph[4, VertexLabels -> Table[i -> Placed["xxx", Below, rotateLabel], {i, 4}]]

Out[2]= [image]

In[3]:= panelLabel[lbl_] := Panel[lbl, FrameMargins -> 0, Background -> Lighter[Yellow, 0.7]]

In[4]:= WheelGraph[4, VertexLabels -> Table[i -> Placed["xxx", Center, panelLabel], {i, 4}]]

Out[4]= [image]

In[5]:= hyperlinkLabel[lbl_] := Hyperlink[lbl, "http://www.wolfram.com"]

In[6]:= WheelGraph[4, VertexLabels -> Table[i -> Placed["xxx", Center, hyperlinkLabel], {i, 4}]]

Out[6]= [image]
```

#### VertexShape (5)

Use any ``Graphics``, ``Image``, or ``Graphics3D`` as a vertex shape:

```wl
In[1]:= Table[WheelGraph[6, VertexShape -> s, VertexSize -> Medium], {s, {[image], [image], [image]}}]

Out[1]= {[image], [image], [image]}
```

---

Specify vertex shapes for individual vertices:

```wl
In[1]:= WheelGraph[6, VertexShape -> {2 -> [image]}, VertexSize -> Medium]

Out[1]= [image]
```

---

``VertexShape`` can be combined with ``VertexSize``:

```wl
In[1]:= Table[WheelGraph[6, VertexSize -> s, VertexShape -> [image], PlotLabel -> s], {s, {Small, Large}}]

Out[1]= {[image], [image]}
```

---

``VertexShape`` is not affected by ``VertexStyle``:

```wl
In[1]:= WheelGraph[6, VertexSize -> 0.2, VertexShape -> [image], VertexStyle -> Blue]

Out[1]= [image]
```

---

``VertexShapeFunction`` has higher priority than ``VertexShape`` :

```wl
In[1]:= WheelGraph[6, VertexSize -> 0.2, VertexShapeFunction -> "Square", VertexShape -> [image]]

Out[1]= [image]
```

#### VertexShapeFunction (10)

Get a list of built-in collections for ``VertexShapeFunction``:

```wl
In[1]:= ResourceData["VertexShapeFunction"]

Out[1]= {"Capsule", "Circle", "ConcaveDiamond", "ConcaveHexagon", "ConcavePentagon", "ConcaveSquare", "ConcaveTriangle", "Diamond", "DownTrapezoid", "FiveDown", "Hexagon", "Octagon", "Parallelogram", "Pentagon", "Point", "Rectangle", "RoundedDiamond", "RoundedDownTrapezoid", "RoundedFiveDown", "RoundedHexagon", "RoundedParallelogram", "RoundedPentagon", "RoundedRectangle", "RoundedSquare", "RoundedTriangle", "RoundedUpTrapezoid", "Square", "Star", "Triangle", "UpTrapezoid"}
```

---

Use built-in settings for ``VertexShapeFunction`` in the ``"Basic"`` collection:

```wl
In[1]:= ResourceData["VertexShapeFunction", "Basic"]

Out[1]= {"Capsule", "Circle", "Diamond", "DownTrapezoid", "FiveDown", "Hexagon", "Octagon", "Parallelogram", "Pentagon", "Point", "Rectangle", "Square", "Star", "Triangle", "UpTrapezoid"}
```

Simple basic shapes:

```wl
In[2]:= Table[WheelGraph[6, VertexShapeFunction -> vf, VertexSize -> 0.2, PlotLabel -> vf], {vf, {"Triangle", "Square", "Rectangle", "Pentagon", "Hexagon", "Octagon"}}]

Out[2]= {[image], [image], [image], [image], [image], [image]}
```

Common basic shapes:

```wl
In[3]:= Table[WheelGraph[6, VertexShapeFunction -> vf, VertexSize -> 0.2, PlotLabel -> vf], {vf, {"DownTrapezoid", "UpTrapezoid", "Parallelogram", "FiveDown", "Circle", "Diamond", "Star", "Capsule"}}]

Out[3]= {[image], [image], [image], [image], [image], [image], [image], [image]}
```

---

Use built-in settings for ``VertexShapeFunction`` in the ``"Rounded"`` collection:

```wl
In[1]:= ResourceData["VertexShapeFunction", "Rounded"]

Out[1]= {"RoundedDiamond", "RoundedDownTrapezoid", "RoundedFiveDown", "RoundedHexagon", "RoundedParallelogram", "RoundedPentagon", "RoundedRectangle", "RoundedSquare", "RoundedTriangle", "RoundedUpTrapezoid"}

In[2]:= Table[WheelGraph[6, VertexShapeFunction -> vf, VertexSize -> 0.2, PlotLabel -> vf], {vf, ResourceData["VertexShapeFunction", "Rounded"]}]

Out[2]= {[image], [image], [image], [image], [image], [image], [image], [image], [image], [image]}
```

---

Use built-in settings for ``VertexShapeFunction`` in the ``"Concave"`` collection:

```wl
In[1]:= ResourceData["VertexShapeFunction", "Concave"]

Out[1]= {"ConcaveDiamond", "ConcaveHexagon", "ConcavePentagon", "ConcaveSquare", "ConcaveTriangle"}

In[2]:= Table[WheelGraph[6, VertexShapeFunction -> vf, VertexSize -> 0.2, PlotLabel -> vf], {vf, ResourceData["VertexShapeFunction", "Concave"]}]

Out[2]= {[image], [image], [image], [image], [image]}
```

---

Draw individual vertices:

```wl
In[1]:= WheelGraph[6, VertexShapeFunction -> { 1 -> "Square"}, VertexSize -> 0.2]

Out[1]= [image]
```

Combine with a default vertex function:

```wl
In[2]:= WheelGraph[6, VertexShapeFunction -> { 1 -> "Square", "Triangle"}, VertexSize -> 0.2]

Out[2]= [image]
```

---

Draw vertices using a predefined graphic:

```wl
In[1]:= WheelGraph[6, VertexShapeFunction -> (Inset[[image], #]&)]

Out[1]= [image]
```

---

Draw vertices by running a program:

```wl
In[1]:=
vf[{xc_, yc_}, name_, {w_, h_}] := 
	Block[{xmin = xc - w, xmax = xc + w, ymin = yc - h, ymax = yc + h}, 
	Polygon[{{xmin, ymin}, {xmax, ymax}, {xmin, ymax}, {xmax, ymin}}]
	];

In[2]:= WheelGraph[6, VertexShapeFunction -> vf, VertexSize -> 0.2]

Out[2]= [image]
```

---

``VertexShapeFunction`` can be combined with ``VertexStyle``:

```wl
In[1]:= vf1[{xc_, yc_}, name_, {w_, h_}] := Rectangle[{xc - w, yc - h}, {xc + w, yc + h}]

In[2]:= WheelGraph[6, VertexSize -> 0.2, VertexStyle -> Blue, VertexShapeFunction -> vf1]

Out[2]= [image]
```

``VertexShapeFunction`` has higher priority than ``VertexStyle``:

```wl
In[3]:= vf2[{xc_, yc_}, name_, {w_, h_}] := {Red, Rectangle[{xc - w, yc - h}, {xc + w, yc + h}]}

In[4]:= WheelGraph[6, VertexSize -> 0.2, VertexStyle -> Blue, VertexShapeFunction -> vf2]

Out[4]= [image]
```

---

``VertexShapeFunction`` has higher priority than ``VertexSize``:

```wl
In[1]:= WheelGraph[6, VertexShapeFunction -> "Star", VertexSize -> {1 -> Small, Medium}]

Out[1]= [image]
```

---

``VertexShapeFunction`` has higher priority than ``VertexShape``:

```wl
In[1]:= WheelGraph[6, VertexSize -> 0.3, VertexShapeFunction -> "Star", VertexShape -> [image]]

Out[1]= [image]
```

#### VertexSize (8)

By default, the size of vertices is computed automatically:

```wl
In[1]:= WheelGraph[6, VertexSize -> Automatic]

Out[1]= [image]
```

---

Specify the size of all vertices using symbolic vertex size:

```wl
In[1]:= Table[WheelGraph[6, VertexSize -> s, PlotLabel -> s], {s, {Tiny, Small, Medium, Large}}]

Out[1]= {[image], [image], [image], [image]}
```

---

Use a fraction of the minimum distance between vertex coordinates:

```wl
In[1]:= Table[WheelGraph[6, VertexSize -> s, PlotLabel -> s], {s, 0.1, 1, 0.3}]

Out[1]= {[image], [image], [image], [image]}
```

---

Use a fraction of the overall diagonal for all vertex coordinates:

```wl
In[1]:= Table[WheelGraph[6, VertexSize -> {"Scaled", s}, PlotLabel -> {"Scaled", s}], {s, 0.1, 1, 0.3}]

Out[1]= {[image], [image], [image], [image]}
```

---

Specify size in both the $x$ and $y$ directions:

```wl
In[1]:= Table[WheelGraph[6, VertexSize -> s, PlotLabel -> s], {s, {{0.1, 0.2}, {0.2, 0.1}}}]

Out[1]= {[image], [image]}
```

---

Specify the size for individual vertices:

```wl
In[1]:= WheelGraph[6, VertexSize -> {1 -> 0.2, 2 -> 0.3}]

Out[1]= [image]
```

---

``VertexSize`` can be combined with ``VertexShapeFunction`` :

```wl
In[1]:= Table[WheelGraph[5, VertexSize -> s, VertexShapeFunction -> "Square", PlotLabel -> s], {s, {0.05, 0.1, 0.2}}]

Out[1]= {[image], [image], [image]}
```

---

``VertexSize`` can be combined with ``VertexShape`` :

```wl
In[1]:= Table[WheelGraph[5, VertexSize -> s, VertexShape -> [image], PlotLabel -> s], {s, {0.1, 0.2, 0.4}}]

Out[1]= {[image], [image], [image]}
```

#### VertexStyle (5)

Style all vertices:

```wl
In[1]:= Table[WheelGraph[6, VertexStyle -> style, VertexSize -> 0.3, PlotLabel -> style], {style, {Yellow, EdgeForm[Dashed]}}]

Out[1]= {[image], [image]}
```

---

Style individual vertices:

```wl
In[1]:= WheelGraph[6, VertexStyle -> {1 -> Blue, 2 -> Red}, VertexSize -> 0.2]

Out[1]= [image]
```

---

``VertexShapeFunction`` can be combined with ``VertexStyle``:

```wl
In[1]:= vf1[{xc_, yc_}, name_, {w_, h_}] := Rectangle[{xc - w, yc - h}, {xc + w, yc + h}]

In[2]:= WheelGraph[6, VertexSize -> 0.2, VertexStyle -> Blue, VertexShapeFunction -> vf1]

Out[2]= [image]
```

``VertexShapeFunction`` has higher priority than ``VertexStyle``:

```wl
In[3]:= vf2[{xc_, yc_}, name_, {w_, h_}] := {Red, Rectangle[{xc - w, yc - h}, {xc + w, yc + h}]}

In[4]:= WheelGraph[6, VertexSize -> 0.2, VertexStyle -> Blue, VertexShapeFunction -> vf2]

Out[4]= [image]
```

---

``VertexStyle`` can be combined with ``BaseStyle``:

```wl
In[1]:= WheelGraph[6, VertexStyle -> LightBlue, BaseStyle -> EdgeForm[Dotted], VertexSize -> 0.2]

Out[1]= [image]
```

``VertexStyle`` has higher priority than ``BaseStyle``:

```wl
In[2]:= WheelGraph[6, VertexStyle -> LightBlue, BaseStyle -> Gray, VertexSize -> 0.2]

Out[2]= [image]
```

---

``VertexShape`` is not affected by ``VertexStyle``:

```wl
In[1]:= WheelGraph[6, VertexSize -> 0.2, VertexShape -> [image], VertexStyle -> Blue]

Out[1]= [image]
```

#### VertexWeight (2)

Set the weight for all vertices:

```wl
In[1]:= WheelGraph[4, VertexWeight -> {2, 3, 4, 5}]

Out[1]= [image]

In[2]:= AnnotationValue[{%, 1}, VertexWeight]

Out[2]= 2
```

---

Use any numeric expression as a weight:

```wl
In[1]:= WheelGraph[4, VertexWeight -> {a, b, c, d}]

Out[1]= [image]

In[2]:= AnnotationValue[{%, 1}, VertexWeight]

Out[2]= a
```

### Applications (7)

The ``GraphCenter`` of wheel graphs:

```wl
In[1]:= Table[HighlightGraph[#, GraphCenter[#]]&[WheelGraph[i, VertexSize -> Small]], {i, 4, 7}]

Out[1]= {[image], [image], [image], [image]}
```

---

The ``GraphPeriphery`` :

```wl
In[1]:= Table[HighlightGraph[#, GraphPeriphery[#]]&[WheelGraph[i, VertexSize -> Small]], {i, 4, 7}]

Out[1]= {[image], [image], [image], [image]}
```

---

The ``VertexEccentricity`` :

```wl
In[1]:= VertexEccentricity[WheelGraph[6], #]& /@ VertexList[WheelGraph[6]]

Out[1]= {1, 2, 2, 2, 2, 2}
```

Highlight the vertex eccentricity path:

```wl
In[2]:=
FindVertexEccentricityPath[g_ ? UndirectedGraphQ, u_] /; MemberQ[VertexList[g], u] := Module[{d = GraphDistanceMatrix[g], posu, posv, vl = VertexList[g]}, posu = VertexIndex[g, u];
	posv = First@First@Position[d[[posu]], Max[d[[posu]]]];
	PathGraph[FindShortestPath[g, u, vl[[posv]]]]]

In[3]:= Table[HighlightGraph[g = WheelGraph[6], FindVertexEccentricityPath[g, u]], {u, Range[4]}]

Out[3]= {[image], [image], [image], [image]}
```

---

The ``GraphRadius`` :

```wl
In[1]:= Table[GraphRadius[WheelGraph[i]], {i, 4, 7}]

Out[1]= {1, 1, 1, 1}
```

Highlight the radius path:

```wl
In[2]:=
FindRadiusPath[g_ ? UndirectedGraphQ] := Module[{c = First@GraphCenter[g], d, v, pos}, d = Table[GraphDistance[g, c, u], {u, VertexList[g]}];
	pos = First@Position[d, Max[d]];
	v = First@Part[VertexList[g], pos];
	PathGraph[FindShortestPath[g, c, v]]]

In[3]:= Table[HighlightGraph[#, FindRadiusPath[#]]&[WheelGraph[i, VertexSize -> Tiny]], {i, 4, 7}]

Out[3]= {[image], [image], [image], [image]}
```

---

The ``GraphDiameter`` :

```wl
In[1]:= Table[GraphDiameter[CycleGraph[i]], {i, 4, 7}]

Out[1]= {2, 2, 3, 3}
```

Highlight the diameter path:

```wl
In[2]:=
FindDiameterPath[g_ ? UndirectedGraphQ] := Module[{d = GraphDistanceMatrix[g], u, v, pos}, pos = First@Position[d, Max[d]];
	{u, v} = Part[VertexList[g], pos];
	PathGraph[FindShortestPath[g, u, v]]]

In[3]:= Table[HighlightGraph[#, FindDiameterPath[#]]&[WheelGraph[i, VertexSize -> Tiny]], {i, 4, 7}]

Out[3]= {[image], [image], [image], [image]}
```

---

Highlight the vertex degree for ``WheelGraph`` :

```wl
In[1]:= HighlightCentrality[g_, cc_] := HighlightGraph[g, Table[Style[VertexList[g][[i]], ColorData["TemperatureMap"][cc[[i]] / Max[cc]]], {i, VertexCount[g]}]];

In[2]:= g = WheelGraph[8, VertexSize -> Large];

In[3]:= HighlightCentrality[g, VertexDegree[g]]

Out[3]= [image]
```

Highlight the closeness centrality:

```wl
In[4]:= HighlightCentrality[g, ClosenessCentrality[g]]

Out[4]= [image]
```

Highlight the eigenvector centrality:

```wl
In[5]:= HighlightCentrality[g, EigenvectorCentrality[g]]

Out[5]= [image]
```

---

Vertex connectivity from $s$ to $t$ is the number of vertex-independent paths from $s$ to $t$ :

```wl
In[1]:= g = WheelGraph[6, VertexLabels -> "Name"]

Out[1]= [image]
```

The vertex connectivity is 3 from the center to any outer vertex:

```wl
In[2]:=
{HighlightGraph[g, PathGraph[{6, 1}]], 
	HighlightGraph[g, PathGraph[{6, 5, 1}]], 
	HighlightGraph[g, PathGraph[{6, 2, 1}]]}

Out[2]= {[image], [image], [image]}
```

The vertex connectivity is also 3 from between any outer vertices:

```wl
In[3]:=
{HighlightGraph[g, PathGraph[{6, 2}]], 
	HighlightGraph[g, PathGraph[{6, 1, 2}]], 
	HighlightGraph[g, PathGraph[{6, 5, 4, 3, 2}]]}

Out[3]= {[image], [image], [image]}
```

### Properties & Relations (4)

``WheelGraph[n]`` has ``n`` vertices:

```wl
In[1]:= VertexCount[WheelGraph[n]]

Out[1]= n
```

---

``WheelGraph[n]`` has $2 n-2$ edges:

```wl
In[1]:= EdgeCount[WheelGraph[n]]

Out[1]= -2 + 2 n
```

---

The number of graph cycles in the wheel graph $W_n$ is $n^2-3n+3$ :

```wl
In[1]:= WheelGraph[4]

Out[1]= [image]
```

---

``WheelGraph[4]`` is a complete graph:

```wl
In[1]:= {WheelGraph[4], CompleteGraph[4]}

Out[1]= {[image], [image]}
```

### Neat Examples (1)

Random collage of wheel graphs:

```wl
In[1]:= Graphics[Table[Inset[WheelGraph[RandomInteger[{6, 10}]], RandomReal[{0, 10}, 2], Automatic, 1], {100}]]

Out[1]= [image]
```

## See Also

* [`Graph`](https://reference.wolfram.com/language/ref/Graph.en.md)
* [`GraphData`](https://reference.wolfram.com/language/ref/GraphData.en.md)
* [`CycleGraph`](https://reference.wolfram.com/language/ref/CycleGraph.en.md)
* [`StarGraph`](https://reference.wolfram.com/language/ref/StarGraph.en.md)

## Related Guides

* [Graph Construction & Representation](https://reference.wolfram.com/language/guide/GraphConstructionAndRepresentation.en.md)

## History

* [Introduced in 2010 (8.0)](https://reference.wolfram.com/language/guide/SummaryOfNewFeaturesIn80.en.md)