


AdjacencyGraph
AdjacencyGraph[amat]
gives the graph with adjacency matrix amat.
AdjacencyGraph[{v1,v2,…},amat]
gives the graph with vertices vi and adjacency matrix amat.
Details and Options
- AdjacencyGraph[amat] is equivalent to AdjacencyGraph[{1,2,…,n},amat], where amat has dimensions
 ×
× .
. - AdjacencyGraph takes the same options as Graph.
- The option DirectedEdges can be used to control whether an undirected or directed graph is constructed.
- The following settings for DirectedEdges can be used in AdjacencyGraph:
-
Automatic undirected graph if amat is symmetric True construct a directed graph False construct an undirected graph
List of all options
Background & Context
- AdjacencyGraph constructs a graph from an adjacency matrix representation of an undirected or directed graph. An adjacency matrix is a square matrix whose rows and columns correspond to the vertices of a graph and whose elements aij are non-negative integers that give the numbers of (directed) edges from vertex vi to vertex vj. Adjacency matrices with diagonal entries create self-loops.
- The option DirectedEdges (with possible values Automatic, True, or False) may be used to control whether an undirected or directed graph is constructed. By default, AdjacencyGraph returns an undirected graph if the input matrix is symmetric and a directed graph otherwise.
- AdjacencyGraph takes the same options as Graph (e.g. EdgeStyle, VertexStyle, EdgeLabels, VertexLabels, GraphLayout, VertexCoordinates, etc.). AdjacencyGraph does not take graph weights into account, so WeightedAdjacencyGraph must be used when constructing a graph from a weighted adjacency matrix.
- AdjacencyList returns a list of vertices adjacent to a given vertex vi and therefore corresponds to a list of the positions of nonzero elements in the i
") column (and, in the case of undirected graphs, the i
column (and, in the case of undirected graphs, the i") row) of the adjacency matrix. The entire adjacency matrix of any graph (including a graph constructed using AdjacencyGraph) may be returned using AdjacencyMatrix. IncidenceGraph uses an incidence matrix representation instead of an adjacency matrix to construct a graph.
row) of the adjacency matrix. The entire adjacency matrix of any graph (including a graph constructed using AdjacencyGraph) may be returned using AdjacencyMatrix. IncidenceGraph uses an incidence matrix representation instead of an adjacency matrix to construct a graph.
Examples
open all close allBasic Examples (2)
Scope (7)
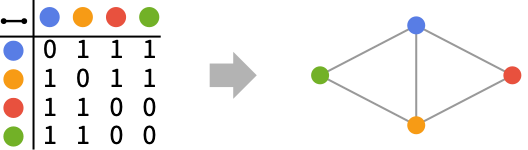
Symmetric matrices are interpreted as undirected graphs:
AdjacencyGraph[(|   |   |   |   |
| - | - | - | - |
| 0 | 1 | 1 | 0 |
| 1 | 0 | 1 | 1 |
| 1 | 1 | 0 | 1 |
| 0 | 1 | 1 | 0 |)]
Unsymmetric matrices are interpreted as directed graphs:
AdjacencyGraph[(|   |   |   |   |
| - | - | - | - |
| 0 | 1 | 0 | 0 |
| 1 | 0 | 0 | 0 |
| 1 | 1 | 0 | 0 |
| 1 | 1 | 0 | 0 |)]
Use DirectedEdges to construct a directed graph from a symmetric matrix:
AdjacencyGraph[(|   |   |   |   |
| - | - | - | - |
| 0 | 1 | 1 | 0 |
| 1 | 0 | 1 | 1 |
| 1 | 1 | 0 | 1 |
| 0 | 1 | 1 | 0 |), DirectedEdges -> True]
Matrices with diagonal entries create self-loops:
{AdjacencyGraph[(|   |   |   |   |
| - | - | - | - |
| 1 | 1 | 1 | 0 |
| 1 | 0 | 1 | 1 |
| 1 | 1 | 0 | 1 |
| 0 | 1 | 1 | 0 |)], AdjacencyGraph[(|   |   |   |   |
| - | - | - | - |
| 0 | 1 | 0 | 0 |
| 1 | 0 | 0 | 0 |
| 1 | 1 | 1 | 0 |
| 1 | 1 | 0 | 0 |)]}
Use a SparseArray object to specify the adjacency matrix:
AdjacencyGraph[SparseArray[{{i_, j_} /; 0 < Abs[i - j] ≤ 3 -> 1}, {6, 6}]]By default, the vertices are taken to be the integers 1 through ![]() :
:
VertexList@AdjacencyGraph[(|   |   |   |   |
| - | - | - | - |
| 1 | 1 | 1 | 0 |
| 1 | 0 | 1 | 1 |
| 1 | 1 | 0 | 1 |
| 0 | 1 | 1 | 0 |)]
Use an explicit vertex list to give vertex names:
VertexList@AdjacencyGraph[{a, b, c, d}, (|   |   |   |   |
| - | - | - | - |
| 1 | 1 | 1 | 0 |
| 1 | 0 | 1 | 1 |
| 1 | 1 | 0 | 1 |
| 0 | 1 | 1 | 0 |)]
AdjacencyGraph works with large matrices:
SparseArray[{Band[{2, 1}] -> 1, Band[{3, 1}] -> 1}, {10^6, 10^6}]Timing[AdjacencyGraph[%]//EdgeCount]Options (83)
AnnotationRules (3)
Specify an annotation for vertices:
AdjacencyGraph[(|   |   |   |
| - | - | - |
| 0 | 1 | 1 |
| 1 | 0 | 1 |
| 1 | 1 | 0 |), AnnotationRules -> {3 -> {VertexLabels -> "hello"}}]AdjacencyGraph[(| | | |
| - | - | - |
| 0 | 1 | 1 |
| 1 | 0 | 1 |
| 1 | 1 | 0 |), AnnotationRules -> {12 -> {EdgeLabels -> "hello"}}]AdjacencyGraph[(| | | |
| - | - | - |
| 0 | 1 | 1 |
| 1 | 0 | 1 |
| 1 | 1 | 0 |), AnnotationRules -> {"GraphProperties" -> {"Message" -> "hello"}}]AnnotationValue[%, "Message"]DirectedEdges (3)
By default, a symmetric matrix generates an undirected graph:
AdjacencyGraph[(|   |   |   |   |   |
| - | - | - | - | - |
| 0 | 1 | 1 | 1 | 1 |
| 1 | 0 | 1 | 1 | 1 |
| 1 | 1 | 0 | 1 | 1 |
| 1 | 1 | 1 | 0 | 1 |
| 1 | 1 | 1 | 1 | 0 |)]
Use DirectedEdges->True to generate a directed graph:
AdjacencyGraph[(|   |   |   |   |   |
| - | - | - | - | - |
| 0 | 1 | 1 | 1 | 1 |
| 1 | 0 | 1 | 1 | 1 |
| 1 | 1 | 0 | 1 | 1 |
| 1 | 1 | 1 | 0 | 1 |
| 1 | 1 | 1 | 1 | 0 |), DirectedEdges -> True, EdgeStyle -> Arrowheads[Medium]]
By default, a nonsymmetric matrix generates a directed graph:
AdjacencyGraph[(|   |   |   |   |   |
| - | - | - | - | - |
| 0 | 1 | 1 | 1 | 1 |
| 0 | 0 | 0 | 0 | 0 |
| 0 | 0 | 0 | 0 | 0 |
| 0 | 0 | 0 | 0 | 0 |
| 0 | 0 | 0 | 0 | 0 |)]
EdgeLabels (7)
AdjacencyGraph[(| | | |
| - | - | - |
| 0 | 1 | 1 |
| 1 | 0 | 1 |
| 1 | 1 | 0 |), EdgeLabels -> {12 -> "Hello"}]el = {12, 13, 23};AdjacencyGraph[(| | | |
| - | - | - |
| 0 | 1 | 1 |
| 1 | 0 | 1 |
| 1 | 1 | 0 |), EdgeLabels -> Table[el[[i]] -> Subscript["e", i], {i, Length[el]}]]Use any expression as a label:
AdjacencyGraph[(| | | |
| - | - | - |
| 0 | 1 | 1 |
| 1 | 0 | 1 |
| 1 | 1 | 0 |), EdgeLabels -> {12 -> [image], 23 -> [image], 13 -> [image]}]Use Placed with symbolic locations to control label placement along an edge:
Table[AdjacencyGraph[(| | | |
| - | - | - |
| 0 | 1 | 1 |
| 1 | 0 | 1 |
| 1 | 1 | 0 |), EdgeLabels -> {12 -> Placed["■■■", p]}, PlotLabel -> p], {p, {"Start", "Middle", "End"}}]Use explicit coordinates to place labels:
Table[AdjacencyGraph[(| | | |
| - | - | - |
| 0 | 1 | 1 |
| 1 | 0 | 1 |
| 1 | 1 | 0 |), EdgeLabels -> {12 -> Placed["■■■", p]}, PlotLabel -> p, BaselinePosition -> Bottom], {p, {0, 1 / 4, 1 / 3}}]Vary positions within the label:
Table[AdjacencyGraph[(| | | |
| - | - | - |
| 0 | 1 | 1 |
| 1 | 0 | 1 |
| 1 | 1 | 0 |), EdgeLabels -> {12 -> Placed["■■■", {1 / 2, p}]}, PlotLabel -> p, BaselinePosition -> Bottom], {p, {{0, 0}, {1 / 2, 1 / 2}, {1, 1}}}]AdjacencyGraph[(| | | |
| - | - | - |
| 0 | 1 | 1 |
| 1 | 0 | 1 |
| 1 | 1 | 0 |), EdgeLabels -> {31 -> Placed[{"lbl1", "lbl2"}, {"Start", "End"}]}]AdjacencyGraph[(| | | |
| - | - | - |
| 0 | 1 | 1 |
| 1 | 0 | 1 |
| 1 | 1 | 0 |), EdgeLabels -> {31 -> Placed[{"lbl1", "lbl2", "lbl3"}, {"Start", "Middle", "End"}]}]Use automatic labeling by values through Tooltip and StatusArea:
AdjacencyGraph[(|   |   |   |
| - | - | - |
| 0 | 1 | 1 |
| 1 | 0 | 1 |
| 1 | 1 | 0 |), EdgeLabels -> Placed["Name", Tooltip]]AdjacencyGraph[(| | | |
| - | - | - |
| 0 | 1 | 1 |
| 1 | 0 | 1 |
| 1 | 1 | 0 |), EdgeLabels -> Placed["Name", StatusArea]]EdgeShapeFunction (6)
Get a list of built-in settings for EdgeShapeFunction:
ResourceData["EdgeShapeFunction"]Undirected edges including the basic line:
AdjacencyGraph[(|   |   |   |
| - | - | - |
| 0 | 1 | 1 |
| 1 | 0 | 1 |
| 1 | 1 | 0 |), EdgeShapeFunction -> "Line"]
Lines with different glyphs on the edges:
Table[AdjacencyGraph[(|   |   |   |
| - | - | - |
| 0 | 1 | 1 |
| 1 | 0 | 1 |
| 1 | 1 | 0 |), EdgeShapeFunction -> {{ef, "ArrowSize" -> 0.1}}, PlotLabel -> ef], {ef, {"BoxLine", "DiamondLine", "DotLine"}}]
Directed edges including solid arrows:
Table[AdjacencyGraph[(|   |   |   |
| - | - | - |
| 0 | 1 | 0 |
| 0 | 0 | 1 |
| 1 | 0 | 0 |), EdgeShapeFunction -> {{ef, "ArrowSize" -> 0.1}}, PlotLabel -> ef], {ef, ResourceData["EdgeShapeFunction", "FilledArrow"]}]Table[AdjacencyGraph[(| | | |
| - | - | - |
| 0 | 1 | 0 |
| 0 | 0 | 1 |
| 1 | 0 | 0 |), EdgeShapeFunction -> {{ef, "ArrowSize" -> 0.1}}, PlotLabel -> ef], {ef, ResourceData["EdgeShapeFunction", "UnfilledArrow"]}]Table[AdjacencyGraph[(| | | |
| - | - | - |
| 0 | 1 | 0 |
| 0 | 0 | 1 |
| 1 | 0 | 0 |), EdgeShapeFunction -> {{ef, "ArrowSize" -> 0.1}}, PlotLabel -> ef], {ef, ResourceData["EdgeShapeFunction", "CarvedArrow"]}]Specify an edge function for an individual edge:
AdjacencyGraph[(| | | |
| - | - | - |
| 0 | 1 | 0 |
| 0 | 0 | 1 |
| 1 | 0 | 0 |), EdgeShapeFunction -> {12 -> "FilledArcArrow"}]Combine with a different default edge function:
AdjacencyGraph[(| | | |
| - | - | - |
| 0 | 1 | 0 |
| 0 | 0 | 1 |
| 1 | 0 | 0 |), EdgeShapeFunction -> {12 -> "FilledArcArrow", "CarvedArrow"}]Draw edges by running a program:
ef[pts_List, e_] :=
Block[{s = 0.015, g = [image]}, {Arrowheads[{{s, 0.33, g}, {s, 0.67, g}}], Arrow[pts]}]AdjacencyGraph[(| | | |
| - | - | - |
| 0 | 1 | 1 |
| 1 | 0 | 1 |
| 1 | 1 | 0 |), EdgeShapeFunction -> ef]EdgeShapeFunction can be combined with EdgeStyle:
AdjacencyGraph[(|   |   |   |
| - | - | - |
| 0 | 1 | 1 |
| 1 | 0 | 1 |
| 1 | 1 | 0 |), EdgeStyle -> Blue, EdgeShapeFunction -> (Line[#1]&)]
EdgeShapeFunction has higher priority than EdgeStyle:
AdjacencyGraph[(|   |   |   |
| - | - | - |
| 0 | 1 | 1 |
| 1 | 0 | 1 |
| 1 | 1 | 0 |), EdgeStyle -> Blue, EdgeShapeFunction -> ({Red, Line[#1]}&)]
EdgeStyle (2)
Table[AdjacencyGraph[(|   |   |   |
| - | - | - |
| 0 | 1 | 1 |
| 1 | 0 | 1 |
| 1 | 1 | 0 |), EdgeStyle -> style, PlotLabel -> style], {style, {Gray, Dashed, Thick}}]AdjacencyGraph[(| | | |
| - | - | - |
| 0 | 1 | 1 |
| 1 | 0 | 1 |
| 1 | 1 | 0 |), EdgeStyle -> {12 -> Blue, 13 -> Dashed}]EdgeWeight (2)
Specify a weight for all edges:
AdjacencyGraph[(|   |   |   |
| - | - | - |
| 0 | 1 | 1 |
| 1 | 0 | 1 |
| 1 | 1 | 0 |), EdgeWeight -> RandomInteger[5, 3]]WeightedAdjacencyMatrix[%]//MatrixFormUse any numeric expression as a weight:
AdjacencyGraph[(|   |   |   |
| - | - | - |
| 0 | 1 | 1 |
| 1 | 0 | 1 |
| 1 | 1 | 0 |), EdgeWeight -> {a, b, c}]WeightedAdjacencyMatrix[%]//MatrixFormGraphHighlight (3)
AdjacencyGraph[(|   |   |   |
| - | - | - |
| 0 | 1 | 1 |
| 1 | 0 | 1 |
| 1 | 1 | 0 |), VertexSize -> Tiny, GraphHighlight -> {1}]AdjacencyGraph[(| | | |
| - | - | - |
| 0 | 1 | 1 |
| 1 | 0 | 1 |
| 1 | 1 | 0 |), VertexSize -> Tiny, GraphHighlight -> {23}]AdjacencyGraph[(| | | |
| - | - | - |
| 0 | 1 | 1 |
| 1 | 0 | 1 |
| 1 | 1 | 0 |), VertexSize -> Tiny, GraphHighlight -> {1, 2, 23}]GraphHighlightStyle (2)
Get a list of built-in settings for GraphHighlightStyle:
ResourceData["GraphHighlightStyle"]Use built-in settings for GraphHighlightStyle:
AdjacencyGraph[(| | | |
| - | - | - |
| 0 | 1 | 1 |
| 1 | 0 | 1 |
| 1 | 1 | 0 |), GraphHighlight -> {1, 23}, VertexSize -> Small, GraphHighlightStyle -> #, PlotLabel -> #]& /@ Select[ResourceData["GraphHighlightStyle"], # =!= Automatic&]GraphLayout (5)
By default, the layout is chosen automatically:
AdjacencyGraph[(|   |   |   |
| - | - | - |
| 0 | 1 | 1 |
| 1 | 0 | 1 |
| 1 | 1 | 0 |), GraphLayout -> Automatic]
Specify layouts on special curves:
m = AdjacencyMatrix[GridGraph[{10, 10}]];Table[AdjacencyGraph[m, GraphLayout -> l, PlotLabel -> l], {l, {"CircularEmbedding", "SpiralEmbedding"}}]Specify layouts that satisfy optimality criteria:
m = AdjacencyMatrix[GridGraph[{10, 10}]];Table[AdjacencyGraph[m, GraphLayout -> l, PlotLabel -> l], {l, {"SpringEmbedding", "SpringElectricalEmbedding", "HighDimensionalEmbedding"}}]VertexCoordinates overrides GraphLayout coordinates:
{AdjacencyGraph[(|   |   |   |
| - | - | - |
| 0 | 1 | 1 |
| 1 | 0 | 1 |
| 1 | 1 | 0 |), GraphLayout -> "SpringElectricalEmbedding"],
	AdjacencyGraph[(|   |   |   |
| - | - | - |
| 0 | 1 | 1 |
| 1 | 0 | 1 |
| 1 | 1 | 0 |), GraphLayout -> "SpringElectricalEmbedding", VertexCoordinates -> Table[{i, i}, {i, 0, 2}]]}
Use AbsoluteOptions to extract VertexCoordinates computed using a layout algorithm:
AdjacencyGraph[(|   |   |   |
| - | - | - |
| 0 | 1 | 1 |
| 1 | 0 | 1 |
| 1 | 1 | 0 |)]AbsoluteOptions[%, VertexCoordinates]PlotTheme (4)
Base Themes (2)
AdjacencyGraph[(|   |   |   |
| - | - | - |
| 0 | 1 | 1 |
| 1 | 0 | 1 |
| 1 | 1 | 0 |), PlotTheme -> "Business"]AdjacencyGraph[(| | | |
| - | - | - |
| 0 | 1 | 1 |
| 1 | 0 | 1 |
| 1 | 1 | 0 |), PlotTheme -> "Monochrome"]Feature Themes (2)
AdjacencyGraph[(|   |   |   |
| - | - | - |
| 0 | 1 | 1 |
| 1 | 0 | 1 |
| 1 | 1 | 0 |), PlotTheme -> "LargeGraph"]AdjacencyGraph[(| | | |
| - | - | - |
| 0 | 1 | 1 |
| 1 | 0 | 1 |
| 1 | 1 | 0 |), PlotTheme -> "ClassicDiagram"]VertexCoordinates (3)
By default, any vertex coordinates are computed automatically:
AdjacencyGraph[(|   |   |   |
| - | - | - |
| 0 | 1 | 1 |
| 1 | 0 | 1 |
| 1 | 1 | 0 |)]
Extract the resulting vertex coordinates using AbsoluteOptions:
AbsoluteOptions[%, VertexCoordinates]Specify a layout function along an ellipse:
ellipseLayout[n_, {a_, b_}] := Table[{a Cos[2Pi / n u], b Sin[2Pi / n u]}, {u, 1, n}]Graphics[Point[ellipseLayout[20, {2, 1}]]]Use it to generate vertex coordinates for a graph:
m = AdjacencyMatrix[PathGraph[Range[20]]];AdjacencyGraph[m, VertexCoordinates -> ellipseLayout[20, {2, 1}]]VertexCoordinates has higher priority than GraphLayout:
AdjacencyGraph[(|   |   |   |
| - | - | - |
| 0 | 1 | 1 |
| 1 | 0 | 1 |
| 1 | 1 | 0 |), VertexCoordinates -> Table[{i, i}, {i, 3}], GraphLayout -> "CircularEmbedding"]
VertexLabels (13)
AdjacencyGraph[(|   |   |   |
| - | - | - |
| 0 | 1 | 1 |
| 1 | 0 | 1 |
| 1 | 1 | 0 |), VertexLabels -> "Name"]AdjacencyGraph[(| | | |
| - | - | - |
| 0 | 1 | 1 |
| 1 | 0 | 1 |
| 1 | 1 | 0 |), VertexLabels -> {1 -> "one"}]AdjacencyGraph[(| | | |
| - | - | - |
| 0 | 1 | 1 |
| 1 | 0 | 1 |
| 1 | 1 | 0 |), VertexLabels -> Table[i -> Subscript[v, i], {i, 3}]]Use any expression as a label:
AdjacencyGraph[(|   |   |   |
| - | - | - |
| 0 | 1 | 1 |
| 1 | 0 | 1 |
| 1 | 1 | 0 |), VertexLabels -> {1 -> [image], 2 -> [image], 3 -> [image]}, ImagePadding -> 30]
Use Placed with symbolic locations to control label placement, including outside positions:
Table[AdjacencyGraph[(|   |   |   |
| - | - | - |
| 0 | 1 | 1 |
| 1 | 0 | 1 |
| 1 | 1 | 0 |), VertexSize -> 0.1, VertexShapeFunction -> "Square", VertexLabels -> Table[i -> Placed["■■■", p], {i, 3}], PlotLabel -> p, ImagePadding -> 20], {p, {Before, After, Below, Above}}]
Symbolic outside corner positions:
pl = {{Before, Below}, {After, Below}, {Before, Above}, {After, Above}};Table[AdjacencyGraph[(| | | |
| - | - | - |
| 0 | 1 | 1 |
| 1 | 0 | 1 |
| 1 | 1 | 0 |), VertexSize -> 0.1, VertexShapeFunction -> "Square", ImagePadding -> 20, VertexLabels -> Table[i -> Placed["■■■", p], {i, 3}], PlotLabel -> p], {p, pl}]Table[AdjacencyGraph[(| | | |
| - | - | - |
| 0 | 1 | 1 |
| 1 | 0 | 1 |
| 1 | 1 | 0 |), VertexSize -> 0.25, VertexLabels -> Table[i -> Placed["■■■", p], {i, 3}], VertexShapeFunction -> "Square", PlotLabel -> p], {p, {Left, Top, Right, Bottom}}]Symbolic inside corner positions:
pl = {{Left, Bottom}, {Right, Bottom}, {Left, Top}, {Right, Top}};Table[AdjacencyGraph[(| | | |
| - | - | - |
| 0 | 1 | 1 |
| 1 | 0 | 1 |
| 1 | 1 | 0 |), VertexSize -> 0.25, VertexShapeFunction -> "Square", VertexLabels -> Table[i -> Placed["■■■", p], {i, 3}], PlotLabel -> p], {p, pl}]Use explicit coordinates to place the center of labels:
Table[AdjacencyGraph[(|   |   |   |
| - | - | - |
| 0 | 1 | 1 |
| 1 | 0 | 1 |
| 1 | 1 | 0 |), VertexSize -> 0.25, VertexShapeFunction -> "Square", VertexLabels -> Table[i -> Placed[[image], p], {i, 3}], PlotLabel -> p, BaselinePosition -> Bottom], {p, {{0, 0}, {1 / 2, 1 / 2}, {1, 1}}}]
Place all labels at the upper-right corner of the vertex and vary the coordinates within the label:
Table[AdjacencyGraph[(|   |   |   |
| - | - | - |
| 0 | 1 | 1 |
| 1 | 0 | 1 |
| 1 | 1 | 0 |), VertexSize -> 0.35, VertexShapeFunction -> "Square", VertexLabels -> Table[i -> Placed[[image], {{1, 1}, p}], {i, 3}], PlotLabel -> p, BaselinePosition -> Bottom], {p, {{0, 0}, {1 / 2, 1 / 2}, {1, 1}}}]AdjacencyGraph[(| | | |
| - | - | - |
| 0 | 1 | 1 |
| 1 | 0 | 1 |
| 1 | 1 | 0 |), VertexLabels -> {3 -> Placed[{"lbl1", "lbl2"}, {Above, Below}]}]Any number of labels can be used:
AdjacencyGraph[(|   |   |   |
| - | - | - |
| 0 | 1 | 1 |
| 1 | 0 | 1 |
| 1 | 1 | 0 |), VertexLabels -> {3 -> Placed[{"lbl1", "lbl2", "lbl3", "lbl4"}, {Above, After, Below, Before}]}]
Use the argument Placed to control formatting including Tooltip:
AdjacencyGraph[(|   |   |   |
| - | - | - |
| 0 | 1 | 1 |
| 1 | 0 | 1 |
| 1 | 1 | 0 |), VertexLabels -> Placed["Name", Tooltip]]
Or StatusArea:
AdjacencyGraph[(|   |   |   |
| - | - | - |
| 0 | 1 | 1 |
| 1 | 0 | 1 |
| 1 | 1 | 0 |), VertexLabels -> Placed["Name", StatusArea]]
Use more elaborate formatting functions:
rotateLabel[lab_] := Rotate[lab, 45Degree]AdjacencyGraph[(| | | |
| - | - | - |
| 0 | 1 | 1 |
| 1 | 0 | 1 |
| 1 | 1 | 0 |), VertexLabels -> Table[i -> Placed["xxx", Below, rotateLabel], {i, 3}]]panelLabel[lab_] := Panel[lab, FrameMargins -> 0, Background -> Lighter[Blue, 0.7]]AdjacencyGraph[(| | | |
| - | - | - |
| 0 | 1 | 1 |
| 1 | 0 | 1 |
| 1 | 1 | 0 |), VertexLabels -> Table[i -> Placed["xxx", Center, panelLabel], {i, 3}]]hyperlinkLabel[lab_] := Hyperlink[lab, "http://www.wolfram.com"]AdjacencyGraph[(| | | |
| - | - | - |
| 0 | 1 | 1 |
| 1 | 0 | 1 |
| 1 | 1 | 0 |), VertexLabels -> Table[i -> Placed["xxx", Center, hyperlinkLabel], {i, 3}]]VertexShape (5)
Use any Graphics, Image, or Graphics3D as a vertex shape:
Table[AdjacencyGraph[(|   |   |   |
| - | - | - |
| 0 | 1 | 1 |
| 1 | 0 | 1 |
| 1 | 1 | 0 |), VertexShape -> s, VertexSize -> Medium], {s, {[image], [image], [image]}}]
Specify vertex shapes for individual vertices:
AdjacencyGraph[(|   |   |   |
| - | - | - |
| 0 | 1 | 1 |
| 1 | 0 | 1 |
| 1 | 1 | 0 |), VertexShape -> {2 -> [image]}, VertexSize -> Small]
VertexShape can be combined with VertexSize:
Table[AdjacencyGraph[(|   |   |   |
| - | - | - |
| 0 | 1 | 1 |
| 1 | 0 | 1 |
| 1 | 1 | 0 |), VertexSize -> s, VertexShape -> [image], PlotLabel -> s], {s, {Small, Large}}]
VertexShape is not affected by VertexStyle:
AdjacencyGraph[(|   |   |   |
| - | - | - |
| 0 | 1 | 1 |
| 1 | 0 | 1 |
| 1 | 1 | 0 |), VertexSize -> 0.2, VertexShape -> [image], VertexStyle -> Blue]
VertexShapeFunction has higher priority than VertexShape:
AdjacencyGraph[(|   |   |   |
| - | - | - |
| 0 | 1 | 1 |
| 1 | 0 | 1 |
| 1 | 1 | 0 |), VertexSize -> 0.2, VertexShapeFunction -> "Square", VertexShape -> [image]]
VertexShapeFunction (10)
Get a list of built-in collections for VertexShapeFunction:
ResourceData["VertexShapeFunction"]Use built-in settings for VertexShapeFunction in the "Basic" collection:
ResourceData["VertexShapeFunction", "Basic"]Table[AdjacencyGraph[(| | | |
| - | - | - |
| 0 | 1 | 1 |
| 1 | 0 | 1 |
| 1 | 1 | 0 |), VertexShapeFunction -> vf, VertexSize -> 0.2, PlotLabel -> vf], {vf, {"Triangle", "Square", "Rectangle", "Pentagon", "Hexagon", "Octagon"}}]Table[AdjacencyGraph[(| | | |
| - | - | - |
| 0 | 1 | 1 |
| 1 | 0 | 1 |
| 1 | 1 | 0 |), VertexShapeFunction -> vf, VertexSize -> 0.2, PlotLabel -> vf], {vf, {"DownTrapezoid", "UpTrapezoid", "Parallelogram", "FiveDown", "Circle", "Diamond", "Star", "Capsule"}}]Use built-in settings for VertexShapeFunction in the "Rounded" collection:
ResourceData["VertexShapeFunction", "Rounded"]Table[AdjacencyGraph[(| | | |
| - | - | - |
| 0 | 1 | 1 |
| 1 | 0 | 1 |
| 1 | 1 | 0 |), VertexShapeFunction -> vf, VertexSize -> 0.2, PlotLabel -> vf], {vf, ResourceData["VertexShapeFunction", "Rounded"]}]Use built-in settings for VertexShapeFunction in the "Concave" collection:
ResourceData["VertexShapeFunction", "Concave"]Table[AdjacencyGraph[(| | | |
| - | - | - |
| 0 | 1 | 1 |
| 1 | 0 | 1 |
| 1 | 1 | 0 |), VertexShapeFunction -> vf, VertexSize -> 0.2, PlotLabel -> vf], {vf, ResourceData["VertexShapeFunction", "Concave"]}]AdjacencyGraph[(| | | |
| - | - | - |
| 0 | 1 | 1 |
| 1 | 0 | 1 |
| 1 | 1 | 0 |), VertexShapeFunction -> { 1 -> "Square"}, VertexSize -> 0.2]Combine with a default vertex function:
AdjacencyGraph[(|   |   |   |
| - | - | - |
| 0 | 1 | 1 |
| 1 | 0 | 1 |
| 1 | 1 | 0 |), VertexShapeFunction -> { 1 -> "Square", "Triangle"}, VertexSize -> 0.2]
Draw vertices using a predefined graphic:
AdjacencyGraph[(|   |   |   |
| - | - | - |
| 0 | 1 | 1 |
| 1 | 0 | 1 |
| 1 | 1 | 0 |), VertexShapeFunction -> (Inset[[image], #]&)]
Draw vertices by running a program:
vf[{xc_, yc_}, name_, {w_, h_}] :=
	Block[{xmin = xc - w, xmax = xc + w, ymin = yc - h, ymax = yc + h},
	Polygon[{{xmin, ymin}, {xmax, ymax}, {xmin, ymax}, {xmax, ymin}}]
];AdjacencyGraph[(| | | |
| - | - | - |
| 0 | 1 | 1 |
| 1 | 0 | 1 |
| 1 | 1 | 0 |), VertexShapeFunction -> vf, VertexSize -> 0.2]VertexShapeFunction can be combined with VertexStyle:
vf1[{xc_, yc_}, name_, {w_, h_}] := Rectangle[{xc - w, yc - h}, {xc + w, yc + h}]AdjacencyGraph[(| | | |
| - | - | - |
| 0 | 1 | 1 |
| 1 | 0 | 1 |
| 1 | 1 | 0 |), VertexSize -> 0.2, VertexStyle -> Blue, VertexShapeFunction -> vf1]VertexShapeFunction has higher priority than VertexStyle:
vf2[{xc_, yc_}, name_, {w_, h_}] := {Red, Rectangle[{xc - w, yc - h}, {xc + w, yc + h}]}AdjacencyGraph[(| | | |
| - | - | - |
| 0 | 1 | 1 |
| 1 | 0 | 1 |
| 1 | 1 | 0 |), VertexSize -> 0.2, VertexStyle -> Blue, VertexShapeFunction -> vf2]VertexShapeFunction can be combined with VertexSize:
AdjacencyGraph[(|   |   |   |
| - | - | - |
| 0 | 1 | 1 |
| 1 | 0 | 1 |
| 1 | 1 | 0 |), VertexShapeFunction -> "Star", VertexSize -> {1 -> Small, Medium}]
VertexShapeFunction has higher priority than VertexShape:
AdjacencyGraph[(|   |   |   |
| - | - | - |
| 0 | 1 | 1 |
| 1 | 0 | 1 |
| 1 | 1 | 0 |), VertexSize -> 0.3, VertexShapeFunction -> "Star", VertexShape -> [image]]
VertexSize (8)
By default, the size of vertices is computed automatically:
AdjacencyGraph[(|   |   |   |
| - | - | - |
| 0 | 1 | 1 |
| 1 | 0 | 1 |
| 1 | 1 | 0 |), VertexSize -> Automatic]
Specify the size of all vertices using symbolic vertex size:
Table[AdjacencyGraph[(|   |   |   |
| - | - | - |
| 0 | 1 | 1 |
| 1 | 0 | 1 |
| 1 | 1 | 0 |), VertexSize -> s, PlotLabel -> s], {s, {Tiny, Small, Medium, Large}}]
Use a fraction of the minimum distance between vertex coordinates:
Table[AdjacencyGraph[(|   |   |   |
| - | - | - |
| 0 | 1 | 1 |
| 1 | 0 | 1 |
| 1 | 1 | 0 |), VertexSize -> s, PlotLabel -> s], {s, 0.1, 1, 0.3}]
Use a fraction of the overall diagonal for all vertex coordinates:
Table[AdjacencyGraph[(|   |   |   |
| - | - | - |
| 0 | 1 | 1 |
| 1 | 0 | 1 |
| 1 | 1 | 0 |), VertexSize -> {"Scaled", s}, PlotLabel -> {"Scaled", s}], {s, 0.1, 1, 0.3}]
Specify size in both the ![]() and
and ![]() directions:
directions:
Table[AdjacencyGraph[(|   |   |   |
| - | - | - |
| 0 | 1 | 1 |
| 1 | 0 | 1 |
| 1 | 1 | 0 |), VertexSize -> s, PlotLabel -> s], {s, {{0.1, 0.2}, {0.2, 0.1}}}]
Specify the size for individual vertices:
AdjacencyGraph[(|   |   |   |
| - | - | - |
| 0 | 1 | 1 |
| 1 | 0 | 1 |
| 1 | 1 | 0 |), VertexSize -> {1 -> 0.2, 2 -> 0.3}]
VertexSize can be combined with VertexShapeFunction:
Table[AdjacencyGraph[(|   |   |   |
| - | - | - |
| 0 | 1 | 1 |
| 1 | 0 | 1 |
| 1 | 1 | 0 |), VertexSize -> s, VertexShapeFunction -> "Square", PlotLabel -> s], {s, {0.05, 0.1, 0.2}}]
VertexSize can be combined with VertexShape:
Table[AdjacencyGraph[(|   |   |   |
| - | - | - |
| 0 | 1 | 1 |
| 1 | 0 | 1 |
| 1 | 1 | 0 |), VertexSize -> s, VertexShape -> [image], PlotLabel -> s], {s, {0.1, 0.2, 0.4}}]
VertexStyle (5)
Table[AdjacencyGraph[(|   |   |   |
| - | - | - |
| 0 | 1 | 1 |
| 1 | 0 | 1 |
| 1 | 1 | 0 |), VertexStyle -> style, VertexSize -> 0.3, PlotLabel -> style], {style, {Yellow, EdgeForm[Dashed]}}]AdjacencyGraph[(| | | |
| - | - | - |
| 0 | 1 | 1 |
| 1 | 0 | 1 |
| 1 | 1 | 0 |), VertexStyle -> {1 -> Blue, 2 -> Red}, VertexSize -> 0.2]VertexShapeFunction can be combined with VertexStyle:
vf1[{xc_, yc_}, name_, {w_, h_}] := Rectangle[{xc - w, yc - h}, {xc + w, yc + h}]AdjacencyGraph[(| | | |
| - | - | - |
| 0 | 1 | 1 |
| 1 | 0 | 1 |
| 1 | 1 | 0 |), VertexSize -> 0.2, VertexStyle -> Blue, VertexShapeFunction -> vf1]VertexShapeFunction has higher priority than VertexStyle:
vf2[{xc_, yc_}, name_, {w_, h_}] := {Red, Rectangle[{xc - w, yc - h}, {xc + w, yc + h}]}AdjacencyGraph[(| | | |
| - | - | - |
| 0 | 1 | 1 |
| 1 | 0 | 1 |
| 1 | 1 | 0 |), VertexSize -> 0.2, VertexStyle -> Blue, VertexShapeFunction -> vf2]VertexStyle can be combined with BaseStyle:
AdjacencyGraph[(|   |   |   |
| - | - | - |
| 0 | 1 | 1 |
| 1 | 0 | 1 |
| 1 | 1 | 0 |), VertexStyle -> LightBlue, BaseStyle -> EdgeForm[Dotted], VertexSize -> 0.2]
VertexStyle has higher priority than BaseStyle:
AdjacencyGraph[(|   |   |   |
| - | - | - |
| 0 | 1 | 1 |
| 1 | 0 | 1 |
| 1 | 1 | 0 |), VertexStyle -> LightBlue, BaseStyle -> Gray, VertexSize -> 0.2]
VertexShape is not affected by VertexStyle:
AdjacencyGraph[(|   |   |   |
| - | - | - |
| 0 | 1 | 1 |
| 1 | 0 | 1 |
| 1 | 1 | 0 |), VertexSize -> 0.2, VertexShape -> [image], VertexStyle -> Blue]
VertexWeight (2)
Set the weight for all vertices:
AdjacencyGraph[(|   |   |   |
| - | - | - |
| 0 | 1 | 1 |
| 1 | 0 | 1 |
| 1 | 1 | 0 |), VertexWeight -> {2, 3, 4}]AnnotationValue[{%, 1}, VertexWeight]Use any numeric expression as a weight:
AdjacencyGraph[(|   |   |   |
| - | - | - |
| 0 | 1 | 1 |
| 1 | 0 | 1 |
| 1 | 1 | 0 |), VertexWeight -> {a, b, c}]AnnotationValue[{%, 1}, VertexWeight]Applications (2)
Construct a graph from a list of sets s where vertex i represents s〚i〛 and has an edge ij if s〚i〛⊆s〚j〛:
s = Subsets[{1, 2, 3}]AdjacencyGraph[s, Table[Boole@SubsetQ[s[[i]], s[[j]]], {i, Length[s]}, {j, Length[s]}], VertexLabels -> "Name"]Construct a graph from a list of integers s where ij if s〚i〛 divides s〚j〛 (s〚i〛∣s〚j〛):
s = Divisors[24]AdjacencyGraph[s, Table[Boole@Divisible[s[[i]], s[[j]]], {i, Length[s]}, {j, Length[s]}], VertexLabels -> "Name"]Properties & Relations (6)
Use VertexCount and EdgeCount to count vertices and edges:
g = AdjacencyGraph[(|   |   |   |   |   |
| - | - | - | - | - |
| 0 | 1 | 1 | 1 | 1 |
| 1 | 0 | 1 | 1 | 1 |
| 1 | 1 | 0 | 1 | 1 |
| 1 | 1 | 1 | 0 | 1 |
| 1 | 1 | 1 | 1 | 0 |)]{VertexCount[g], EdgeCount[g]}Use VertexList and EdgeList to enumerate vertices and edges in standard order:
g = AdjacencyGraph[(|   |   |   |
| - | - | - |
| 0 | 1 | 0 |
| 0 | 0 | 1 |
| 1 | 0 | 0 |)]{VertexList[g], EdgeList[g]}Compute the AdjacencyMatrix from a graph:
g = AdjacencyGraph[(|   |   |   |
| - | - | - |
| 0 | 1 | 0 |
| 0 | 0 | 1 |
| 1 | 0 | 0 |)];AdjacencyMatrix[g]//MatrixFormA graph can be reconstructed from its adjacency matrix:
CompleteGraph[5]AdjacencyGraph [AdjacencyMatrix[%]]An adjacency matrix with all zero entries in the diagonal constructs a graph without self-loops:
AdjacencyGraph[(|   |   |   |
| - | - | - |
| 0 | 1 | 1 |
| 1 | 0 | 1 |
| 1 | 1 | 0 |)]LoopFreeGraphQ[%]Every 1 in the diagonal indicates self-loops:
AdjacencyGraph[(|   |   |   |
| - | - | - |
| 1 | 1 | 1 |
| 1 | 0 | 1 |
| 1 | 1 | 1 |)]
An adjacency matrix whose entries outside the diagonal are all 1s constructs a complete graph:
m = (|   |   |   |   |   |
| - | - | - | - | - |
| 0 | 1 | 1 | 1 | 1 |
| 1 | 0 | 1 | 1 | 1 |
| 1 | 1 | 0 | 1 | 1 |
| 1 | 1 | 1 | 0 | 1 |
| 1 | 1 | 1 | 1 | 0 |);MatrixPlot[m]AdjacencyGraph[m]CompleteGraphQ[%]Text
Wolfram Research (2010), AdjacencyGraph, Wolfram Language function, https://reference.wolfram.com/language/ref/AdjacencyGraph.html.
CMS
Wolfram Language. 2010. "AdjacencyGraph." Wolfram Language & System Documentation Center. Wolfram Research. https://reference.wolfram.com/language/ref/AdjacencyGraph.html.
APA
Wolfram Language. (2010). AdjacencyGraph. Wolfram Language & System Documentation Center. Retrieved from https://reference.wolfram.com/language/ref/AdjacencyGraph.html