Point


Point
更多信息和选项
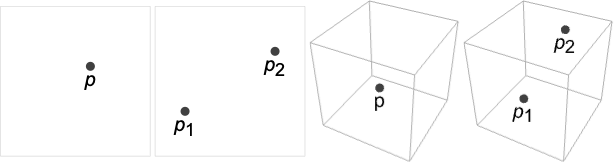
- Point 可被用作几何区域及图形基元.
- Point 可用在 Graphics 和 Graphics3D 中.
- 在图形中,点 pi 可以是 Scaled、Offset、ImageScaled 和 Dynamic 表达式.
- 有些指令,比如 PointSize 和着色会影响图形渲染.
- 下列选项和设置可被用在图形中:
-
VertexColors None 顶点颜色 VertexNormals None 用于设置颜色色调的有效顶点法线
背景
- Point 是表示几何点的图形及几何基元. Point 在
 维空间中的位置是由
 个笛卡尔坐标值组成的列表参数指定的,其中 RegionEmbeddingDimension 可被用于确定给定 Point 表达式的维度
 . 一组点可被表示为单个 Point 基元中的
 元组列表(“众点”). Point 对象的坐标可以是精确值或近似值.
- 可以分别用 Graphics 和 Graphics3D 在二维和三维空间中显示 Point 对象. Point 对象也可以通过 GeoGraphics 和 GeoPosition 用在地理地图中(例如 GeoGraphics[Point[GeoPosition[{38.9,-77.0}]]]). 最后,也可以用 Point 来定义需要进行计算的区域.
- 尽管点自身的维度是 0(见 RegionDimension 函数的返回结果),在格式化的图形表达式的默认输出中,Point 对象显示得要比 0 维的数学上的点要“大”些. 而且在图形可视化中,不管从哪个角度看,距离有多远,图形中点的大小不变. 如果想要改变 Point 对象的样式,可以使用调整大小的指令,如 PointSize 和 AbsolutePointSize;着色指令,比如 Red;规定透明度的指令 Opacity;以及样式选项 Antialiasing. 此外,可以用 VertexColors 指定众点的颜色,而众点在 Graphics3D 中的阴影和模拟光照则可使用 VertexNormals 指令来指定.
- 我们可以使用 GeometricTransformation 和更具体的转换函数,比如 Translate 和 Rotate,来改变图形输出中 Point 对象所在的坐标,但保持产生该输出的 Point 表达式不变.
- 其他图形基元,如 Circle、Disk、Sphere 及 Ball 和样式经过调整的 Point 对象类似. Locator 是另一个和点类似的交互式对象,它可用在图形中代表一个可拖拽的定位器对象.
- 尽管 Point 基元可以出现在图形和定义几何区域的表达式中,但要注意到,在 Wolfram 语言里,其他情况下坐标通常都以纯列表形式表示. 这种类型的例子包括出现在其他图形基元中的坐标设定(例如 Line[{{0, 0},{1,1}}]),Locator 的参数(例如 Graphics[Locator[{0,2}]]),以及当使用 Nearest 计算最接近的点时. 许多函数(包括 RegionNearest、RegionCentroid、ArgMin 和 ArgMax)也自然的返回坐标的纯列表形式而不是显式的 Point 对象,而其它函数(例如 Solve 和 NSolve)则以变量替换规则列表的形式返回解的“点”(例如
 ).
范例
打开所有单元 关闭所有单元基本范例 (5)
Graphics[Point[{0, 0}]]Graphics[Point[Table[{t, Sin[t]}, {t, 0, 2π, 2π / 10}]]]Graphics3D[Point[Table[{t, Sin[t], Cos[t]}, {t, 0, 2π, 2π / 10}]]]p = Table[{t, Sin[t]}, {t, 0, 2π, 2π / 10}];{Graphics[{PointSize[Small], Point[p]}],
Graphics[{PointSize[Small], Pink, Point[p]}],
Graphics[{PointSize[Large], Point[p]}],
Graphics[{PointSize[Large], Pink, Point[p]}]}ℛ = Point[{{1, 1, 1}, {3, 3, 3}}];RegionMeasure[ℛ]c = RegionCentroid[ℛ]范围 (20)
图形 (10)
规范 (2)
样式 (5)
p = Table[{2t, t}, {t, 10}];Table[Graphics[{PointSize[i], Point[p]}], {i, {Tiny, Small, Medium, Large}}]p = Table[{2t, t}, {t, 10}];Table[Graphics[{PointSize[i], Point[p]}], {i, {.005, .05, .1}}]Table[Graphics[{AbsolutePointSize[i], Point[p]}], {i, {1, 5, 10}}]p = Table[{2t, t}, {t, 10}];Table[Graphics[{c, Point[p]}], {c, {Red, Green, Blue, Cyan}}]用 VertexColors 来指定顶点的颜色:
Graphics[{PointSize[0.1], Point[{{0, 0}, {2, 1}}, VertexColors -> {Red, Green}]}]Graphics3D[{PointSize[0.1], Point[{-{1, 1, 1}, {1, 1, 1}}, VertexColors -> {Red, Green}]}, PlotRange -> 1.2]用 VertexNormals 来指定三维点顶点处的法线:
Graphics3D[{PointSize[0.1], Yellow, Point[{-{1, 1, 1}, {1, 1, 1}}, VertexNormals -> {{1, -1, 1}, {-1, 1, -1}}]}, PlotRange -> 1.2]坐标 (3)
使用 Scaled 坐标:
Graphics[{PointSize -> Large, Point[{Scaled[{0, .2}], Scaled[{1, .8}]}]}, Frame -> True]Graphics3D[{PointSize -> Large, Point[{Scaled[{0, .2, 0}], Scaled[{1, .8, 1}]}]}, Axes -> True]在二维图形中使用 ImageScaled 坐标:
Graphics[{PointSize -> Large, Point[{ImageScaled[{0, .2}], ImageScaled[{1, .8}]}]}, Frame -> True]在二维图形中使用 Offset 坐标:
Graphics[{PointSize -> Large, Point[Offset[{20, 20}, {0, 0}]]}, Frame -> True]区域 (10)
ℛ = Point[{{1, 2, 3}, {4, 5, 6}}];RegionEmbeddingDimension[ℛ]RegionDimension[ℛ]ℛ = Point[{{1, 2, 3}, {4, 5, 6}}];{RegionMember[ℛ, {1, 2, 3}], RegionMember[ℛ, {0, 0, 0}]}RegionMember[ℛ, {x, y, z}]ℛ = Point[Tuples[{0, 1, 2, 3}, 2]];RegionMeasure[ℛ]c = RegionCentroid[ℛ]Graphics[{ℛ, {Red, Point[c]}}]ℛ = Point[{{1, 2}, {3, 4}, {5, 6}}];RegionDistance[ℛ, {2, 1}]ℛ = Point[{{1, 2}, {3, 4}, {5, 6}}];SignedRegionDistance[ℛ, {2, 1}]ℛ = Point[{{1, 2}, {3, 4}, {5, 6}}];RegionNearest[ℛ, {1, 1}]pts = Table[{3, 4} + 4{Cos[k 2 π / 16], Sin[k 2π / 16]}, {k, 0., 15}];
nst = RegionNearest[ℛ, #]& /@ pts;Legended[Graphics[{ℛ, {Thin, Gray, Line[Transpose[{pts, nst}]]}, {Red, Point[pts]}, {Blue, Point[nst]}}], PointLegend[{Red, Blue}, {"start", "nearest"}]]ℛ = Point[{{1, 2}, {3, 4}, {5, 6}}];BoundedRegionQ[ℛ]r = RegionBounds[ℛ]Graphics[{StandardBlue, ℛ, {EdgeForm[{Dashed, Red}], Opacity[0.1, Yellow], Cuboid@@Transpose[r]}}]用计数度量在由三个点组成的集合上 Integrate:
ℛ = Point[{{1, 2}, {3, 4}, {5, 6}}];Integrate[x y, {x, y}∈ℛ]Integrate[x y Sum[DiracDelta@@({x, y} - pt), {pt, {{1, 2}, {3, 4}, {5, 6}}}], {x, -∞, ∞}, {y, -∞, ∞}]ℛ = Point[{{1, 2}, {3, 4}, {5, 6}}];Minimize[{x y - x, {x, y}∈ℛ}, {x, y}]ℛ = Point[Flatten[Table[{x, y, z}, {x, 10}, {y, 10}, {z, 10}], 2]];Reduce[x^2 + y^2 == z^2 && {x, y, z}∈ℛ, {x, y, z}]选项 (3)
VertexColors (2)
应用 (5)
用 Point 表示特殊的点,例如函数的零点:
Plot[Sin[x], {x, 0, 5Pi}, Epilog -> {PointSize[Medium], Point[Table[{k Pi, 0}, {k, 0, 5}]]}]简单的将点分类,用 Point 来可视化:
{red, green} = Last@Reap@Scan[If[#[[1]] ^ 2 + #[[2]] ^ 3 < 2 && #[[1]] + #[[2]] < 1, Sow[#, "Red"], Sow[#, "Green"]]&, RandomReal[{-2, 2}, {5000, 2}]];Graphics[{{Red, Point[red]}, {Green, Point[green]}}]{red, green} = Last@Reap@Scan[If[#[[1]] ^ 2 + #[[2]] ^ 3 - #[[3]] ^ 2 > 0, Sow[#, "Red"], Sow[#, "Green"]]&, RandomReal[{-2, 2}, {10000, 3}]];Graphics3D[{{Red, Point[red]}, {Green, Point[green]}}]data = {{-1.1, 2.6}, {3.9, -0.8}, {4.2, -3.7}, {3.3, 3.5}, {3.9, 5.2}, {4.1, -4.8}, {3.8, 3.7}, {5.6, 0.1}, {3.1, -5.2}, {-0.9, 2.3}, {2.9, 4.1}, {-2.3, 3.9}, {-2.5, 3.}, {2.6, -5.5}, {5.2, 1.9}, {-0.7, 1.3}, {0.9, 2.8}, {-1.5, 3.3}, {3.8, 1.2}, {2.6, -5.1}, {-0.8, 3.2}, {4.7, 0.7}, {3., 3.}, {3.9, 3.6}, {4.5, 1.4}, {4.2, 1.3}, {-1.1, 2.6}, {4.8, 2.4}, {3.3, -3.5}, {3.2, -4.6}, {3.3, -4.9}, {3., 3.5}, {0.7, 2.1}, {3.2, -4.3}, {-2., 0.5}, {-1.2, 2.}, {-1.6, 1.8}, {-3.5, 3.7}, {4.8, 0.2}, {3.3, 2.4}, {-0.1, 2.1}, {-1.3, 2.5}, {4.4, 3.9}, {3.5, 0.2}, {0.1, 2.9}, {-1., 1.6}, {-1.4, 4.5}, {3.2, 2.5}, {-1.6, 2.4}, {2.6, -5.1}};{c1, c2, c3} = FindClusters[data];Graphics[{{Red, Point[c1]}, {Green, Point[c2]}, {Blue, Point[c3]}}, Axes -> True]可以用 Point 来取代 Polygon 来达到特殊的渲染效果:
PointRendering[g_] := g /. GraphicsComplex[pts_, prims_, rest___] :> GraphicsComplex[pts, Append[prims, {PointSize[0.02], Point[Range[Length[pts]], VertexColors -> Automatic, VertexNormals -> Automatic]}], rest]Plot3D[Sin[x y], {x, 0, 3}, {y, 0, 3}, Mesh -> False, PlotStyle -> FaceForm[None]]//PointRenderingPlot3D[Sin[x y ^ 2], {x, 0, 4}, {y, 0, 2}, ColorFunction -> "TemperatureMap", Mesh -> None, Lighting -> Automatic, PlotStyle -> FaceForm[None]]//PointRenderingobj = RevolutionPlot3D[{8 + Cos[t], 2Sin[t]}, {t, 0, 2Pi}, Mesh -> None, PlotStyle -> FaceForm[None], Axes -> False];Table[Show[obj, Lighting -> ({"Spot", ColorData["SouthwestColors"][RandomReal[]], Scaled[#], {Pi / 4, 100}}&) /@ RandomReal[{-4, 4}, {5, 3}]], {3}]//PointRendering属性和关系 (2)
用 ListPlot 显示一维序列:
ListPlot[Table[Prime[k], {k, 50}], Filling -> Axis]用 ListPointPlot3D 显示二维序列:
ListPointPlot3D[Table[Sinc[m]Sinc[n], {m, -4, 4, .4}, {n, -4, 4, .4}], Filling -> Bottom]可能存在的问题 (1)
PointSize 按图形的宽度缩放大小:
Graphics[{PointSize[0.5], Point[{0, 0}]}, Frame -> True, AspectRatio -> 0.2]Graphics[{PointSize[0.5], Point[{0, 0}]}, Frame -> True, AspectRatio -> 3]用 AbsolutePointSize 控制大小:
Graphics[{AbsolutePointSize[15], Point[{0, 0}]}, Frame -> True, AspectRatio -> 0.2]巧妙范例 (3)
Graphics[Table[{Hue[RandomReal[]], PointSize[RandomReal[{0, 0.1}]], Point[RandomReal[1, {2}]]}, {200}]]Block[{sp = Normalize /@ RandomReal[{-1, 1}, {10 ^ 4, 3}]},
Graphics3D[{Point[sp, VertexNormals -> sp]}]]With[{g = Tuples[Range[-1.5, 1.5, .1], 2]},
Animate[Module[{pt = {Cos[q], Sin[q]}}, Graphics[{PointSize[Small], Point[Map[(# + 3 (# - pt) 2 ^ (-5 Norm[# - pt]))&, g]]}, PlotRange -> 1.7]], {q, 0, 2Pi}, AnimationRunning -> False]
]相关链接

 《Wolfram 语言入门》:坐标与图形
Wolfram Research (1988),Point,Wolfram 语言函数,https://reference.wolfram.com/language/ref/Point.html (更新于 2014 年).
文本
Wolfram Research (1988),Point,Wolfram 语言函数,https://reference.wolfram.com/language/ref/Point.html (更新于 2014 年).
CMS
Wolfram 语言. 1988. "Point." Wolfram 语言与系统参考资料中心. Wolfram Research. 最新版本 2014. https://reference.wolfram.com/language/ref/Point.html.
APA
Wolfram 语言. (1988). Point. Wolfram 语言与系统参考资料中心. 追溯自 https://reference.wolfram.com/language/ref/Point.html 年