



SphericalPlot3D
SphericalPlot3D[r,θ,ϕ]
生成球体半径为 r 的三维图形,是球面坐标 θ 和 ϕ 的函数.
SphericalPlot3D[r,{θ,θmin,θmax},{ϕ,ϕmin,ϕmax}]
在指定的球坐标范围内生成 3D 球面图.
SphericalPlot3D[{r1,r2,…},{θ,θmin,θmax},{ϕ,ϕmin,ϕmax}]
生成有多个曲面的 3D 球面图.
更多信息和选项
- 角度
 和
 的单位为弧度.
 对应于“纬度”;在“北极”时
 为 0,在“南极”时为
 .
 对应于“经度”,从北极看,逆时针方向从 0 变到
 .
- SphericalPlot3D[r,θ,ϕ] 中,
 的范围从 0 到
 ,
 的范围从 0 到
 .
- 对应于
 、
 、
 的
 、
 、
 位置分别是
 、
 、
 . 变量
 和
 可以是任意值. 它们定义的曲面可以径向重叠.
- 在
 等计算结果为 None 或除实数以外的任何值的位置会留下孔.
- SphericalPlot3D 把变量
 和
 视为局部变量,相当于使用 Block.
- SphericalPlot3D 具有属性 HoldAll,只在将具体的数值赋给变量后才计算
 .
- 在某些情况下,在将具体数值赋给变量之前,用 Evaluate 以符号方式计算
 可能更高效.
- SphericalPlot3D 有和 Graphics3D 相同的选项,不同之处及更多选项如下所示: [所有选项的列表]
-
Axes True 是否绘制坐标轴 BoundaryStyle Automatic 怎样绘制曲面的边界线 ColorFunction Automatic 怎样确定曲线和曲面的颜色 ColorFunctionScaling True 是否缩放 ColorFunction 的参数 EvaluationMonitor None 每次运行函数时要计算的表达式 Exclusions Automatic 要排除的  、
 曲线
ExclusionsStyle None 在排除的点或曲线处绘制什么内容 MaxRecursion Automatic 允许的递归子划分的最大数量 Mesh Automatic 在每个方向上绘制多少条网格线 MeshFunctions {#4&,#5&} 如何确定网格线的放置 MeshShading None 怎样处理网格之间区域的色调 MeshStyle Automatic 网格的样式 Method Automatic 细化曲面所用的方法 NormalsFunction Automatic 怎样确定有效的曲面法线 PerformanceGoal $PerformanceGoal 优化的目标 PlotLegends None 曲面的图例 PlotPoints Automatic 每个参数中初始采样点的数量 PlotStyle Automatic 每个对象的样式的图形指令 PlotTheme $PlotTheme 绘图的整体主题 RegionFunction (True&) 怎样确定是否包含某个点 ScalingFunctions None 怎样缩放个别坐标 TextureCoordinateFunction Automatic 如何确定纹理坐标 TextureCoordinateScaling True 是否缩放 TextureCoordinateFunction 的参数 WorkingPrecision MachinePrecision 内部计算使用的精度 - 可用 Tooltip、StatusArea 或 Annotation 指定对曲线或曲面进行交互式标注.
- SphericalPlot3D[Tooltip[{r1, r2,…}],…] 指定
 应显示为相应曲面的提示标签.
- Tooltip[r,label] 为曲面指定明确的提示标签.
- SphericalPlot3D 最初在 PlotPoints 指定的多个等距采样点处对每个函数进行计算. 然后使用自适应算法来选择额外的样本点,在每个参数中最多细分 MaxRecursion 次.
- 应该注意的是,使用有限数量的样本点,SphericalPlot3D 可能会遗漏函数中的特征. 如果想要检查所得结果是否正确,应尝试增大 PlotPoints 和 MaxRecursion 的设置.
- 如果无法绘制达到一定平滑程度的曲线,则 On[SphericalPlot3D::accbend] 可以使 SphericalPlot3D 显示一条提示信息.
- 提供给 MeshFunctions 和 RegionFunction 中的函数的参数是
 、
 、
 、
 、
 和
 . 默认情况下,提供给 ColorFunction 和 TextureCoordinateFunction 中的函数的是这些参数缩放过的版本.
- 在每个曲面的所有地方对函数进行计算.
- 默认情况下,曲面被视为均匀的白色漫反射器,对应于 ColorFunction(White&).
- SphericalPlot3D 返回 Graphics3D[GraphicsComplex[data]].
- 影响三维曲面的主题包括:
-
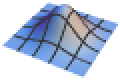
"DarkMesh" 暗色网格线 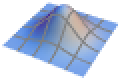
"GrayMesh" 灰色网格线 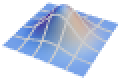
"LightMesh" 浅色网格线 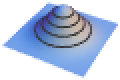
"ZMesh" 垂直分布的网格线 
"ThickSurface" 为曲面添加厚度 - ScalingFunctions 的可能设置包括:
-
{sx,sy,sz} 缩放 x、y 和 z 坐标轴 {sx,sy,sz,sθ,sϕ} 缩放 θ 和 ϕ 参数空间 - 常见的内置缩放函数 s 包括:
-
"Log" 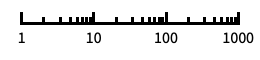
对数刻度,自动进行标记 "Log10" 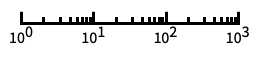
以 10 为底的对数刻度,用 10 的幂进行标记 "SignedLog" 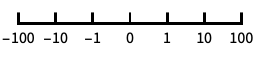
类似对数的刻度,包含 0 和负数 "Reverse" 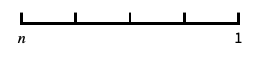
反转坐标的方向 "Infinite" 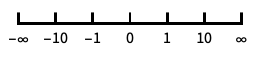
无穷刻度 - 缩放 θ 或 ϕ 参数空间将影响如何对绘图采样,但不影响整体的视觉外观.
所有选项的列表


范例
打开所有单元 关闭所有单元基本范例 (3)
SphericalPlot3D[1 + 2Cos[2θ], {θ, 0, Pi}, {ϕ, 0, 2Pi}]SphericalPlot3D[{1, 2, 3}, {θ, 0, Pi}, {ϕ, 0, 3Pi / 2}]SphericalPlot3D[1 + Sin[5ϕ] / 5, {θ, 0, Pi}, {ϕ, 0, 2Pi}, PlotStyle -> Directive[Orange, Opacity[0.7], Specularity[White, 10]], Mesh -> None, PlotPoints -> 30]范围 (18)
采样 (9)
SphericalPlot3D[1 + Sin[5θ], {θ, 0, Pi}, {ϕ, 0, 2Pi}, Mesh -> All]SphericalPlot3D[1 / θ, {θ, 0, Pi}, {ϕ, 0, 2Pi}]SphericalPlot3D[Sqrt[Sin[θ]], {θ, -Pi / 2, Pi / 2}, {ϕ, 0, 3Pi / 2}]SphericalPlot3D[Floor[ϕ], {θ, 0, Pi}, {ϕ, 0, 3Pi}, Mesh -> None, ExclusionsStyle -> {None, Red}]用 PlotPoints 和 MaxRecursion 控制自适应采样:
Grid[Table[SphericalPlot3D[1 + Sin[5θ], {θ, 0, Pi}, {ϕ, 0, 2Pi}, PlotPoints -> pp, MaxRecursion -> mr, PlotRange -> All, Mesh -> None], {mr, {0, 2}}, {pp, {5, 10}}]]用 PlotRange 选择要观察的区域:
{SphericalPlot3D[1 + Sin[5θ], {θ, 0, Pi}, {ϕ, 0, 2Pi}],
	SphericalPlot3D[1 + Sin[5θ], {θ, 0, Pi}, {ϕ, 0, 2Pi}, PlotRange -> 1]}
用 Exclusions 删除点或者分割所得曲面:
SphericalPlot3D[Round[θ], {θ, 0, Pi}, {ϕ, 0, 2Pi}, Exclusions -> {θ == 0.5, θ == 1.5, θ == 2.5}, Axes -> None, Mesh -> None]SphericalPlot3D[{Sin[θ], 2Sin[θ]}, {θ, 0, Pi}, {ϕ, 0, Pi}, PlotStyle -> {Blue, Red}]用 ScalingFunctions 反转 x 轴的方向:
SphericalPlot3D[Floor[ϕ], {θ, 0, Pi}, {ϕ, 0, 3Pi}, ScalingFunctions -> {"Reverse", None, None}]演示 (9)
SphericalPlot3D[{ϕ, -ϕ}, {θ, -Pi / 2, Pi / 2}, {ϕ, 0, 3Pi / 2}, PlotStyle -> {Directive[Red, Specularity[White, 20]], Directive[Cyan, Specularity[White, 20]]}]SphericalPlot3D[1, {θ, 0, Pi}, {ϕ, 0, 2Pi}, AxesLabel -> {x, y}, PlotLabel -> r == 1, AxesEdge -> {{-1, -1}, {1, -1}, {-1, -1}}]SphericalPlot3D[{ϕ, -ϕ}, {θ, -Pi / 2, Pi / 2}, {ϕ, 0, 3Pi / 2}, PlotLegends -> "Expressions"]为每个曲面提供交互式 Tooltip:
SphericalPlot3D[{Tooltip[ϕ, r == ϕ], Tooltip[-ϕ, r == -ϕ]}, {θ, -Pi / 2, Pi / 2}, {ϕ, 0, 3Pi / 2}, PlotStyle -> {Green, Yellow}]SphericalPlot3D[Sin[θ], {θ, 0, Pi}, {ϕ, 0, 2Pi}, Mesh -> 10, MeshStyle -> {Cyan, Directive[Green, Dashed]}, PlotStyle -> Gray]SphericalPlot3D[1 + Sin[5ϕ] / 5, {θ, 0, Pi}, {ϕ, 0, 2Pi}, Mesh -> 25, MeshShading -> {{Red, Yellow}, {Pink, Orange}}]SphericalPlot3D[1 + Sin[5ϕ] / 5, {θ, 0, Pi}, {ϕ, 0, 2Pi}, Mesh -> 25, ColorFunction -> Function[{x, y, z, t, θ, r}, Hue[θ ]]]SphericalPlot3D[1 + Sin[5ϕ] / 5, {θ, 0, Pi}, {ϕ, 0, 2Pi}, Mesh -> 25, ColorFunction -> (ColorData["Rainbow"][#6]&)]SphericalPlot3D[1, {θ, 0, Pi}, {ϕ, 0, 2Pi}, RegionFunction -> Function[{x, y, z, t, θ, r}, Sin[8t]Sin[8θ] > 0.1], Mesh -> None, PlotStyle -> FaceForm[Red, Cyan], PlotPoints -> 35, BoundaryStyle -> Green]SphericalPlot3D[1 + Sin[5ϕ] / 5, {θ, 0, Pi}, {ϕ, 0, 2Pi}, PlotTheme -> "Marketing"]选项 (92)
Axes (3)
默认情况下,会绘制 Axes:
SphericalPlot3D[1, {θ, 0, Pi}, {ϕ, 0, 2Pi}]SphericalPlot3D[1, {θ, 0, Pi}, {ϕ, 0, 2Pi}, Axes -> False]{SphericalPlot3D[1, {θ, 0, Pi}, {ϕ, 0, 2Pi}, Axes -> {False, False, True}], SphericalPlot3D[1, {θ, 0, Pi}, {ϕ, 0, 2Pi}, Axes -> {False, True, False}], SphericalPlot3D[1, {θ, 0, Pi}, {ϕ, 0, 2Pi}, Axes -> {True, False, False}]}AxesLabel (3)

AxesOrigin (2)
AxesStyle (4)
SphericalPlot3D[1, {θ, 0, Pi}, {ϕ, 0, 2Pi}, AxesStyle -> Red]SphericalPlot3D[1, {θ, 0, Pi}, {ϕ, 0, 2Pi}, AxesStyle -> {{Thick, Brown}, {Thick, Blue}, {Thick, Green}}]SphericalPlot3D[1, {θ, 0, Pi}, {ϕ, 0, 2Pi}, AxesStyle -> Green, TicksStyle -> StandardBlue]SphericalPlot3D[1, {θ, 0, Pi}, {ϕ, 0, 2Pi}, AxesStyle -> Green, LabelStyle -> StandardBlue]BoundaryStyle (4)
BoundaryStyle 自动匹配 MeshStyle:
SphericalPlot3D[1, {θ, 0, Pi}, {ϕ, 0, 2Pi}, MeshStyle -> Red]SphericalPlot3D[1, {θ, 0, Pi}, {ϕ, 0, 2Pi}, MeshStyle -> None]SphericalPlot3D[1, {θ, 0, Pi}, {ϕ, 0, 2Pi}, BoundaryStyle -> Directive[Thick, Red]]在曲面被 RegionFunction 剪切处绘制边界线:
SphericalPlot3D[1, {θ, 0, Pi}, {ϕ, 0, 2Pi}, BoundaryStyle -> Red, Mesh -> None, RegionFunction -> Function[{x, y, z, θ, ϕ}, Sin[5ϕ]Sin[5θ] > 0]]当曲面被 Exclusions 剪切时,不绘制边界线:
SphericalPlot3D[Floor[ϕ], {θ, 0, Pi}, {ϕ, 0, 2Pi}, BoundaryStyle -> Red, Exclusions -> Table[ϕ == k, {k, 0, 6}]]BoxRatios (2)
ColorFunction (5)


Table[SphericalPlot3D[1 + Sin[5ϕ] / 10, {θ, 0, Pi}, {ϕ, 0, 2Pi}, ColorFunction -> Function[{x, y, z, θ, ϕ, r}, Evaluate[f]], PlotLabel -> f, Axes -> None], {f, {Hue[x], Hue[y], Hue[z], Hue[θ], Hue[ϕ], Hue[r]}}]用 ColorData 预先定义颜色的梯度:
SphericalPlot3D[1 + Sin[5ϕ] / 10, {θ, 0, Pi}, {ϕ, 0, 2Pi}, ColorFunction -> Function[{x, y, z, θ, ϕ, r}, ColorData["Rainbow"][r]]]
SphericalPlot3D[1 + Sin[5ϕ] / 10, {θ, 0, Pi}, {ϕ, 0, 2Pi}, ColorFunction -> "Rainbow"]ColorFunction 较 PlotStyle 有更高优先级:
SphericalPlot3D[1 + Sin[5ϕ] / 10, {θ, 0, Pi}, {ϕ, 0, 2Pi}, ColorFunction -> "Rainbow", PlotStyle -> Directive[Opacity[0.5], Red]]ColorFunction 比 MeshShading 的优先级低:
SphericalPlot3D[1 + Sin[5ϕ] / 10, {θ, 0, Pi}, {ϕ, 0, 2Pi}, ColorFunction -> Function[{x, y, z, θ, ϕ, r}, Hue[z]], MeshShading -> {{Automatic, None}, {None, Automatic}}]ColorFunctionScaling (1)


EvaluationMonitor (2)
显示 RevolutionPlot3D 对一个函数的  坐标的采样:
ListPlot[Reap[SphericalPlot3D[1, {θ, 0, Pi}, {ϕ, 0, 2Pi}, EvaluationMonitor :> Sow[{θ, ϕ}]]][[-1, 1]]]Block[{k = 0}, SphericalPlot3D[1, {θ, 0, Pi}, {ϕ, 0, 2Pi}, EvaluationMonitor :> k++];k]Exclusions (5)
SphericalPlot3D[Im[θ Sqrt[Exp[I ϕ]]], {θ, 0, Pi}, {ϕ, 0, 2Pi}, PlotRange -> All]SphericalPlot3D[Im[θ Sqrt[Exp[I ϕ]]], {θ, 0, Pi}, {ϕ, 0, 2Pi}, Exclusions -> None, PlotRange -> All]SphericalPlot3D[Tan[ϕ], {θ, 0, Pi}, {ϕ, 0, 2Pi}, Exclusions -> {Cos[ϕ] == 0}, BoxRatios -> {1, 1, 1}]SphericalPlot3D[θ Sin[ϕ] / Abs[Sin[ϕ]], {θ, 0, Pi}, {ϕ, 0, 2Pi}, Exclusions -> {ϕ == 0, ϕ == Pi, ϕ == 2Pi}]SphericalPlot3D[Clip[Tan[θ]Tan[ϕ], {-5, 5}], {θ, 0, Pi}, {ϕ, 0, Pi}, Exclusions -> {Automatic, Cos[ϕ] == 0, Cos[θ] == 0}, PlotRange -> All]ExclusionsStyle (2)
ImageSize (7)
使用命名尺寸,例如 Tiny、 Small、Medium 和 Large:
{SphericalPlot3D[1, {θ, 0, Pi}, {ϕ, 0, 2Pi}, ImageSize -> Tiny], SphericalPlot3D[1, {θ, 0, Pi}, {ϕ, 0, 2Pi}, ImageSize -> Small]}{SphericalPlot3D[1, {θ, 0, Pi}, {ϕ, 0, 2Pi}, ImageSize -> 150], SphericalPlot3D[1, {θ, 0, Pi}, {ϕ, 0, 2Pi}, AspectRatio -> 1.5, ImageSize -> 150]}{SphericalPlot3D[1, {θ, 0, Pi}, {ϕ, 0, 2Pi}, ImageSize -> {Automatic, 150}], SphericalPlot3D[1, {θ, 0, Pi}, {ϕ, 0, 2Pi}, AspectRatio -> 2, ImageSize -> {Automatic, 150}]}{SphericalPlot3D[1, {θ, 0, Pi}, {ϕ, 0, 2Pi}, ImageSize -> UpTo[200]], SphericalPlot3D[1, {θ, 0, Pi}, {ϕ, 0, 2Pi}, AspectRatio -> 2, ImageSize -> UpTo[200]]}SphericalPlot3D[1, {θ, 0, Pi}, {ϕ, 0, 2Pi}, ImageSize -> {200, 300}, Background -> StandardGray]设置 AspectRatioFull 将填充可用空间:
SphericalPlot3D[1, {θ, 0, Pi}, {ϕ, 0, 2Pi}, AspectRatio -> Full, ImageSize -> {200, 300}, Background -> StandardGray]{SphericalPlot3D[1, {θ, 0, Pi}, {ϕ, 0, 2Pi}, ImageSize -> {UpTo[150], UpTo[100]}], SphericalPlot3D[1, {θ, 0, Pi}, {ϕ, 0, 2Pi}, AspectRatio -> 2, ImageSize -> {UpTo[150], UpTo[100]}]}使用 ImageSizeFull 来填充对象中的可用空间:
Framed[Pane[SphericalPlot3D[1, {θ, 0, Pi}, {ϕ, 0, 2Pi}, ImageSize -> Full, Background -> StandardGray], {200, 200}]]Framed[Pane[SphericalPlot3D[1, {θ, 0, Pi}, {ϕ, 0, 2Pi}, AspectRatio -> Full, ImageSize -> {Scaled[0.5], Scaled[0.5]}, Background -> StandardGray], {200, 200}]]MaxRecursion (1)
Mesh (5)
{SphericalPlot3D[1 + Sin[5ϕ] / 10, {θ, 0, Pi}, {ϕ, 0, 2Pi}, Mesh -> Full], SphericalPlot3D[1 + Sin[5ϕ] / 10, {θ, 0, Pi}, {ϕ, 0, 2Pi}, Mesh -> All]}SphericalPlot3D[1 + Sin[5ϕ] / 10, {θ, 0, Pi}, {ϕ, 0, 2Pi}, Mesh -> 10]SphericalPlot3D[1 + Sin[5ϕ] / 10, {θ, 0, Pi}, {ϕ, 0, 2Pi}, Mesh -> {5, 20}]对于  参数,在明确的一组数值处绘制网格,在
 方向不绘制网格:
SphericalPlot3D[1 + Sin[5ϕ] / 10, {θ, 0, Pi}, {ϕ, 0, 2Pi}, Mesh -> {Range[0, Pi, Pi / 12], 0}]
SphericalPlot3D[1 + Sin[5ϕ] / 10, {θ, 0, Pi}, {ϕ, 0, 2Pi}, MeshFunctions -> {#4&}, Mesh -> {{{Pi / 3, Thick}, {2Pi / 3, Directive[Thick, Red]}}}]MeshFunctions (2)


Table[SphericalPlot3D[1 + Sin[5ϕ] / 10, {θ, 0, Pi}, {ϕ, 0, 2Pi}, BoundaryStyle -> None, Mesh -> 5, MeshFunctions -> {Function[{x, y, z, θ, ϕ, r}, Evaluate[f]]}, PlotLabel -> f, Axes -> None], {f, {x, y, z, θ, ϕ, r}}]在  方向(红色)显示 5 级网格,在
 方向(蓝色)显示 10 级网格:
SphericalPlot3D[1 + Sin[5ϕ] / 10, {θ, 0, Pi}, {ϕ, 0, 2Pi}, Mesh -> {5, 10}, MeshFunctions -> {#4&, #5&}, MeshStyle -> {Red, Blue}]MeshShading (7)

SphericalPlot3D[1 + Sin[5ϕ] / 10, {θ, 0, Pi}, {ϕ, 0, 2Pi}, Mesh -> 15, MeshFunctions -> {#5&}, MeshShading -> {Red, Blue}]用 None 移除部分图形:
SphericalPlot3D[1 + Sin[5ϕ] / 10, {θ, 0, Pi}, {ϕ, 0, 2Pi}, Mesh -> 15, MeshFunctions -> {#5&}, MeshShading -> {Red, None}]MeshShading 在样式方面较 PlotStyle 有更高优先级:
SphericalPlot3D[1 + Sin[5ϕ] / 10, {θ, 0, Pi}, {ϕ, 0, 2Pi}, Mesh -> 15, MeshFunctions -> {#5&}, PlotStyle -> Green, MeshShading -> {Red, Blue}]通过设置 MeshShading 为 Automatic,对部分图形使用 PlotStyle:
SphericalPlot3D[1 + Sin[5ϕ] / 10, {θ, 0, Pi}, {ϕ, 0, 2Pi}, Mesh -> 15, MeshFunctions -> {#5&}, PlotStyle -> Directive[Opacity[0.5], Yellow], MeshShading -> {Red, Automatic}]MeshShading 可以同 ColorFunction 一起使用:
SphericalPlot3D[1 + Sin[5ϕ] / 10, {θ, 0, Pi}, {ϕ, 0, 2Pi}, Mesh -> 15, MeshFunctions -> {#5&}, ColorFunction -> Function[{x, y, z, θ, ϕ, r}, Hue[θ]], MeshShading -> {StandardGray, Automatic}]SphericalPlot3D[1 + Sin[5ϕ] / 10, {θ, 0, Pi}, {ϕ, 0, 2Pi}, ColorFunction -> Function[{x, y, z, θ, ϕ, r}, Hue[θ]], Mesh -> 15, MeshShading -> {{StandardGray, Automatic}, {None, Orange}}]用 FaceForm 为曲面的不同面设置不同的样式:
SphericalPlot3D[1 + Sin[5ϕ] / 10, {θ, 0, Pi}, {ϕ, 0, 2Pi}, MeshShading -> {{FaceForm[Red, None], FaceForm[None, Blue]}, {FaceForm[None, Cyan], FaceForm[Orange, None]}}]MeshStyle (2)

SphericalPlot3D[1 + Sin[5ϕ] / 10, {θ, 0, Pi}, {ϕ, 0, 2Pi}, MeshFunctions -> {#1&}, MeshStyle -> Red, BoundaryStyle -> None]

SphericalPlot3D[1 + Sin[5ϕ] / 10, {θ, 0, Pi}, {ϕ, 0, 2Pi}, MeshFunctions -> {#1&, #2&}, MeshStyle -> {Red, Blue}]NormalsFunction (3)
SphericalPlot3D[1 + Sin[5ϕ] / 10, {θ, 0, Pi}, {ϕ, 0, 2Pi}, Mesh -> None]用 None 为所有多边形设置相同的色调:
SphericalPlot3D[1 + Sin[5ϕ] / 10, {θ, 0, Pi}, {ϕ, 0, 2Pi}, NormalsFunction -> None, Mesh -> None]SphericalPlot3D[1 + Sin[5ϕ] / 10, {θ, 0, Pi}, {ϕ, 0, 2Pi}, Mesh -> None, NormalsFunction -> Function[{x, y, z, θ, ϕ, r}, RandomReal[{0, 2}, {3}]]]PerformanceGoal (2)
PlotLegends (2)
SphericalPlot3D[{Sin[θ], 2Sin[θ], 3Sin[θ]}, {θ, 0, Pi}, {ϕ, 0, 3Pi / 2}, PlotLegends -> Automatic]SphericalPlot3D[{Sin[θ], 2Sin[θ], 3Sin[θ]}, {θ, 0, Pi}, {ϕ, 0, 3Pi / 2}, PlotLegends -> {"one", "two", "three"}]SphericalPlot3D[{Sin[θ], 2Sin[θ], 3Sin[θ]}, {θ, 0, Pi}, {ϕ, 0, 3Pi / 2}, PlotLegends -> "Expressions"]使用 Placed 控制图例的位置:
SphericalPlot3D[{Sin[θ], 2Sin[θ], 3Sin[θ]}, {θ, 0, Pi}, {ϕ, 0, 3Pi / 2}, PlotLegends -> Placed[{"one", "two", "three"}, Below]]PlotPoints (1)
PlotStyle (3)
Table[SphericalPlot3D[1 + Sin[5ϕ] / 10, {θ, 0, Pi}, {ϕ, 0, 2Pi}, PlotStyle -> ps], {ps, {Red, Directive[Orange, Specularity[White, 50]], Opacity[0.3], Directive[Purple, Opacity[0.5]]}}]SphericalPlot3D[{1, 2 + Sin[5ϕ] / 10}, {θ, 0, Pi}, {ϕ, 0, 3Pi / 2}, PlotStyle -> {Yellow, Red}]SphericalPlot3D[1 + Sin[5ϕ] / 10, {θ, 0, Pi}, {ϕ, 0, 3Pi / 2}, PlotStyle -> FaceForm[Red, Blue]]PlotTheme (3)
SphericalPlot3D[1 + Sin[5 ϕ] Sin[10 θ] / 10, {θ, 0, π}, {ϕ, 0, 2π}, PlotTheme -> "Detailed"]SphericalPlot3D[1 + Sin[5 ϕ] Sin[10 θ] / 10, {θ, 0, π}, {ϕ, 0, 2π}, PlotTheme -> "Detailed", Mesh -> None]SphericalPlot3D[ϕ, {θ, 0, Pi}, {ϕ, 0, 3Pi}, PlotTheme -> "ThickSurface"]RegionFunction (2)


Table[SphericalPlot3D[1 + Sin[5ϕ] / 10, {θ, 0, Pi}, {ϕ, 0, 2Pi}, RegionFunction -> Function[{x, y, z, θ, ϕ, r}, Evaluate[f]], PlotLabel -> f, Mesh -> None, BoundaryStyle -> Green, PlotRange -> 1.1, Axes -> None], {f, {0 < x < 1, 0 < y < 1, 0 < z < 1, 0 < θ < 1, 0 < ϕ < Pi / 2, 1 / 2 < r < 1}}]SphericalPlot3D[1 + Sin[5ϕ] / 10, {θ, 0, Pi}, {ϕ, 0, 2Pi}, RegionFunction -> (Sin[5(#4 + #5)] > 0&), Mesh -> None, BoundaryStyle -> Green]ScalingFunctions (3)
SphericalPlot3D[θ ϕ, {θ, 0, Pi}, {ϕ, 0, 3Pi}]SphericalPlot3D[θ ϕ, {θ, 0, Pi}, {ϕ, 0, 3Pi}, ScalingFunctions -> {None, None, "SignedLog"}, BoxRatios -> {1, 1, 1}]使用 ScalingFunctions 在  方向上反转坐标方向:
SphericalPlot3D[θ ϕ, {θ, 0, Pi}, {ϕ, 0, 3Pi}, ScalingFunctions -> {None, None, "Reverse"}]TextureCoordinateFunction (4)


SphericalPlot3D[1 + Sin[5ϕ] / 10, {θ, 0, Pi}, {ϕ, 0, 2Pi}, Mesh -> None, PlotStyle -> Texture[ExampleData[{"ColorTexture", "MultiSpiralsPattern"}]]]

SphericalPlot3D[1 + Sin[5ϕ] / 10, {θ, 0, Pi}, {ϕ, 0, 2Pi}, Mesh -> None, TextureCoordinateFunction -> ({#1, #2}&), PlotStyle -> Texture[ExampleData[{"ColorTexture", "MultiSpiralsPattern"}]]]SphericalPlot3D[1 + Sin[5ϕ] / 10, {θ, 0, Pi}, {ϕ, 0, 2Pi}, Mesh -> None, TextureCoordinateScaling -> False, PlotStyle -> Texture[ExampleData[{"ColorTexture", "MultiSpiralsPattern"}]]]texture = ArrayPlot[{{1, 1, 1, 2, 1, 1}, {2, 0, 0, 2, 0, 0}, {2, 0, 0, 2, 0, 0}, {2, 1, 1, 1, 1, 1}, {2, 0, 0, 2, 0, 0}, {2, 0, 0, 2, 0, 0}}, ColorRules -> {1 -> Red, 2 -> Blue, 0 -> White}, Frame -> False, PlotRangePadding -> None, ImagePadding -> None, ImageSize -> 100]SphericalPlot3D[1 + Sin[5ϕ] / 10, {θ, 0, Pi}, {ϕ, 0, 2Pi}, Mesh -> None, TextureCoordinateScaling -> False, PlotStyle -> Texture[texture]]TextureCoordinateScaling (1)
texture = ArrayPlot[{{1, 1, 1, 2, 1, 1}, {2, 0, 0, 2, 0, 0}, {2, 0, 0, 2, 0, 0}, {2, 1, 1, 1, 1, 1}, {2, 0, 0, 2, 0, 0}, {2, 0, 0, 2, 0, 0}}, ColorRules -> {1 -> Red, 2 -> Blue, 0 -> White}, Frame -> False, PlotRangePadding -> None, ImagePadding -> None, ImageSize -> 100]Table[SphericalPlot3D[1 + Sin[5ϕ] / 10, {θ, 0, Pi}, {ϕ, 0, 2Pi}, Mesh -> None, TextureCoordinateScaling -> s, PlotStyle -> Texture[texture], PlotLabel -> s], {s, {True, False}}]Ticks (6)
SphericalPlot3D[{1, 2, 3}, {θ, 0, Pi}, {ϕ, 0, 3 Pi / 2}]SphericalPlot3D[{1, 2, 3}, {θ, 0, Pi}, {ϕ, 0, 3 Pi / 2}, Ticks -> None]SphericalPlot3D[{1, 2, 3}, {θ, 0, Pi}, {ϕ, 0, 3 Pi / 2}, Ticks -> {{-2.5, 0, 2.5}, {-2.5, 0, 2.5}, {-2.5, 0, 2.5}}]SphericalPlot3D[{1, 2, 3}, {θ, 0, Pi}, {ϕ, 0, 3 Pi / 2}, Ticks -> {{{-2.5, -a}, {0, 0}, {2.5, a}}, {{-2.5, -a}, {0, 0}, {2.5, a}}, {{-2.5, -a}, {0, 0}, {2.5, a}}}]SphericalPlot3D[{1, 2, 3}, {θ, 0, Pi}, {ϕ, 0, 3 Pi / 2}, Ticks -> {{{-2.5, -a, .18}, {0, 0, .2}, {2.5, a, .05}}, {{-2.5, -a, .05}, {0, 0, .05}, {2.5, a, .05}}, {{-2.5, -a, .1}, {0, 0, .15}, {2.5, a, .15}}}]SphericalPlot3D[{1, 2, 3}, {θ, 0, Pi}, {ϕ, 0, 3 Pi / 2}, Ticks -> {{{-2.5, -a, .18, Directive[Red, Dashed, Thick]}, {0, 0, .2, Directive[Red]}, {2.5, a, .05, Directive[Red, Thick]}}, {{-2.5, -a, .05, Directive[Blue, Thick]}, {0, 0, .05, Directive[Blue, Thick]}, {2.5, a, .05, Directive[Blue, Thick]}}, {{-2.5, -a, .1, Directive[Darker@Green, Thick]}, {0, 0, .15, Directive[Darker@Green, Dashed, Thick]}, {2.5, a, .15, Directive[Darker@Green, Dashed]}}}]TicksStyle (3)
SphericalPlot3D[{1, 2, 3}, {θ, 0, Pi}, {ϕ, 0, 3 Pi / 2}, AxesStyle -> Directive[Red, Thick]]SphericalPlot3D[{1, 2, 3}, {θ, 0, Pi}, {ϕ, 0, 3 Pi / 2}, TicksStyle -> Directive[Red, Thick]]SphericalPlot3D[{1, 2, 3}, {θ, 0, Pi}, {ϕ, 0, 3 Pi / 2}, TicksStyle -> {Directive[Blue, Thick], Directive[Red, Thick], Directive[Brown, Thick]}]应用 (5)
SphericalPlot3D[1, {θ, 0, Pi}, {ϕ, 0, 2Pi}]SphericalPlot3D[ϕ, {θ, 0, Pi}, {ϕ, 0, 3Pi}]SphericalPlot3D[1 + Sin[5ϕ]Sin[10θ] / 10, {θ, 0, Pi}, {ϕ, 0, 2Pi}]GraphicsGrid@Table[SphericalPlot3D[Evaluate@Abs@SphericalHarmonicY[l, m, θ, ϕ], {θ, 0, Pi}, {ϕ, 0, 2Pi}, PlotRange -> 0.6, Mesh -> None, Boxed -> False, Axes -> None], {l, 0, 3}, {m, 0, l}]SphericalPlot3D[Evaluate@Abs@SphericalHarmonicY[5, 2, θ, ϕ], {θ, 0, π}, {ϕ, 0, 2π}, Mesh -> None, ColorFunction -> Function[{x, y, z, θ, ϕ, r}, Evaluate[Hue@Rescale[Arg@SphericalHarmonicY[5, 2, θ, ϕ], {-π, π}]]], ColorFunctionScaling -> False, PlotPoints -> 35]属性和关系 (8)
SphericalPlot3D 是 ParametricPlot3D 的特例:
SphericalPlot3D[θ ^ 2, {θ, 0, Pi}, {ϕ, 0, 5Pi / 3}]ParametricPlot3D[{θ ^ 2 Sin[θ]Cos[ϕ], θ ^ 2 Sin[θ]Sin[ϕ], θ ^ 2 Cos[θ]}, {θ, 0, Pi}, {ϕ, 0, 5Pi / 3}]对旋转曲面和圆柱坐标使用 RevolutionPlot3D:
RevolutionPlot3D[t ^ 2, {t, 0, 2}]RevolutionPlot3D[Sin[t] Sin[5θ], {t, 0, Pi}, {θ, 0, 2Pi}]对三维空间的任意曲线和曲面使用 ParametricPlot3D:
ParametricPlot3D[Evaluate[{Cos[u], Sin[u], -u / 5} / Sqrt[1 + (u / 5) ^ 2]], {u, -20, 20}]ParametricPlot3D[{u - u ^ 3 / 3 + u v ^ 2, -v - u ^ 2v + v ^ 3 / 3, u ^ 2 - v ^ 2}, {u, -1.5, 1.5}, {v, -1.5, 1.5}]对极坐标中的曲线使用 PolarPlot:
PolarPlot[Sin[4t], {t, 0, 2Pi}]对二维空间内的曲线和区域使用 ParametricPlot:
{ParametricPlot[{u Cos[u], u Sin[u]}, {u, 0, 4Pi}],
	ParametricPlot[{(u + v) Cos[u], (u + v) Sin[u]}, {u, 0, 4Pi}, {v, 0, 3}]}
ContourPlot3D 和 RegionPlot3D 可用于隐式定义的曲面和区域:
ContourPlot3D[x ^ 2 + y ^ 2 == z ^ 2, {x, -2, 2}, {y, -2, 2}, {z, -2, 2}]RegionPlot3D[x ^ 2 + y ^ 2 < z ^ 2, {x, -2, 2}, {y, -2, 2}, {z, -2, 2}]用 ListPlot3D 和 ListSurfacePlot3D 绘制数据:
ListPlot3D[Table[Sin[x y], {x, 0, 3, 0.1}, {y, 0, 3, 0.1}]]ListSurfacePlot3D[Table[{x = RandomReal[{-1, 1}], y = RandomReal[{-1, 1}], RandomChoice[{-1, 1}]Sqrt[1 - x ^ 2 - y ^ 2]}, {1000}]]Sphere 用于生成球体:
Graphics3D[Table[{RGBColor[i, j, k], Sphere[{i, j, k}, 0.1]}, {i, 0, 1, 0.2}, {j, 0, 1, 0.2}, {k, 0, 1, 0.2}], Lighting -> "Neutral"]可能存在的问题 (1)
巧妙范例 (2)
SphericalPlot3D[1 + Sin[5 ϕ] Sin[10 θ] / 10, {θ, 0, π}, {ϕ, 0, 2π}, ColorFunction -> (ColorData["Rainbow"][#6]&), Mesh -> None, PlotPoints -> 25, Boxed -> False, Axes -> False]SphericalPlot3D[1 + FractionalPart[10ϕ / (2Pi)] / 5, {θ, 0, Pi}, {ϕ, 0, 2Pi}, Mesh -> None, ExclusionsStyle -> {None, Red}, PlotStyle -> Opacity[0.6]]SphericalPlot3D[1 + FractionalPart[10θ / Pi] / 5, {θ, 0, Pi}, {ϕ, 0, 2Pi}, Mesh -> None, ExclusionsStyle -> {None, Red}, PlotStyle -> Opacity[0.6]]文本
Wolfram Research (2007),SphericalPlot3D,Wolfram 语言函数,https://reference.wolfram.com/language/ref/SphericalPlot3D.html (更新于 2022 年).
CMS
Wolfram 语言. 2007. "SphericalPlot3D." Wolfram 语言与系统参考资料中心. Wolfram Research. 最新版本 2022. https://reference.wolfram.com/language/ref/SphericalPlot3D.html.
APA
Wolfram 语言. (2007). SphericalPlot3D. Wolfram 语言与系统参考资料中心. 追溯自 https://reference.wolfram.com/language/ref/SphericalPlot3D.html 年