


ListPointPlot3D
ListPointPlot3D[{{x1,y1,z1},{x2,y2,z2},…}]
绘制坐标为 {xi,yi,zi} 的点的三维散点图.
ListPointPlot3D[array]
绘制高度值为二维数组的点的三维散点图.
ListPointPlot3D[{data1,data2,…}]
绘制几组点,默认情况下使用不同颜色.
更多信息和选项
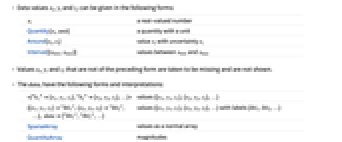
- 可以用下列形式给出 xi、yi 和 zi 的值:
-
xi 实数 Quantity[xi,unit] 带有单位的量 Around[xi,ei] 不确定性为 ei 的值 xi Interval[{xmin,xmax}] 位于 xmin 和 xmax 之间的值 - 不具有上述形式的数值 xi、yi 和 zi 将被视为缺失值,并且不显示.
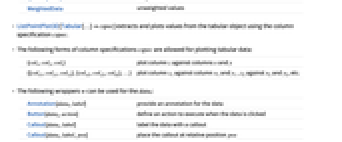
- datai 有如下形式和解释:
-
<"k1"{x1,y1,z1},"k2"{x2,y2,z2},…> 数值 {{x1,y1,z1},{x2,y2,z2},…} {{x1,y1,z1}"lbl1",{x2,y2,z2}"lbl2",…}, data{"lbl1","lbl2",…} 带有标签 {lbl1,lbl2,…} 的数值 {{x1,y1,z1},{x2,y2,z2},…} SparseArray 用一般数组的形式给出的值 QuantityArray 量值 WeightedData 未加权的值 - ListPointPlot3D[Tabular[…]cspec] 使用列规范 cspec 从表格对象中提取并绘制数值.
- 在绘制表格数据时,允许使用以下形式的列规范 cspec:
-
{colx,coly,colz} 绘制 z 列与列 x 和 y 的对比图 {{colx1,coly1,colz1},{colx2,coly2,colz2},…} 绘制列 z1 与列 x1和列 y1、列 z2 与列 x2 和列 y2、等的对比图 - 可将下列封装 w 用于 datai:
-
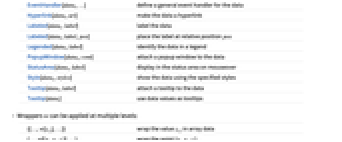
Annotation[datai,label] 为数据提供注释 Button[datai,action] 定义数据被点击时要执行的操作 Callout[datai,label] 用标注 (callout) 标记数据 Callout[datai,label,pos] 在相对位置 pos 上放置标注 (callout) EventHandler[datai,…] 定义数据的通用事件处理程序 Hyperlink[datai,uri] 把数据变为一个超链接 Labeled[datai,label] 标注数据 Labeled[datai,label,pos] 在相对位置 pos 上放置标签 Legended[datai,label] 在图例中标识数据 PopupWindow[datai,cont] 为数据添加弹出窗口 StatusArea[datai,label] 当鼠标移过时在状态栏中显示 Style[datai,styles] 用指定样式显示数据 Tooltip[datai,label] 为数据添加提示条 Tooltip[datai] 将数据值用作提示条 - 可在多个层级上应用封装 w:
-
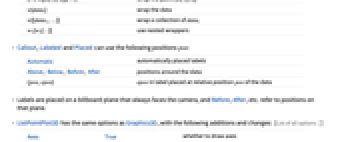
{{…,w[zi,j],…}} 封装数组数据中的值 zi,j {…,w[{xi,yi,zi}],…} 封装点 {xi,yi,zi} w[datai] 封装数据 w[{data1,…}] 封装一组 datai w1[w2[…]] 使用嵌套封装 - 在 Callout、Labeled 和 Placed 中可使用以下位置 pos:
-
Automatic 自动放置标签 Above, Below, Before, After 数据周围的位置 {pos,epos} 在数据的相对位置 pos 处放置的标签中的 epos - 标签被放置在总是正对相机的 billboard plane 上,Before、After 等指代的是该平面上的位置.
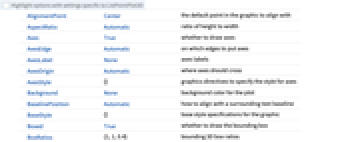
- ListPointPlot3D 具有与 Graphics3D 相同的选项,不同之处和更多选项如下所示: [所有选项的列表]
-
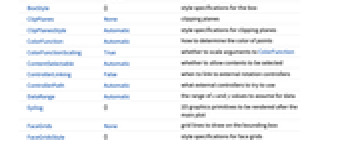
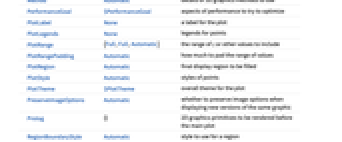
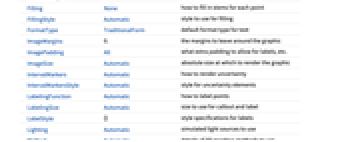
Axes True 是否绘制坐标轴 BoxRatios {1,1,0.4} 三维边界框的比率 ColorFunction Automatic 如何确定点的颜色 ColorFunctionScaling True 是否缩放传递给 ColorFunction 的参数 DataRange Automatic 假定的数据的 x 和 y 值的范围 Filling None 如何填充各个点的茎杆 FillingStyle Automatic 用于填充的样式 IntervalMarkers Automatic 如何呈现不确定性 IntervalMarkersStyle Automatic 具有不确定性的元素的样式 LabelingFunction Automatic 如何标记点 LabelingSize Automatic callout 和标签的尺寸 LabelingTarget Automatic 确定怎样自动安排标签的位置 PerformanceGoal $PerformanceGoal 优化的目标 PlotInteractivity $PlotInteractivity 是否允许出现互动元素 PlotLegends None 点的图例 PlotRange {Full,Full,Automatic} z 的范围或其它要包含的值 PlotRangePadding Automatic 对数值范围进行多少填充 PlotStyle Automatic 点的样式 PlotTheme $PlotTheme 绘图的整体外观主题 RegionFunction (True&) 如何确定一个点是否应该被包含 RegionBoundaryStyle ![TemplateBox[{Automatic, paclet:ref/Automatic}, RefLink, BaseStyle -> {3ColumnTableMod}]](Files/ListPointPlot3D.zh/1.png "TemplateBox[{Automatic, paclet:ref/Automatic}, RefLink, BaseStyle -> {3ColumnTableMod}]")
用于区域的样式 ScalingFunctions None 怎样缩放个别坐标 - 选项设置 Filling->Automatic 显示所有点的茎杆.
- DataRange 确定如何将数值 {{z11, …, z1n},…,{zm1,…,zmn}} {z1q,…,zn} 解释成 {{x11,y11,z11},…,{xmn,ymn,zmn}}. 可能的设置包括:
-
Automatic,All 从 1 到 m 或 n 均匀排列 {{xmin,xmax},{ymin,ymax}} 从 xmin 到 xmax,从 ymin 到 ymax 均匀排列 - 通常情况下列表 {{x1,y1,z1},{x2,y2,z2},…} 被解释成一系列点,但设置 DataRangeAll 会强制将其解释为多个 datai {{z11,z12,z13},{z21,z22,z23},…}.
- PlotStyle 允许使用任意图形指令,每个指令都会被应用到点的集合 datai 上.
- 提供给 ColorFunction 和 RegionFunction 中的函数的参数为 x、y 和 z. 默认情况下,提供给 ColorFunction 中的函数的是经过缩放的参数.
所有选项的列表


范例
打开所有单元 关闭所有单元基本范例 (6)
范围 (36)
普通数据 (8)
表格数据 (2)
特殊数据 (6)
数据封装 (6)
用 PopupWindow 提供额外的明细信息:
可用 Button 来触发任意操作:
添加标签与图例 (6)
选项 (84)
ColorFunction (5)
ColorFunctionScaling (2)
DataRange (5)
Filling (3)
ImageSize (7)
IntervalMarkers (2)
LabelingSize (3)
LabelingTarget (7)
RegionBoundaryStyle (3)
RegionFunction (4)
ScalingFunctions (5)
Ticks (6)
属性和关系 (11)
使用 ListPlot 和 ListLinePlot 绘制二维中的高度:
使用 ListLinePlot3D 绘制经过点列表的曲线:
使用 ListPlot3D 从数据中创建曲面:
使用 Plot3D 可视化函数:
对对数数据绘图使用 ListLogPlot,ListLogLogPlot,和 ListLogLinearPlot:
对极坐标图使用 ListPolarPlot:
使用 DateListPlot 显示根据时间变化的数据:
使用 ListContourPlot 根据连续数据创建等高线:
使用 ListDensityPlot 根据连续数据创建密度图:
对离散值数组使用 ArrayPlot 和 MatrixPlot:
对参数曲线使用 ParametricPlot:
文本
Wolfram Research (2007),ListPointPlot3D,Wolfram 语言函数,https://reference.wolfram.com/language/ref/ListPointPlot3D.html (更新于 2025 年).
CMS
Wolfram 语言. 2007. "ListPointPlot3D." Wolfram 语言与系统参考资料中心. Wolfram Research. 最新版本 2025. https://reference.wolfram.com/language/ref/ListPointPlot3D.html.
APA
Wolfram 语言. (2007). ListPointPlot3D. Wolfram 语言与系统参考资料中心. 追溯自 https://reference.wolfram.com/language/ref/ListPointPlot3D.html 年