


DiscretePlot3D
DiscretePlot3D[f,{i,imin,imax},{j,jmin,jmax}]
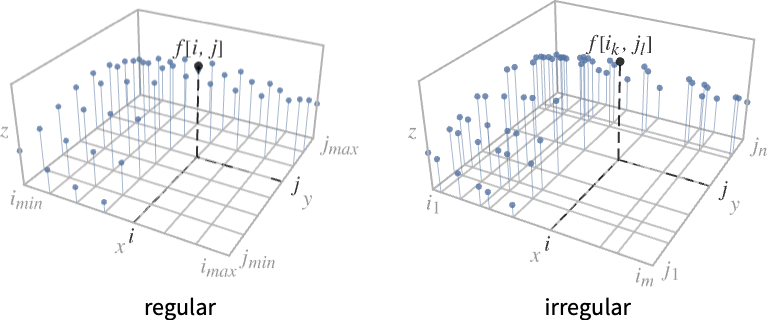
generates a plot of f when i runs from imin to imax and j runs from jmin to jmax.
DiscretePlot3D[f,{i,imin,imax,di},{j,jmin,jmax,dj}]
uses steps di and dj.
DiscretePlot3D[f,{i,{i1,…,im}},{j,{j1,…,jn}}]
uses successive i values i1, …, jm and j values j1, …, jn.
DiscretePlot3D[{f1,f2,…},…,…]
plots the values of all the fk.
Details and Options
- DiscretePlot3D is typically used to visualize bivariate sequences.
- DiscretePlot3D plots the variable i along the
 axis and j along the
  axis.
axis. - DiscretePlot3D uses the standard Wolfram Language iterator specification.
- DiscretePlot3D treats the variables i and j as local, effectively using Block.
- DiscretePlot3D has attribute HoldAll, and evaluates f only after assigning specific numerical values to i and j.
- In some cases, it may be more efficient to use Evaluate to evaluate f symbolically before specific numerical values are assigned to i and j.
- The precision used in evaluating f is the minimum precision used in the iterators.
- The form w[f] provides a wrapper w to be applied to the resulting graphics primitives.
- The following wrappers can be used:
-
Annotation[f,label] provide an annotation Button[f,action] define an action to execute when the element is clicked Callout[f,label] label the element with a callout Callout[f,label,pos] place the callout at relative position pos EventHandler[f,…] define a general event handler for the element Hyperlink[f,uri] make the element act as a hyperlink Labeled[f,label] make the data a hyperlink Labeled[f,label,pos] place the label at relative position pos Legended[f,label] identify the element in a legend PopupWindow[f,cont] attach a popup window to the element StatusArea[f,label] display in the status area when the element is moused over Style[f,opts] show the element using the specified styles Tooltip[f,label] attach an arbitrary tooltip to the element - Callout and Labeled can use the following positions pos:
-
Automatic automatically placed labels Above, Below, Before, After positions around the data x near the data at a position x {s,Above},{s,Below},… relative position at position s along the data {pos,epos} epos in label placed at relative position pos of the data - Labels that depend on {i,j} will be applied for each plot element, while labels that are independent of {i,j} will only occur once.
- DiscretePlot3D has the same options as Graphics3D, with the following additions and changes: [List of all options]
-
Axes True whether to draw axes BoxRatios {1,1,0.4} bounding 3D box ratios ClippingStyle Automatic how to draw clipped parts of surfaces ColorFunction Automatic how to determine the color of surfaces ColorFunctionScaling True whether to scale arguments to ColorFunction EvaluationMonitor None expression to evaluate at every function evaluation ExtentElementFunction Automatic how to generate raw graphics for extent fills ExtentMarkers None markers to use for extent boundaries ExtentSize Automatic width and depth to extend from plot point Filling Automatic filling under each surface FillingStyle Opacity[0.5] style to use for filling Joined False whether to join LabelingFunction Automatic how to label points LabelingSize Automatic maximum size of callouts and labels Method Automatic the methods to use PerformanceGoal $PerformanceGoal aspects of performance to try to optimize PlotLegends None legends for sequences PlotMarkers None markers to use for plot points PlotRange {Full,Full,Automatic} the range of  or other values to include
 PlotStyle Automatic graphics directives for the style for each surface PlotTheme $PlotTheme overall theme for the plot RegionFunction (True&) how to determine whether a point should be included ScalingFunctions None how to scale individual coordinates WorkingPrecision MachinePrecision the precision used in internal computations - The arguments supplied to ColorFunction are
 ,
,  ,
,  .
. - With the setting ExtentSize->{{sxl,sxr},{syl,syr}} a horizontal plane is drawn around each plot point extending sxl to the left and sxr to the right along the
 axis and syl to the left and syr to the right along the
  axis. With ExtentMarkers->{{mxl,mxr},{myl,myr}}, the markers mxl and mxr will be used as left and right markers along the
  axis and myl and myr as left and right markers along the
  axis.
axis. - The arguments supplied to ExtentElementFunction are the element region {{xmin,xmax},{ymin,ymax},{zmin,zmax}} and the sample point {xi,yi,zi}.
- With the setting ExtentSize->None, xmin is equal to xmax and ymin is equal to ymax. With the setting Filling->None, zmin is equal to zmax.
- Possible settings for PlotMarkers include:
-
None omit markers when drawing surfaces "Point" use 2D points as markers "Sphere" use 3D spheres as markers {"Point",s},{"Sphere",s} specify the size s of the markers {spec1,spec2,…} use specification speci for expression expri - The marker size s can be a symbolic value such as Tiny, Small, Medium and Large or a scaled fraction of the width of the graphic.
- Possible settings for ScalingFunctions include:
-
sz scale the z axis {sx,sy} scale x and y axes {sx,sy,sz} scale x, y and z axes - Each scaling function si is either a string "scale" or {g,g-1}, where g-1 is the inverse of g.
-
AlignmentPoint Center the default point in the graphic to align with AspectRatio Automatic ratio of height to width Axes True whether to draw axes AxesEdge Automatic on which edges to put axes AxesLabel None axes labels AxesOrigin Automatic where axes should cross AxesStyle {} graphics directives to specify the style for axes Background None background color for the plot BaselinePosition Automatic how to align with a surrounding text baseline BaseStyle {} base style specifications for the graphic Boxed True whether to draw the bounding box BoxRatios {1,1,0.4} bounding 3D box ratios BoxStyle {} style specifications for the box ClippingStyle Automatic how to draw clipped parts of surfaces ClipPlanes None clipping planes ClipPlanesStyle Automatic style specifications for clipping planes ColorFunction Automatic how to determine the color of surfaces ColorFunctionScaling True whether to scale arguments to ColorFunction ContentSelectable Automatic whether to allow contents to be selected ControllerLinking False when to link to external rotation controllers ControllerPath Automatic what external controllers to try to use Epilog {} 2D graphics primitives to be rendered after the main plot EvaluationMonitor None expression to evaluate at every function evaluation ExtentElementFunction Automatic how to generate raw graphics for extent fills ExtentMarkers None markers to use for extent boundaries ExtentSize Automatic width and depth to extend from plot point FaceGrids None grid lines to draw on the bounding box FaceGridsStyle {} style specifications for face grids Filling Automatic filling under each surface FillingStyle Opacity[0.5] style to use for filling FormatType TraditionalForm default format type for text ImageMargins 0. the margins to leave around the graphic ImagePadding All what extra padding to allow for labels, etc. ImageSize Automatic absolute size at which to render the graphic Joined False whether to join LabelingFunction Automatic how to label points LabelingSize Automatic maximum size of callouts and labels LabelStyle {} style specifications for labels Lighting Automatic simulated light sources to use Method Automatic the methods to use PerformanceGoal $PerformanceGoal aspects of performance to try to optimize PlotLabel None a label for the plot PlotLegends None legends for sequences PlotMarkers None markers to use for plot points PlotRange {Full,Full,Automatic} the range of  or other values to include
 PlotRangePadding Automatic how much to pad the range of values PlotRegion Automatic final display region to be filled PlotStyle Automatic graphics directives for the style for each surface PlotTheme $PlotTheme overall theme for the plot PreserveImageOptions Automatic whether to preserve image options when displaying new versions of the same graphic Prolog {} 2D graphics primitives to be rendered before the main plot RegionFunction (True&) how to determine whether a point should be included RotationAction "Fit" how to render after interactive rotation ScalingFunctions None how to scale individual coordinates SphericalRegion Automatic whether to make the circumscribing sphere fit in the final display area Ticks Automatic specification for ticks TicksStyle {} style specification for ticks TouchscreenAutoZoom False whether to zoom to fullscreen when activated on a touchscreen ViewAngle Automatic angle of the field of view ViewCenter Automatic point to display at the center ViewMatrix Automatic explicit transformation matrix ViewPoint {1.3,-2.4,2.} viewing position ViewProjection Automatic projection method for rendering objects distant from the viewer ViewRange All range of viewing distances to include ViewVector Automatic position and direction of a simulated camera ViewVertical {0,0,1} direction to make vertical WorkingPrecision MachinePrecision the precision used in internal computations
List of all options
Examples
open all close allBasic Examples (3)
DiscretePlot3D[PDF[MultivariatePoissonDistribution[3, {1, 1}], {t, u}], {t, 0, 10}, {u, 0, 10}]Associate a region with the points:
DiscretePlot3D[PDF[MultivariatePoissonDistribution[3, {1, 1}], {t, u}], {t, 0, 10}, {u, 0, 10}, ExtentSize -> Full]DiscretePlot3D[{PDF[MultivariatePoissonDistribution[3, {1, 1}], {t, u}], PDF[MultivariatePoissonDistribution[5, {2, 2}], {t, u}]}, {t, 0, 10}, {u, 0, 10}, ExtentSize -> Full]Scope (12)
Data and Layouts (4)
DiscretePlot3D[{Sin[t + u], Cos[t + u]}, {t, 0, 2Pi, Pi / 12}, {u, 0, 2Pi, Pi / 12}, ExtentSize -> Full]Use wrappers on individual data, datasets, or collections of datasets:
{DiscretePlot3D[{Sin[t + u], Cos[t + u]}, {t, 0, 2 * Pi, Pi / 6}, {u, 0, 2 * Pi, Pi / 6}, ExtentSize -> Full], DiscretePlot3D[{Sin[t + u], Style[Cos[t + u], Green]}, {t, 0, 2 * Pi, Pi / 6}, {u, 0, 2 * Pi, Pi / 6}, ExtentSize -> Full], DiscretePlot3D[Style[{Sin[t + u], Cos[t + u]}, Green], {t, 0, 2 * Pi, Pi / 6}, {u, 0, 2 * Pi, Pi / 6}, ExtentSize -> Full]}DiscretePlot3D[Style[{Sin[t + u], Style[Cos[t + u], Green]}, Red], {t, 0, 2 * Pi, Pi / 12}, {u, 0, 2 * Pi, Pi / 12}, ExtentSize -> Full]Override the default tooltips:
DiscretePlot3D[{Sin[t + u], Tooltip[Cos[t + u], "my data"]}, {t, 0, 2 * Pi, Pi / 12}, {u, 0, 2 * Pi, Pi / 12}, ExtentSize -> Full]Use PopupWindow to provide additional drilldown information:
DiscretePlot3D[PopupWindow[PDF[MultivariatePoissonDistribution[3, {1, 1}], {t, u}], TraditionalForm[PDF[MultivariatePoissonDistribution[3, {1, 1}], {t, u}]]], {t, 0, 10}, {u, 0, 10}, ExtentSize -> Full]Button can be used to trigger any action:
DiscretePlot3D[Evaluate@Table[With[{lambda = λ}, Button[PDF[
      MultivariatePoissonDistribution[lambda, {1, 1}], {t, u}],
  Speak[MultivariatePoissonDistribution[lambda, {1, 1}]]]], {λ, {1, 2, 3}}],
  {t, 0, 10}, {u, 0, 10}, PlotRange -> All, ExtentSize -> Full]
Use ScalingFunctions to scale the axes:
DiscretePlot3D[LCM[x, y], {x, 20}, {y, 20}, ExtentSize -> Full, ScalingFunctions -> "Log"]Labeling and Legending (3)
DiscretePlot3D[Callout[GCD[x, y], If[x == y, x, None], Above], {x, Prime[Range[10]]}, {y, Prime[Range[10]]}]DiscretePlot3D[Tooltip[GCD[x, y], GCD[x, y]], {x, Prime[Range[10]]}, {y, Prime[Range[10]]}]Specify label names with LabelingFunction:
DiscretePlot3D[GCD[x, y], {x, 1, 5}, {y, 1, 5}, LabelingFunction -> (#1[[1]] &)]DiscretePlot3D[Callout[GCD[x, y], IntegerName@GCD[x, y]], {x, 1, 5}, {y, 1, 5}]Styling and Appearance (5)
Use ExtentSize to associate a region with a point:
Table[DiscretePlot3D[PDF[MultivariatePoissonDistribution[3, {1, 1}], {t, u}], {t, 0, 10}, {u, 0, 10}, ExtentSize -> s, PlotLabel -> s], {s, {None, Full, Right, Scaled[0.5]}}]Use an explicit list of styles for the plots:
DiscretePlot3D[{Sin[t + u], Cos[t + u]}, {t, 0, 2 * Pi}, {u, 0, 2 * Pi}, PlotStyle -> {Red, Blue}, ExtentSize -> Full]Use any gradient color schemes from ColorData:
{DiscretePlot3D[{Sin[t + u], Cos[t + u]}, {t, 0, 2 * Pi}, {u, 0, 2 * Pi}, ColorFunction -> "Pastel", ExtentSize -> Full], DiscretePlot3D[{Sin[t + u], Cos[t + u]}, {t, 0, 2 * Pi}, {u, 0, 2 * Pi}, ColorFunction -> Function[{x, y}, ColorData["NeonColors"][y]], ExtentSize -> Full]}Style can be used to override styles:
DiscretePlot3D[{Sin[t + u], Style[Cos[t + u], Red]}, {t, 0, 2 * Pi}, {u, 0, 2 * Pi}, PlotStyle -> Gray, ExtentSize -> Full]DiscretePlot3D[Exp[-x ^ 2 - y ^ 2], {x, -3, 3, 0.25}, {y, -3, 3, 0.25}, PlotMarkers -> "Sphere"]Show extent region boundaries:
DiscretePlot3D[PDF[MultivariatePoissonDistribution[3, {1, 1}], {t, u}], {t, 10}, {u, 10}, ColorFunction -> "Rainbow", ExtentSize -> Full, ExtentMarkers -> "Tube"]DiscretePlot3D[PDF[MultivariatePoissonDistribution[3, {1, 1}], {t, u}], {t, 10}, {u, 10}, ExtentSize -> Full, ColorFunction -> "DarkRainbow", ExtentMarkers -> {{"Tube", None}, {"Tube", None}}]Use a theme with dark background in a high-contrast color scheme:
DiscretePlot3D[Mod[x, y], {x, 10}, {y, 10}, PlotTheme -> "Marketing"]Options (90)
Axes (3)
By default, Axes are drawn for DiscretePlot3D:
DiscretePlot3D[Mod[x, y], {x, 10}, {y, 10}, ExtentSize -> Full]Use AxesFalse to turn off axes:
DiscretePlot3D[Mod[x, y], {x, 10}, {y, 10}, ExtentSize -> Full, Axes -> False]Turn each axis on individually:
{DiscretePlot3D[Mod[x, y], {x, 10}, {y, 10}, ExtentSize -> Full, Axes -> {True, False, False}], DiscretePlot3D[Mod[x, y], {x, 10}, {y, 10}, ExtentSize -> Full, Axes -> {False, True, False}], DiscretePlot3D[Mod[x, y], {x, 10}, {y, 10}, ExtentSize -> Full, Axes -> {False, False, True}]}AxesLabel (4)
No axes labels are drawn by default:
DiscretePlot3D[Mod[x, y], {x, 10}, {y, 10}, ExtentSize -> Full]DiscretePlot3D[Mod[x, y], {x, 10}, {y, 10}, ExtentSize -> Full, AxesLabel -> "Mod[x,y]"]DiscretePlot3D[Mod[x, y], {x, 10}, {y, 10}, ExtentSize -> Full, AxesLabel -> {"x", "y", "Mod[x,y]"}]Use labels based on variables specified in DiscretePlot3D:
DiscretePlot3D[Mod[x, y], {x, 10}, {y, 10}, ExtentSize -> Full, AxesLabel -> Automatic]AxesOrigin (2)
AxesStyle (4)
Change the style for the axes:
DiscretePlot3D[Mod[x, y], {x, 10}, {y, 10}, ExtentSize -> Full, AxesStyle -> Red]Specify the style of each axis:
DiscretePlot3D[Mod[x, y], {x, 10}, {y, 10}, ExtentSize -> Full, AxesStyle -> {{Thick, Brown}, {Thick, Blue}, {Thick, Green}}]Use different styles for the ticks and the axes:
DiscretePlot3D[Mod[x, y], {x, 10}, {y, 10}, ExtentSize -> Full, AxesStyle -> Green, TicksStyle -> StandardBlue]Use different styles for the labels and the axes:
DiscretePlot3D[Mod[x, y], {x, 10}, {y, 10}, ExtentSize -> Full, AxesStyle -> Green, LabelStyle -> Red]ColorFunction (6)
Color the points by scaled ![]() ,
, ![]() , or
, or ![]() value:
value:
Map[DiscretePlot3D[PDF[MultivariatePoissonDistribution[5, {2, 3}], {x, y}], {x, 0, 15}, {y, 0, 15}, ColorFunction -> Function[{x, y, z}, #], PlotLabel -> #]&, {Hue[x], Hue[y], Hue[z]}]Color the surface by scaled ![]() ,
, ![]() , or
, or ![]() value:
value:
Map[DiscretePlot3D[PDF[MultivariatePoissonDistribution[5, {2, 3}], {x, y}], {x, 0, 15}, {y, 0, 15}, Joined -> True, PlotRange -> All, ColorFunction -> Function[{x, y, z}, #], PlotLabel -> #]&, {Hue[x], Hue[y], Hue[z]}]Color the regions by scaled ![]() ,
, ![]() , or
, or ![]() value:
value:
Map[DiscretePlot3D[PDF[MultivariatePoissonDistribution[5, {2, 3}], {x, y}], {x, 0, 15}, {y, 0, 15}, ExtentSize -> Full, ColorFunction -> Function[{x, y, z}, #], PlotLabel -> #]&, {Hue[x], Hue[y], Hue[z]}]DiscretePlot3D[PDF[MultivariatePoissonDistribution[1, {1, 1}], {x, y}], {x, 0, 15}, {y, 0, 15}, ExtentSize -> Full, ColorFunction -> "Rainbow"]ColorFunction has higher priority than PlotStyle:
DiscretePlot3D[PDF[MultivariatePoissonDistribution[5, {2, 3}], {x, y}], {x, 0, 15}, {y, 0, 15}, ColorFunction -> "Rainbow", PlotStyle -> Directive[Red, PointSize[Large]]]Use black when two numbers are relatively prime:
DiscretePlot3D[GCD[m, n], {m, 1, 20}, {n, 1, 20}, ExtentSize -> Full, ColorFunction -> Function[{x, y, z}, If[z == 1, Black, Hue[z / 20]]], ColorFunctionScaling -> False]ColorFunctionScaling (1)
EvaluationMonitor (1)
ExtentElementFunction (5)
Get a list of built-in settings for ExtentElementFunction:
ChartElementData["DiscretePlot3D"]For detailed settings, use Palettes ▶ Chart Element Schemes:
Table[DiscretePlot3D[PDF[MultivariatePoissonDistribution[1, {1, 1}], {x, y}], {x, 0, 8}, {y, 0, 8}, ExtentSize -> Full, ExtentElementFunction -> f], {f, {"Cone", "Cube", "Cylinder", "PlaneFadingCube"}}]Table[DiscretePlot3D[PDF[MultivariatePoissonDistribution[1, {1, 1}], {x, y}], {x, 0, 8}, {y, 0, 8}, ExtentSize -> Full, ExtentElementFunction -> f], {f, {"ProfileCube", "DoubleProfileCube", "SquareWaveCube", "TriangleWaveCube"}}]This ChartElementFunction is appropriate to show the global scale:
Table[DiscretePlot3D[PDF[MultivariatePoissonDistribution[1, {1, 1}], {x, y}], {x, 0, 8}, {y, 0, 8}, ExtentSize -> Full, ExtentElementFunction -> f], {f, {"GradientScaleCube", "SegmentScaleCube"}}]Write a custom ExtentElementFunction:
vase[{{xmin_, xmax_}, {ymin_, ymax_}, {zmin_, zmax_}}, ___] := {CapForm[None], Tube[
	Table[{(xmin + xmax) / 2, (ymin + ymax) / 2, z}, {z, zmin, zmax, (zmax - zmin) / 15}],
Join[Sort[RandomReal[(xmax - xmin){0.1, 0.5}, 8], Less], Sort[RandomReal[(xmax - xmin){0.1, 0.5}, 8], Greater]]]}DiscretePlot3D[PDF[MultivariatePoissonDistribution[1, {1, 1}], {x, y}], {x, 0, 5}, {y, 0, 5}, ExtentSize -> Full, ExtentElementFunction -> vase, PlotRange -> {0, 0.1}]A built-in element function may have options; use Palettes ▶ Chart Element Schemes to set them:
ChartElementData["ProfileCube", "Options"]Table[DiscretePlot3D[PDF[MultivariatePoissonDistribution[1, {1, 1}], {x, y}], {x, 0, 5}, {y, 0, 5}, ExtentSize -> Full, ExtentElementFunction -> ChartElementData["ProfileCube", "Profile" -> p, "TaperRatio" -> r]], {p, {0.1, 1, 5}}, {r, {0, 0.5, 1}}]ExtentMarkers (4)
DiscretePlot3D[LCM[m, n], {m, 6}, {n, 6}, ExtentSize -> Full, ExtentMarkers -> None, PlotStyle -> EdgeForm[]]Use lines to show the extent edges:
DiscretePlot3D[LCM[m, n], {m, 6}, {n, 6}, ExtentSize -> Full, ExtentMarkers -> {"Line", 5}, PlotStyle -> EdgeForm[]]Use varying sized tubes to show the extent edges:
Table[DiscretePlot3D[LCM[m, n], {m, 5}, {n, 5}, ExtentSize -> Full, ExtentMarkers -> {"Tube", size}], {size, {Tiny, Small, Medium, Large}}]Place tubes along the front and left edges of the extent region:
DiscretePlot3D[LCM[m, n], {m, 5}, {n, 5}, ExtentSize -> Full, ExtentMarkers -> {{"Tube", None}, {"Tube", None}}]ExtentSize (6)
DiscretePlot3D[LCM[m, n], {m, 5}, {n, 5}, ExtentSize -> None]Draw full regions around the heights:
DiscretePlot3D[LCM[m, n], {m, 5}, {n, 5}, ExtentSize -> Full]DiscretePlot3D[LCM[m, n], {m, {1, 2, 3, 5, 8, 13}}, {n, {1, 2, 3, 5, 8, 13}}, ExtentSize -> Full]DiscretePlot3D[LCM[m, n], {m, 5}, {n, 5}, ExtentSize -> 0.5]DiscretePlot3D[LCM[m, n], {m, {1, 2, 3, 5, 8, 13}}, {n, {1, 2, 3, 5, 8, 13}}, ExtentSize -> 0.5]Use sizes relative to the distance between points:
DiscretePlot3D[LCM[m, n], {m, 5}, {n, 5}, ExtentSize -> Scaled[0.75]]DiscretePlot3D[LCM[m, n], {m, {1, 2, 3, 5, 8, 13}}, {n, {1, 2, 3, 5, 8, 13}}, ExtentSize -> Scaled[0.75]]Use equally sized regions that do not overlap:
DiscretePlot3D[LCM[m, n], {m, 5}, {n, 5}, ExtentSize -> All]DiscretePlot3D[LCM[m, n], {m, {1, 2, 3, 5, 8, 13}}, {n, {1, 2, 3, 5, 8, 13}}, ExtentSize -> All]Control the placement of the region around the points:
Table[DiscretePlot3D[LCM[m, n], {m, 5}, {n, 5}, ExtentSize -> es, PlotLabel -> es, PlotMarkers -> {"Sphere", Large}], {es, {{{None, Full}, {None, Full}}, {{Full, None}, {Full, None}}}}]Filling (3)
DiscretePlot3D fills to ![]() :
:
Table[DiscretePlot3D[Mod[m, n], {m, 15}, {n, 15}, Evaluate[opt]], {opt, {Joined -> False, Joined -> True, ExtentSize -> Full}}]Table[DiscretePlot3D[Mod[m, n], {m, 15}, {n, 15}, Filling -> None, Evaluate[opt]], {opt, {Joined -> False, Joined -> True, ExtentSize -> Full}}]Table[DiscretePlot3D[Mod[m, n] - Mod[n, m], {m, 15}, {n, 15}, Filling -> fill, PlotLabel -> fill], {fill, {Bottom, Top, Axis, -20}}]FillingStyle (3)
Fill to the bottom with a variety of styles:
Table[DiscretePlot3D[Mod[m, n] - Mod[n, m], {m, 15}, {n, 15}, Filling -> Bottom, FillingStyle -> fs], {fs, {Opacity[1], Red, Dashed, Thick}}]Table[DiscretePlot3D[Mod[m, n] - Mod[n, m], {m, 15}, {n, 15}, ExtentSize -> Full, Filling -> Bottom, FillingStyle -> fs], {fs, {Opacity[1], Red}}]Use different colors above and below the filling level:
Table[DiscretePlot3D[Mod[m, n] - Mod[n, m], {m, 15}, {n, 15}, ExtentSize -> es, Filling -> Axis, FillingStyle -> {Red, Blue}], {es, {None, Full}}]Only fill below the filling level:
Table[DiscretePlot3D[Mod[m, n] - Mod[n, m], {m, 15}, {n, 15}, ExtentSize -> es, Filling -> Axis, FillingStyle -> {Red, None}], {es, {None, Full}}]ImageSize (7)
Use named sizes such as Tiny, Small, Medium and Large:
{DiscretePlot3D[Mod[x, y], {x, 10}, {y, 10}, ExtentSize -> Full, ImageSize -> Tiny], DiscretePlot3D[Mod[x, y], {x, 10}, {y, 10}, ExtentSize -> Full, ImageSize -> Small]}Specify the width of the plot:
{DiscretePlot3D[Mod[x, y], {x, 10}, {y, 10}, ExtentSize -> Full, ImageSize -> 150], DiscretePlot3D[Mod[x, y], {x, 10}, {y, 10}, ExtentSize -> Full, AspectRatio -> 1.5, ImageSize -> 150]}Specify the height of the plot:
{DiscretePlot3D[Mod[x, y], {x, 10}, {y, 10}, ExtentSize -> Full, ImageSize -> {Automatic, 150}], DiscretePlot3D[Mod[x, y], {x, 10}, {y, 10}, ExtentSize -> Full, AspectRatio -> 2, ImageSize -> {Automatic, 150}]}Allow the width and height to be up to a certain size:
{DiscretePlot3D[Mod[x, y], {x, 10}, {y, 10}, ExtentSize -> Full, ImageSize -> UpTo[200]], DiscretePlot3D[Mod[x, y], {x, 10}, {y, 10}, ExtentSize -> Full, AspectRatio -> 2, ImageSize -> UpTo[200]]}Specify the width and height for a graphic, padding with space if necessary:
DiscretePlot3D[Mod[x, y], {x, 10}, {y, 10}, ExtentSize -> Full, ImageSize -> {200, 250}, Background -> StandardGray]Setting AspectRatioFull will fill the available space:
DiscretePlot3D[Mod[x, y], {x, 10}, {y, 10}, ExtentSize -> Full, AspectRatio -> Full, ImageSize -> {200, 250}, Background -> StandardGray]Use maximum sizes for the width and height:
{DiscretePlot3D[Mod[x, y], {x, 10}, {y, 10}, ExtentSize -> Full, ImageSize -> {UpTo[150], UpTo[100]}], DiscretePlot3D[Mod[x, y], {x, 10}, {y, 10}, ExtentSize -> Full, AspectRatio -> 2, ImageSize -> {UpTo[150], UpTo[100]}]}Use ImageSizeFull to fill the available space in an object:
Framed[Pane[DiscretePlot3D[Mod[x, y], {x, 10}, {y, 10}, ExtentSize -> Full, ImageSize -> Full, Background -> StandardGray], {200, 100}]]Specify the image size as a fraction of the available space:
Framed[Pane[DiscretePlot3D[Mod[x, y], {x, 10}, {y, 10}, ExtentSize -> Full, AspectRatio -> Full, ImageSize -> {Scaled[0.5], Scaled[0.5]}, Background -> StandardGray], {250, 250}]]Joined (2)
Join the points into a surface:
DiscretePlot3D[PDF[MultivariatePoissonDistribution[5, {2, 3}], {x, y}], {x, 0, 15}, {y, 0, 15}, Joined -> True]Combine a surface with extent regions:
DiscretePlot3D[PDF[MultivariatePoissonDistribution[5, {2, 3}], {x, y}], {x, 0, 15}, {y, 0, 15}, Joined -> True, ExtentSize -> Full]LabelingFunction (4)
Put the labels above the points:
DiscretePlot3D[GCD[x, y], {x, 1, 5}, {y, 1, 5}, LabelingFunction -> Above]DiscretePlot3D[GCD[x, y], {x, 1, 5}, {y, 1, 5}, LabelingFunction -> Tooltip]Use callouts to label the points:
DiscretePlot3D[GCD[x, y], {x, 1, 5}, {y, 1, 5}, LabelingFunction -> Callout[Automatic, Automatic]]Label the points with their values:
DiscretePlot3D[GCD[x, y], {x, 1, 5}, {y, 1, 5}, LabelingFunction -> (#1&)]Label the points with their indices:
DiscretePlot3D[GCD[x, y], {x, 1, 5}, {y, 1, 5}, LabelingFunction -> (#2&)]LabelingSize (1)
Specify a maximum size for textual labels:
DiscretePlot3D[Callout[GCD[x, y], IntegerName[x]], {x, 500, 505}, {y, 500, 505}, ImageSize -> Medium, LabelingSize -> 30]DiscretePlot3D[Callout[x + y, IntegerName[x + y]], {x, 0, 10}, {y, 0, 10}, ImageSize -> Medium, LabelingSize -> Full]PlotLegends (6)
DiscretePlot3D[{Sin[x + y], Cos[x + y]}, {x, 20}, {y, 20}, ExtentSize -> Full, PlotLegends -> Automatic]Specify a list of labels for legends:
DiscretePlot3D[{x, y}, {x, 20}, {y, 20}, ExtentSize -> Full, PlotLegends -> {"label1", "label2"}]DiscretePlot3D[{Sin[x + y], Sin[x - y]}, {x, 20}, {y, 20}, ExtentSize -> Full, PlotLegends -> "Expressions"]PlotLegends automatically picks up PlotStyle values:
DiscretePlot3D[{Sin[(x + y) ^ 2], Sin[(x - y) ^ 2]}, {x, 0, 2, 0.2}, {y, 0, 2, 0.2}, ExtentSize -> Full, PlotStyle -> {Red, Blue}, PlotLegends -> "Expressions"]Use Placed to control legend placement:
Table[DiscretePlot3D[{Sin[(x + y)], Sin[(x - y)]}, {x, 0, 2, 0.2}, {y, 0, 2, 0.2}, ExtentSize -> Full, PlotStyle -> {Orange, Blue}, PlotLegends -> Placed["Expressions", pos]], {pos, {Above, Below}}]Use SwatchLegend to change legend appearance:
DiscretePlot3D[{Sin[(x + y) ^ 2], Sin[(x - y) ^ 2]}, {x, 0, 2, 0.2}, {y, 0, 2, 0.2}, ExtentSize -> Full, PlotStyle -> {Red, Blue}, PlotLegends -> SwatchLegend["Expressions", LegendLabel -> "label", LegendFunction -> (Framed[#, RoundingRadius -> 5]&)]]PlotMarkers (4)
Change the size of the default plot markers:
Table[DiscretePlot3D[PDF[MultivariatePoissonDistribution[5, {2, 3}], {x, y}], {x, 0, 15}, {y, 0, 15}, PlotMarkers -> {Automatic, s}], {s, {Tiny, Small, Medium, Large}}]Markers are not usually shown when surfaces are used:
{DiscretePlot3D[PDF[MultivariatePoissonDistribution[5, {2, 3}], {x, y}], {x, 0, 15}, {y, 0, 15}, Joined -> True], DiscretePlot3D[PDF[MultivariatePoissonDistribution[5, {2, 3}], {x, y}], {x, 0, 15}, {y, 0, 15}, ExtentSize -> Full]}{DiscretePlot3D[PDF[MultivariatePoissonDistribution[5, {2, 3}], {x, y}], {x, 0, 15}, {y, 0, 15}, Joined -> True, PlotMarkers -> "Point", PlotStyle -> FaceForm[Lighter[Blue, 0.5]]], DiscretePlot3D[PDF[MultivariatePoissonDistribution[5, {2, 3}], {x, y}], {x, 0, 15}, {y, 0, 15}, ExtentSize -> Full, PlotMarkers -> "Point"]}{DiscretePlot3D[PDF[MultivariatePoissonDistribution[5, {2, 3}], {x, y}], {x, 0, 15}, {y, 0, 15}, PlotMarkers -> "Sphere"], DiscretePlot3D[PDF[MultivariatePoissonDistribution[5, {2, 3}], {x, y}], {x, 0, 15}, {y, 0, 15}, ExtentSize -> Full, PlotMarkers -> "Sphere"]}Table[DiscretePlot3D[PDF[MultivariatePoissonDistribution[5, {2, 3}], {x, y}], {x, 0, 15}, {y, 0, 15}, PlotMarkers -> {"Sphere", s}], {s, {Tiny, Small, Medium, Large}}]PlotStyle (7)
Use different style directives:
Table[DiscretePlot3D[PDF[MultivariatePoissonDistribution[5, {2, 3}], {x, y}], {x, 0, 15}, {y, 0, 15}, PlotStyle -> ps], {ps, {Red, PointSize[0.025], Darker[Green], Directive[Red, PointSize[Small]]}}]By default, different styles are chosen for multiple functions:
DiscretePlot3D[Evaluate[Table[PDF[MultivariatePoissonDistribution[2k, {k, 3k}], {x, y}], {k, 3}]], {x, 20}, {y, 20}, ExtentSize -> Full]Explicitly specify the style for different functions:
DiscretePlot3D[Evaluate[Table[PDF[MultivariatePoissonDistribution[2k, {k, 3k}], {x, y}], {k, 3}]], {x, 20}, {y, 20}, ExtentSize -> Full, PlotStyle -> {Red, Orange, Blue}]PlotStyle applies to points, lines, and surfaces:
DiscretePlot3D[PDF[MultivariatePoissonDistribution[5, {2, 3}], {x, y}], {x, 0, 15}, {y, 0, 15}, PlotStyle -> Red]DiscretePlot3D[PDF[MultivariatePoissonDistribution[5, {2, 3}], {x, y}], {x, 0, 15}, {y, 0, 15}, ExtentSize -> Full, PlotStyle -> Directive[Orange, EdgeForm[Blue]]]PlotStyle can be combined with ColorFunction:
DiscretePlot3D[PDF[MultivariatePoissonDistribution[5, {2, 3}], {x, y}], {x, 0, 15}, {y, 0, 15}, PlotStyle -> PointSize[Medium], ColorFunction -> Function[{x, y, z}, Hue[z]]]PlotStyle can be combined with FillingStyle:
DiscretePlot3D[PDF[MultivariatePoissonDistribution[5, {2, 3}], {x, y}], {x, 0, 15}, {y, 0, 15}, PlotStyle -> Red, FillingStyle -> Opacity[1]]FillingStyle by default uses the same style as PlotStyle with transparency:
DiscretePlot3D[PDF[MultivariatePoissonDistribution[5, {2, 3}], {x, y}], {x, 0, 15}, {y, 0, 15}, PlotStyle -> Red]PlotTheme (4)
Use a theme with simple ticks and grid lines:
DiscretePlot3D[{CDF[MultivariatePoissonDistribution[3, {1, 1}], {t, u}], SurvivalFunction[MultivariatePoissonDistribution[3, {1, 1}], {t, u}]}, {t, 10}, {u, 10}, PlotTheme -> "Business"]DiscretePlot3D[{CDF[MultivariatePoissonDistribution[3, {1, 1}], {t, u}], SurvivalFunction[MultivariatePoissonDistribution[3, {1, 1}], {t, u}]}, {t, 10}, {u, 10}, PlotTheme -> "Business", PlotStyle -> {Red, Blue}]Use a theme with dark background in a high-contrast color scheme:
DiscretePlot3D[GCD[m, n], {m, 15}, {n, 15}, PlotTheme -> "Marketing"]DiscretePlot3D[GCD[m, n], {m, 15}, {n, 15}, PlotTheme -> "Marketing", Ticks -> None]RegionFunction (4)
DiscretePlot3D[GCD[m, n], {m, 25}, {n, 25}, RegionFunction -> Function[{m, n, z}, m ≤ n]]Extended regions are treated as the underlying point without additional clipping:
DiscretePlot3D[GCD[m, n], {m, 5}, {n, 5}, ExtentSize -> Full, RegionFunction -> Function[{m, n, z}, m <= n], PlotMarkers -> "Sphere"]Regions can have several unconnected components:
DiscretePlot3D[GCD[m, n], {m, 25}, {n, 25}, RegionFunction -> Function[{m, n, z}, Mod[m + n, 10] ≤ 7]]Define regions using logical combinations of constraints:
DiscretePlot3D[GCD[m, n], {m, 25}, {n, 25}, RegionFunction -> Function[{m, n, z}, m ^ 2 + n ^ 2 ≤ 625 && m + n ≥ 25]]ScalingFunctions (9)
By default, plots have linear scales in each direction:
DiscretePlot3D[Max[x, y], {x, 0, 10, .5}, {y, 0, 10, .5}, ExtentSize -> Full]Use a log scale in the ![]() direction:
direction:
DiscretePlot3D[Max[x, y], {x, 1, 10, .5}, {y, 1, 10, .5}, ExtentSize -> Full, ScalingFunctions -> "Log"]Use a linear scale in the ![]() direction that shows smaller numbers at the front:
direction that shows smaller numbers at the front:
DiscretePlot3D[Max[x, y], {x, 0, 10, .5}, {y, 0, 10, .5}, ExtentSize -> Full, ScalingFunctions -> {None, "Reverse"}]Use a reciprocal scale in the ![]() direction:
direction:
DiscretePlot3D[Max[x, y], {x, 1, 10, .5}, {y, 1, 10, .5}, ExtentSize -> Full, ScalingFunctions -> {None, "Reciprocal"}]Use different scales in the ![]() and
and ![]() directions:
directions:
DiscretePlot3D[Max[x, y], {x, 0, 10, .5}, {y, 0, 10, .5}, ExtentSize -> Full, ScalingFunctions -> {"Reverse", "Log"}]Reverse the ![]() axis without changing the
axis without changing the ![]() axis:
axis:
DiscretePlot3D[Max[x, y], {x, 0, 10, .5}, {y, 0, 10, .5}, ExtentSize -> Full, ScalingFunctions -> {"Reverse", None}]Use a ![]() scale defined by a function and its inverse:
scale defined by a function and its inverse:
DiscretePlot3D[Max[x, y], {x, 0, 10, .5}, {y, 0, 10, .5}, ExtentSize -> Full, ScalingFunctions -> {None, {-Log[#]&, Exp[-#]&}}]Positions in Ticks and FaceGrids are automatically scaled:
DiscretePlot3D[u + t ^ 2, {t, 0.01, 50}, {u, 0, 10}, ExtentSize -> Full, ScalingFunctions -> {"Log", None}, Ticks -> {2 ^ Range[10], Automatic, Automatic}, FaceGrids -> All]PlotRange is automatically scaled:
DiscretePlot3D[LCM[m, n], {m, 50}, {n, 50}, ExtentSize -> Full, ScalingFunctions -> "Log", PlotRange -> {100, 1000}]Applications (2)
Visualize properties of discrete distributions, such as probability density function:
Table[DiscretePlot3D[PDF[MultivariatePoissonDistribution[μ, {2, 3}], {x, y}], {x, 0, 15}, {y, 0, 15}, ExtentSize -> 0.5, PlotLabel -> Row[{"μ = ", μ}]], {μ, {1, 5}}]Cumulative distribution function:
Table[DiscretePlot3D[CDF[MultivariatePoissonDistribution[μ, {2, 3}], {x, y}], {x, 0, 15}, {y, 0, 15}, PlotStyle -> Purple, ExtentSize -> Right, PlotLabel -> Row[{"μ = ", μ}]], {μ, {1, 5}}]Table[DiscretePlot3D[SurvivalFunction[MultivariatePoissonDistribution[μ, {2, 3}], {x, y}], {x, 0, 15}, {y, 0, 15}, PlotStyle -> Orange, ExtentSize -> Right, PlotLabel -> Row[{"μ = ", μ}]], {μ, {1, 5}}]Approximate the volume under a surface using Riemann sums:
plot = Plot3D[PDF[BinormalDistribution[0.5], {x, y}], {x, -2, 2}, {y, -2, 2}, PlotStyle -> Directive[Opacity[0.4], Yellow], RegionFunction -> (# < 0 || #2 > 0&)]riemann = DiscretePlot3D[PDF[BinormalDistribution[0.5], {x, y}], {x, -2, 2, 0.5}, {y, -2, 2, 0.5}, ExtentSize -> Full, RegionFunction -> (# < 0 || #2 > 0&)]Show[plot, riemann]Properties & Relations (4)
Plot3D generates continuous surfaces:
Plot3D[PDF[BinormalDistribution[0.5], {x, y}], {x, -2, 2}, {y, -2, 2}]Use ListPointPlot3D to plot lists of values:
{ListPointPlot3D[Table[Table[x + y, {x, 10}], {y, 10}]], DiscretePlot3D[x + y, {x, 10}, {y, 10}]}Use BarChart3D to show bars for lists of values:
{BarChart3D[Table[Table[x + y, {x, 10}], {y, 10}], ChartLayout -> "Grid"], DiscretePlot3D[x + y, {x, 10}, {y, 10}, ExtentSize -> Full]}Use DiscretePlot to plot functions of single discrete variables:
DiscretePlot[PDF[PoissonDistribution[4], x], {x, 0, 10}, ExtentSize -> Scaled[0.5]]Text
Wolfram Research (2010), DiscretePlot3D, Wolfram Language function, https://reference.wolfram.com/language/ref/DiscretePlot3D.html (updated 2019).
CMS
Wolfram Language. 2010. "DiscretePlot3D." Wolfram Language & System Documentation Center. Wolfram Research. Last Modified 2019. https://reference.wolfram.com/language/ref/DiscretePlot3D.html.
APA
Wolfram Language. (2010). DiscretePlot3D. Wolfram Language & System Documentation Center. Retrieved from https://reference.wolfram.com/language/ref/DiscretePlot3D.html