Graphics
✖
Graphics
Details and Options
- Graphics is displayed in StandardForm as a graphical image. In InputForm, it is displayed as an explicit list of primitives.
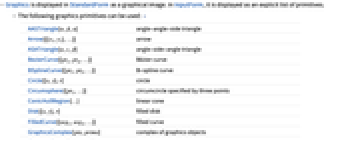
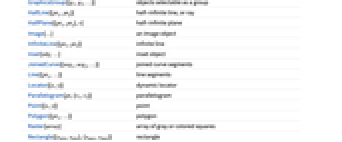
- The following graphics primitives can be used: »
-
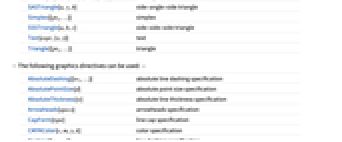
AASTriangle[α,β,a] angle-angle-side triangle Arrow[{{x1,y1},…}] arrow ASATriangle[α,c,β] angle-side-angle triangle BezierCurve[{pt1,pt2,…}] Bézier curve BSplineCurve[{pt1,pt2,…}] B-spline curve Circle[{x,y},r] circle Circumsphere[{pt1,…}] circumcircle specified by three points ConicHullRegion[…] linear cone Disk[{x,y},r] filled disk FilledCurve[{seg1,seg2,…}] filled curve GraphicsComplex[pts,prims] complex of graphics objects GraphicsGroup[{g1,g2,…}] objects selectable as a group HalfLine[{pt1,pt2}] half-infinite line, or ray HalfPlane[{pt1,pt2},v] half-infinite plane Image[…] an image object InfiniteLine[{pt1,pt2}] infinite line Inset[obj,…] inset object JoinedCurve[{seg1,seg2,…}] joined curve segments Line[{pt1,…}] line segments Locator[{x,y}] dynamic locator Parallelogram[pt,{v1,v2}] parallelogram Point[{x,y}] point Polygon[{pt1,…}] polygon Raster[array] array of gray or colored squares Rectangle[{xmin,ymin},{xmax,ymax}] rectangle SASTriangle[a,γ,b] side-angle-side triangle Simplex[{pt1,…}] simplex SSSTriangle[a,b,c] side-side-side triangle Text[expr,{x,y}] text Triangle[{pt1,…}] triangle - The following graphics directives can be used: »
-
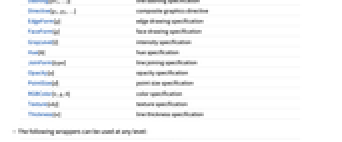
AbsoluteDashing[{w1,…}] absolute line dashing specification AbsolutePointSize[d] absolute point size specification AbsoluteThickness[w] absolute line thickness specification Arrowheads[specs] arrowheads specification CapForm[type] line cap specification CMYKColor[c,m,y,k] color specification Dashing[{w1,…}] line dashing specification Directive[g1,g2,…] composite graphics directive EdgeForm[g] edge drawing specification FaceForm[g] face drawing specification GrayLevel[i] intensity specification Hue[h] hue specification JoinForm[type] line joining specification Opacity[a] opacity specification PointSize[d] point size specification RGBColor[r,g,b] color specification Texture[obj] texture specification Thickness[w] line thickness specification - The following wrappers can be used at any level:
-
Annotation[obj,label] give an annotation Button[obj,action] make obj act as a button Dynamic[obj] use the dynamically updated current value EventHandler[obj,…] attach an event handler Hyperlink[obj,URI] make obj a hyperlink Mouseover[obj,over] specify a mouseover form PopupWindow[obj,cont] attach a popup window StatusArea[obj,label] specify a label to appear in the status area Style[obj,opts] specify a style Tooltip[obj,label] attach a tooltip - The following options can be given:
-
AlignmentPoint Center the default point in the graphic to align with AspectRatio Automatic ratio of height to width Axes False whether to draw axes AxesLabel None axes labels AxesOrigin Automatic where axes should cross AxesStyle {} style specifications for the axes Background None background color for the plot BaselinePosition Automatic how to align with a surrounding text baseline BaseStyle {} base style specifications for the graphic ContentSelectable Automatic whether to allow contents to be selected CoordinatesToolOptions Automatic detailed behavior of the coordinates tool Epilog {} primitives rendered after the main plot FormatType TraditionalForm the default format type for text Frame False whether to put a frame around the plot FrameLabel None frame labels FrameStyle {} style specifications for the frame FrameTicks Automatic frame ticks FrameTicksStyle {} style specifications for frame ticks GridLines None grid lines to draw GridLinesStyle {} style specifications for grid lines ImageMargins 0. the margins to leave around the graphic ImagePadding All what extra padding to allow for labels etc. ImageSize Automatic the absolute size at which to render the graphic LabelStyle {} style specifications for labels Method Automatic details of graphics methods to use PlotLabel None an overall label for the plot PlotRange All range of values to include PlotRangeClipping False whether to clip at the plot range PlotRangePadding Automatic how much to pad the range of values PlotRegion Automatic the final display region to be filled PreserveImageOptions Automatic whether to preserve image options when displaying new versions of the same graphic Prolog {} primitives rendered before the main plot RotateLabel True whether to rotate y labels on the frame Ticks Automatic axes ticks TicksStyle {} style specifications for axes ticks - Nested lists of graphics constructs can be given. Directive specifications such as GrayLevel remain in effect only until the end of the list that contains them. »
- Style[obj,opts] can be used to apply the options or directives opts to obj. »
- The following Method options can be given:
-
"AxesInFront" True whether to draw axes on top of primitives "FrameInFront" True whether to draw the graphics frame on top of primitives "GridLinesInFront" False whether to draw grid lines on top of primitives "TransparentPolygonMesh" False whether bordering polygons should be carefully drawn to avoid double rendering edges - The settings for BaseStyle are appended to the default style typically given by the "Graphics" style in the current stylesheet. The settings for AxesStyle, LabelStyle, etc. are appended to the default styles given for "GraphicsAxes", "GraphicsLabel", etc.
- Graphics[] gives an empty graphic with the default image size.
Examples
open allclose allBasic Examples (2)Summary of the most common use cases
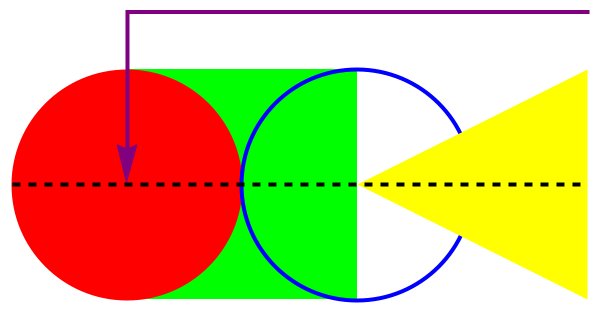
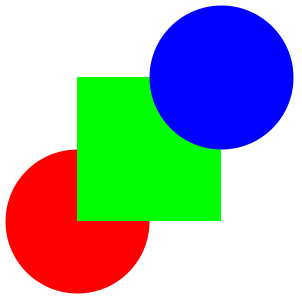
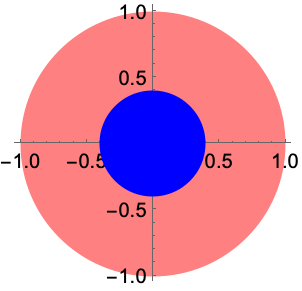
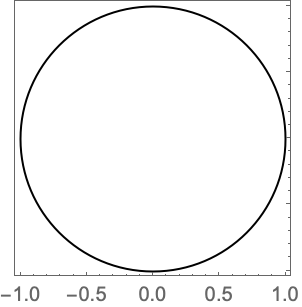
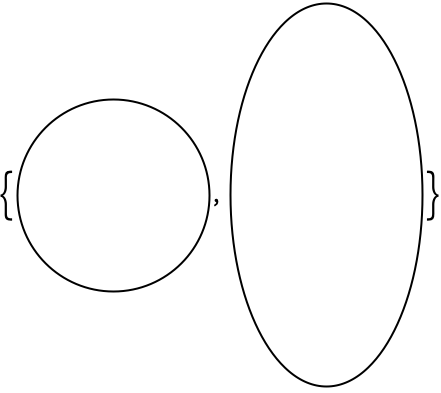
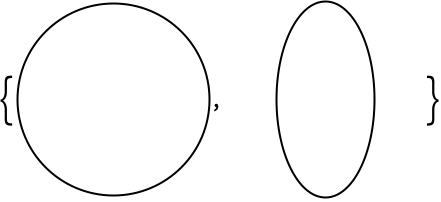
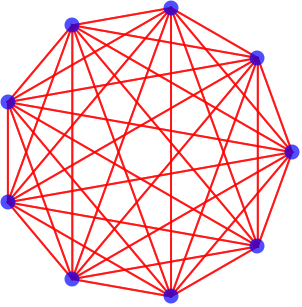
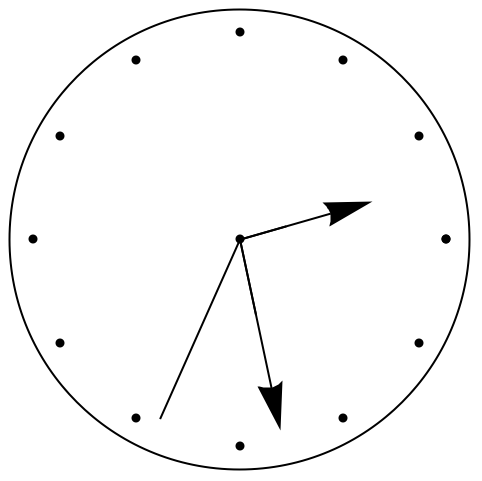
Use lines, polygons, circles, etc. to build up a graphics image:

https://wolfram.com/xid/0deklu-gxy3mp
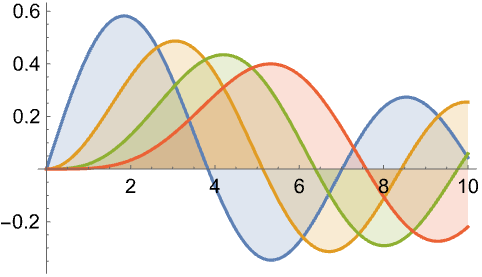
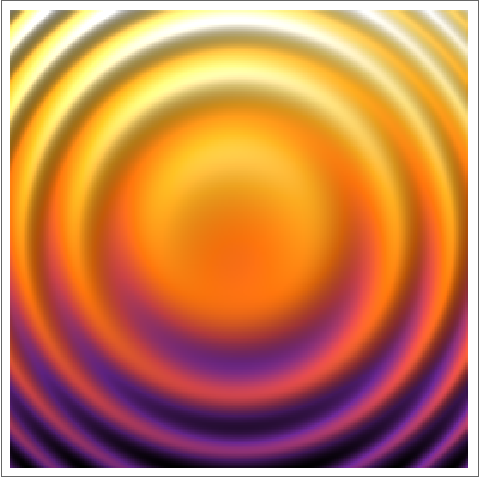
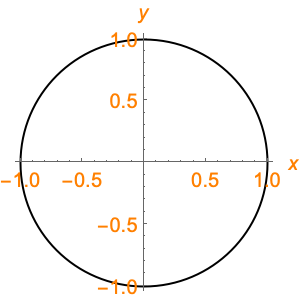
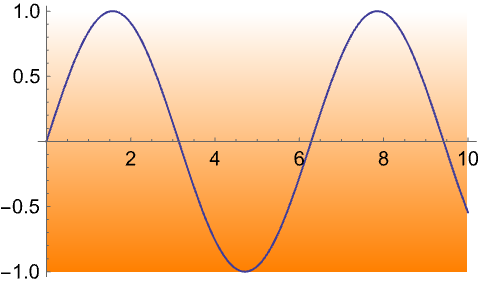
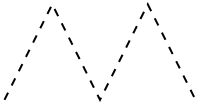
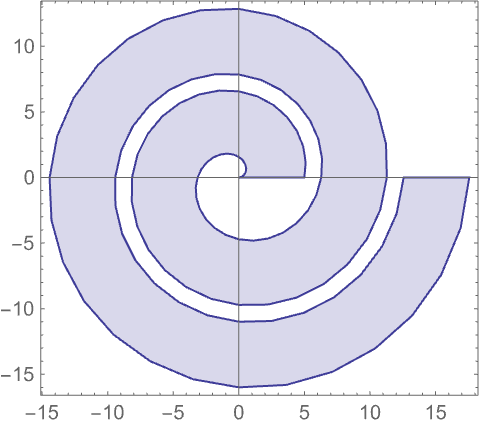
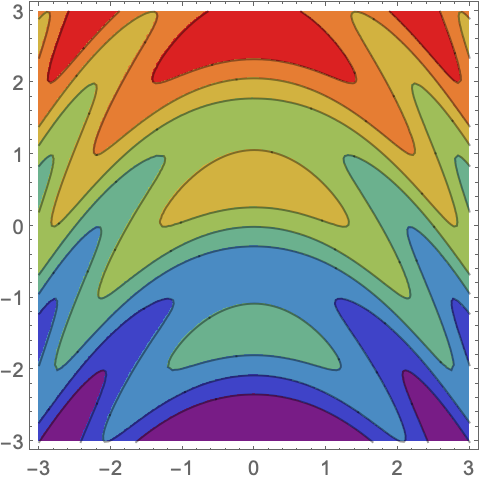
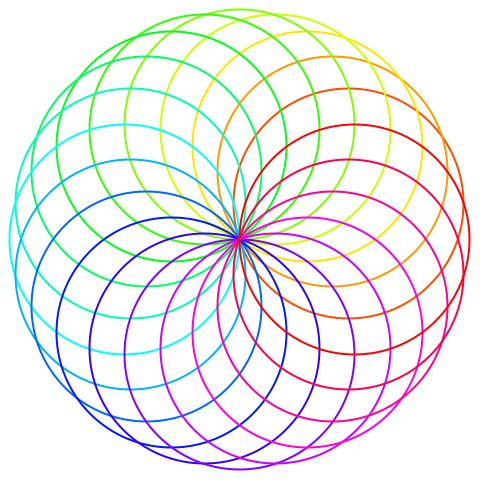
Use plot functions to automatically create Graphics from different types of data:
https://wolfram.com/xid/0deklu-e0lou8
https://wolfram.com/xid/0deklu-9ax56
https://wolfram.com/xid/0deklu-ea2iq8
Scope (13)Survey of the scope of standard use cases
Primitives (4)
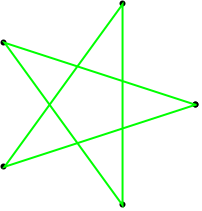
Graphics primitives are drawn in the order in which they are given in Graphics:
https://wolfram.com/xid/0deklu-d7aplj
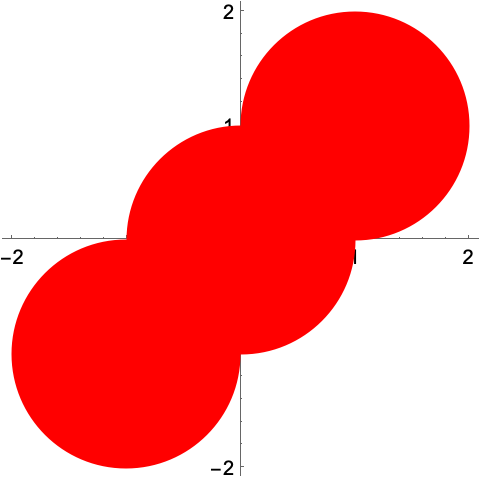
Polygons can fold over themselves:
https://wolfram.com/xid/0deklu-i4e0x6

Vertices can be shared by using GraphicsComplex:
https://wolfram.com/xid/0deklu-i6kd75
https://wolfram.com/xid/0deklu-sjayl
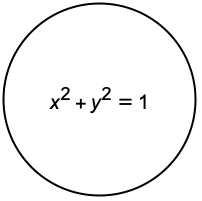
Inset an expression in a graphic:
https://wolfram.com/xid/0deklu-biynaa
Directives (5)
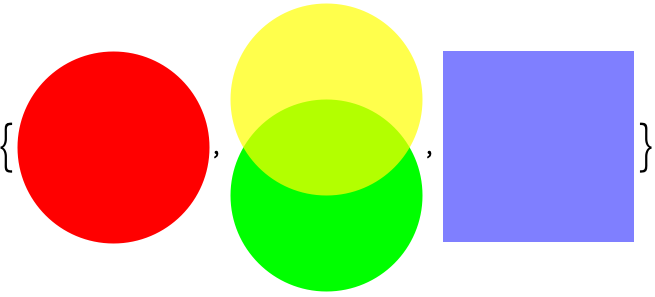
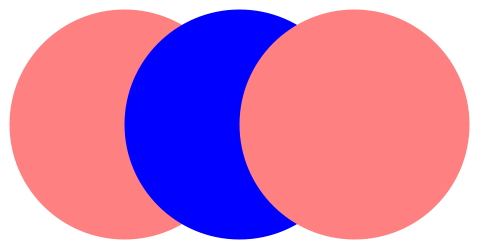
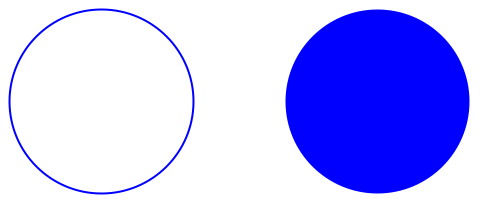
Directives can specify color and opacity of faces:
https://wolfram.com/xid/0deklu-dcq9jm
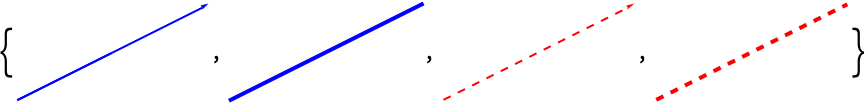
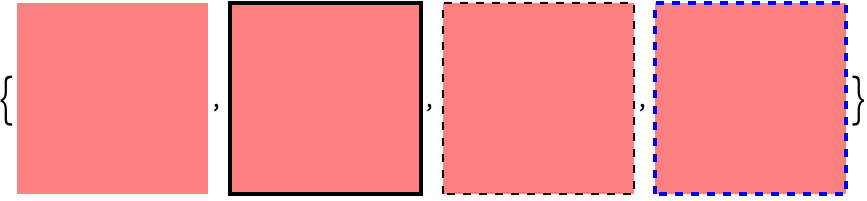
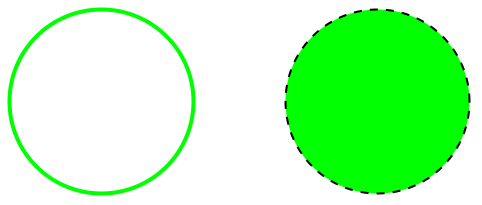
Colors, thickness, and dashing directives affect lines, arrows, and edges:

https://wolfram.com/xid/0deklu-bllppn

https://wolfram.com/xid/0deklu-b8ajtv
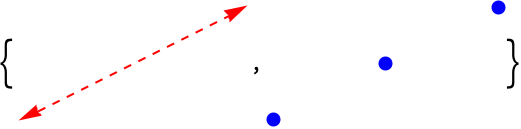
Some primitives have special directives to specify various properties:
https://wolfram.com/xid/0deklu-chqwj9
Directives can be applied to individual objects using Style:
https://wolfram.com/xid/0deklu-duwrkd

Graphics directives remain in effect only until the end of the list that contains them:
https://wolfram.com/xid/0deklu-cab7d8
Coordinates (4)
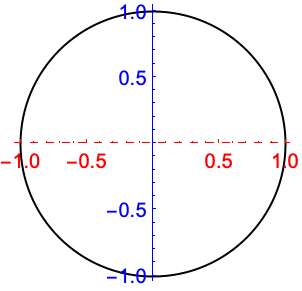
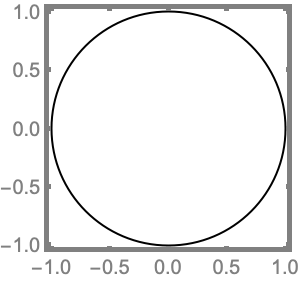
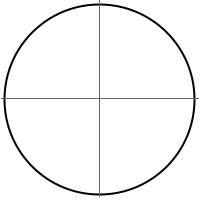
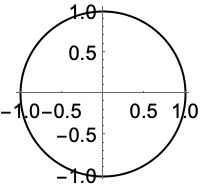
Use an ordinary coordinate system:
https://wolfram.com/xid/0deklu-jbzrgk
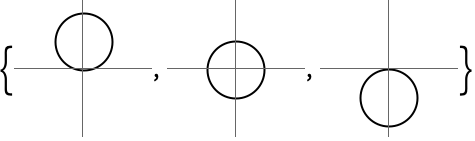
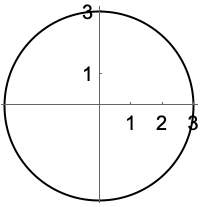
Specify coordinates by fractions of the plot range:
https://wolfram.com/xid/0deklu-gl9t6b

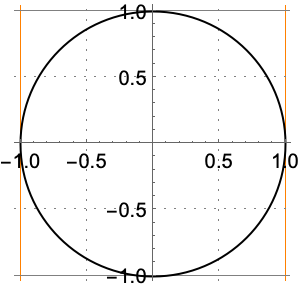
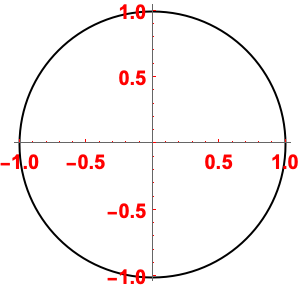
Specify coordinates by fractions of the whole image:
https://wolfram.com/xid/0deklu-jkk8qf
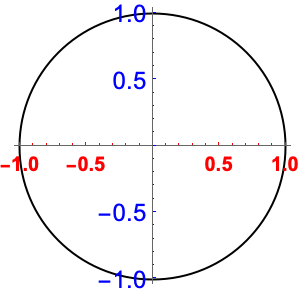
Offset coordinates by printer's points:
https://wolfram.com/xid/0deklu-btyiww
Options (71)Common values & functionality for each option
AlignmentPoint (1)
Specify the coordinates within Inset to be aligned with the center of the enclosing graphic:

https://wolfram.com/xid/0deklu-cq7kj7

https://wolfram.com/xid/0deklu-f9erz9
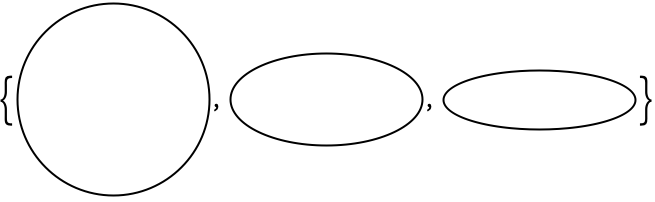
AspectRatio (1)
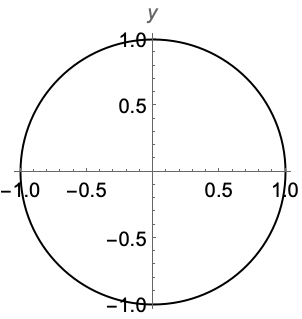
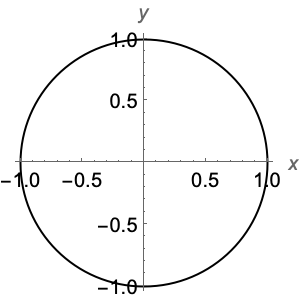
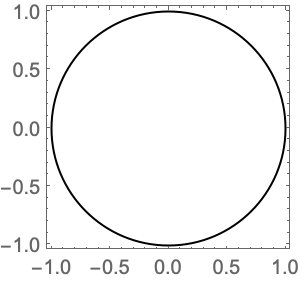
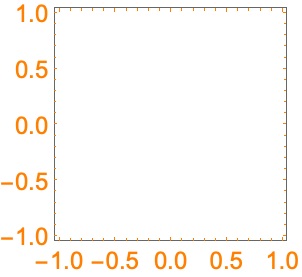
Axes (2)

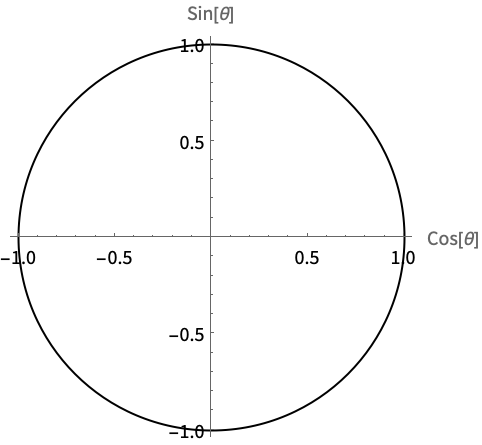
AxesLabel (2)
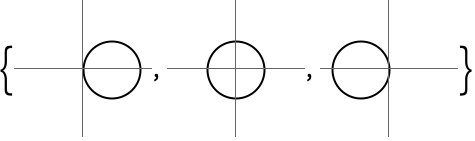
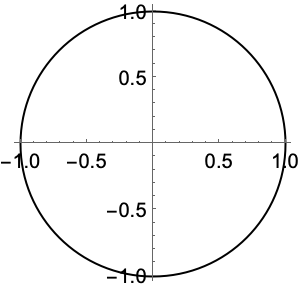
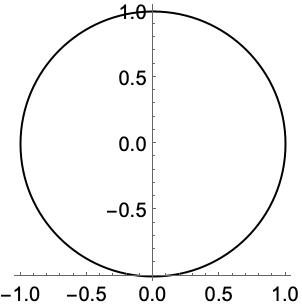
AxesOrigin (2)
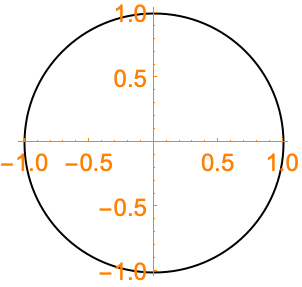
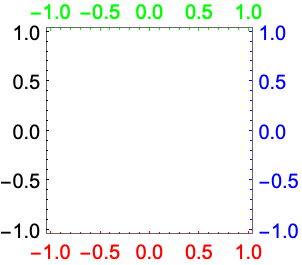
AxesStyle (1)
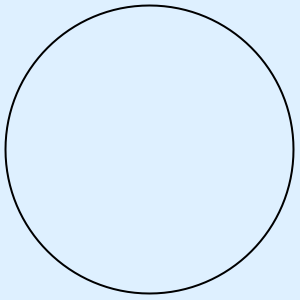
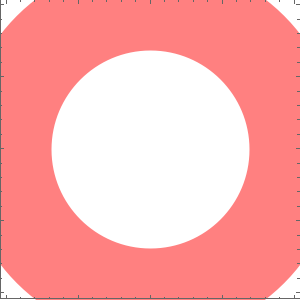
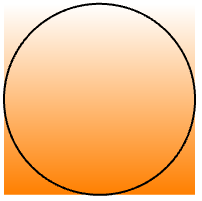
Background (1)
BaselinePosition (3)
Align the center of a graphic with the baseline of the text:
https://wolfram.com/xid/0deklu-bgqy4a
Specify the baseline of a graphic as a fraction of the height by using Scaled:
https://wolfram.com/xid/0deklu-dlh30h
Use the axis of a graphic as the baseline:
https://wolfram.com/xid/0deklu-dqmnv1
https://wolfram.com/xid/0deklu-j5kexy
BaseStyle (2)
ContentSelectable (3)
Allow the individual graphics objects to be selectable by a single click:
https://wolfram.com/xid/0deklu-fugd5

No individual object is selectable; the whole graphic appears as one object:
https://wolfram.com/xid/0deklu-l25cix

The first click selects the whole graphic, and subsequent ones select individual objects:
https://wolfram.com/xid/0deklu-db8u7t

Epilog (1)
FormatType (3)
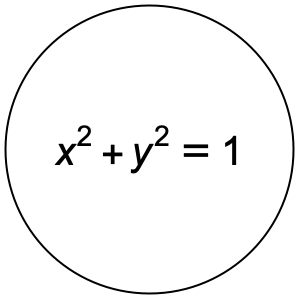
By default, expressions are displayed using TraditionalForm in graphics:
https://wolfram.com/xid/0deklu-vclm1
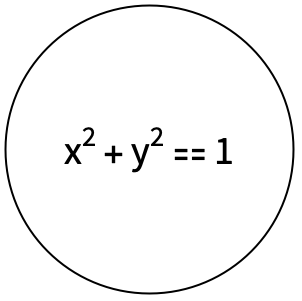
Display expressions using StandardForm:
https://wolfram.com/xid/0deklu-nmmm8
Labels are also affected by FormatType setting:
https://wolfram.com/xid/0deklu-98clt
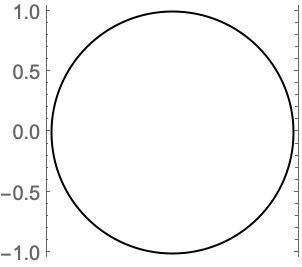
Frame (2)
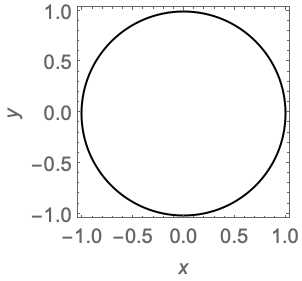
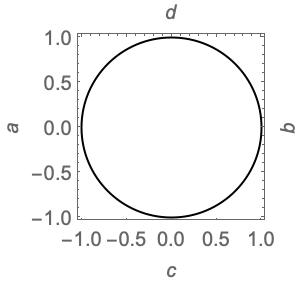
FrameLabel (1)
FrameStyle (2)
FrameTicks (2)

FrameTicksStyle (2)
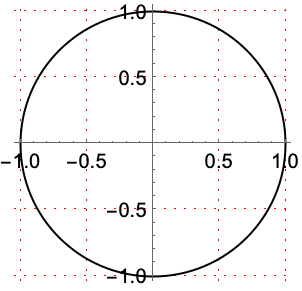
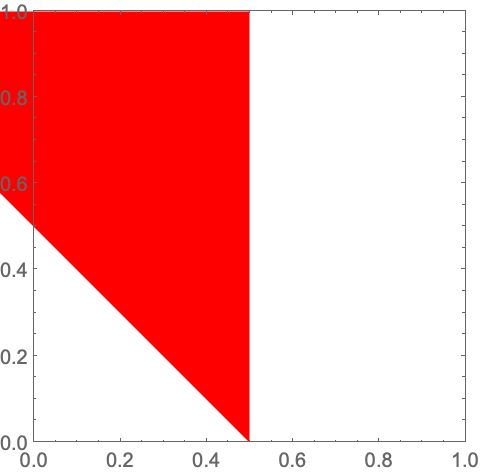
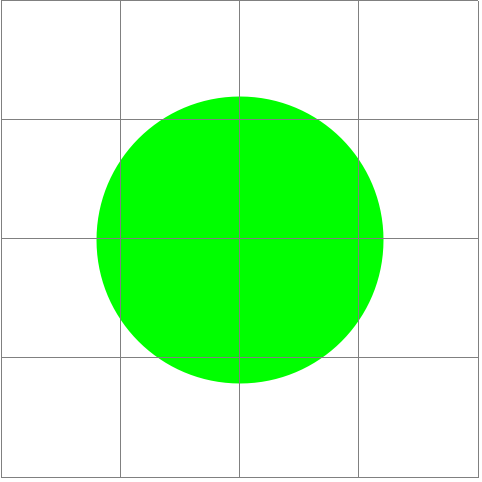
GridLines (3)
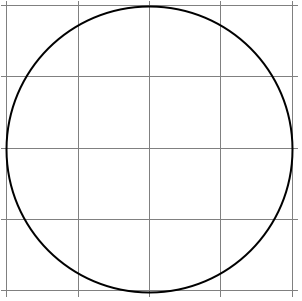

GridLinesStyle (1)
ImageMargins (3)
Allow no margins outside of ImageSize:
https://wolfram.com/xid/0deklu-9wl9y

Have 20-point margins on all sides:
https://wolfram.com/xid/0deklu-h0kse3

Leave different margins on each side:
https://wolfram.com/xid/0deklu-od6xz3
ImagePadding (4)
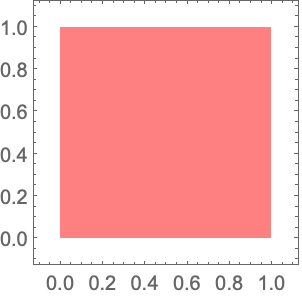
Leave no padding outside of the plot range:
https://wolfram.com/xid/0deklu-cpqt0r
Leave enough padding for all objects and labels that are present:
https://wolfram.com/xid/0deklu-estjoe
Specify the same padding for all sides in printer's points:
https://wolfram.com/xid/0deklu-b18wdc
Specify different padding on each side:
https://wolfram.com/xid/0deklu-h1j0ij
ImageSize (3)
LabelStyle (1)
Method (4)
"AxesInFront" (1)
"FrameInFront" (1)

"GridLinesInFront" (1)
"TransparentPolygonMesh" (1)


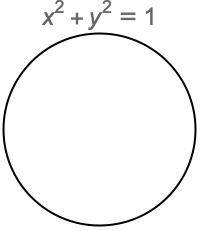
PlotLabel (2)
Display a label on the top of the graphic in TraditionalForm:
https://wolfram.com/xid/0deklu-cdsmwg
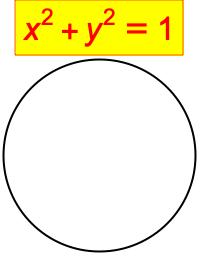
Use Style and other typesetting functions to modify how the label appears:
https://wolfram.com/xid/0deklu-cibwdq
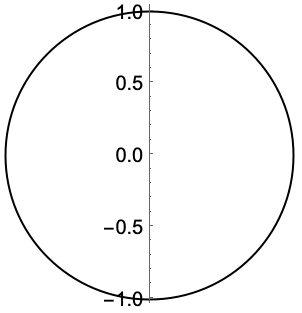
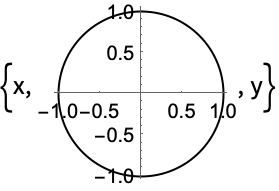
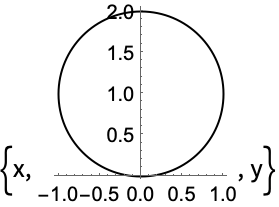
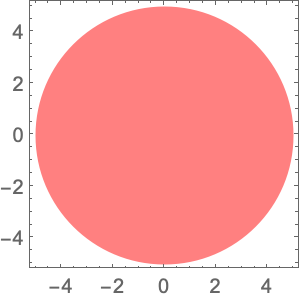
PlotRange (3)
https://wolfram.com/xid/0deklu-cta80u
https://wolfram.com/xid/0deklu-ut7dl
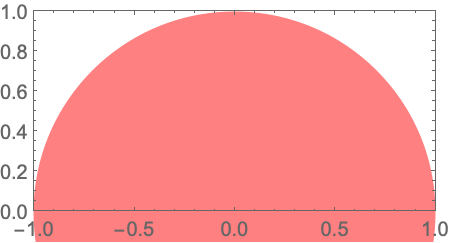
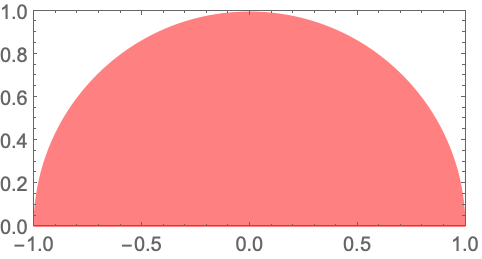
Force clipping at the PlotRange:
https://wolfram.com/xid/0deklu-eqqd1k
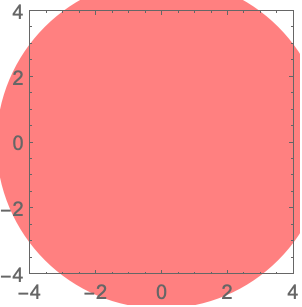
PlotRange->s is equivalent to PlotRange->{{-s,s},{-s,s}}:
https://wolfram.com/xid/0deklu-gqr9qw
PlotRangeClipping (2)

PlotRangePadding (3)
Include ![]() coordinate unit of padding on all sides:
coordinate unit of padding on all sides:
https://wolfram.com/xid/0deklu-hd3t9k
Include padding using Scaled coordinates:
https://wolfram.com/xid/0deklu-fqkj7j
Specify different padding on each side:
https://wolfram.com/xid/0deklu-gudwa
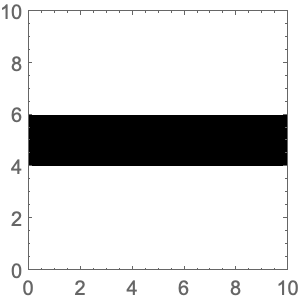
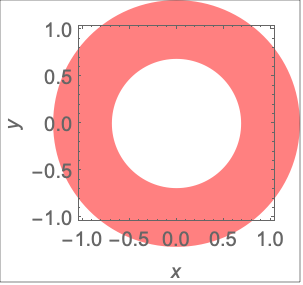
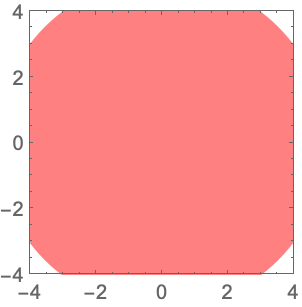
PlotRegion (3)
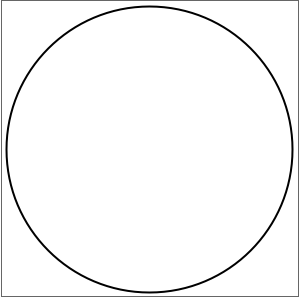
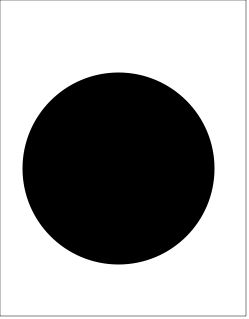
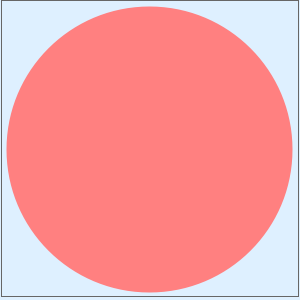
The contents of a graphic use the whole region:
https://wolfram.com/xid/0deklu-o68js1
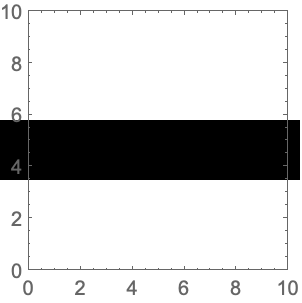
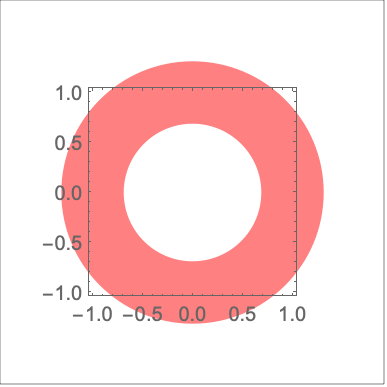
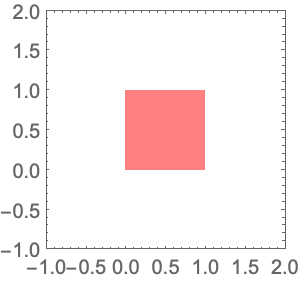
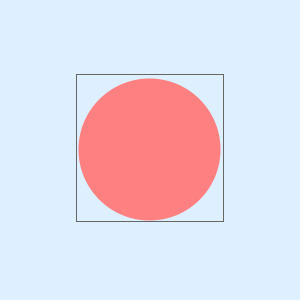
Limit the contents of the graphic to the middle half of the region in each direction:
https://wolfram.com/xid/0deklu-ywwlz9
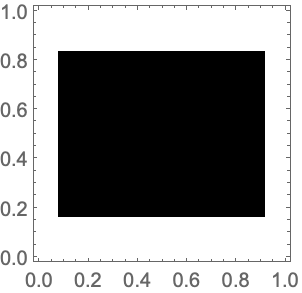
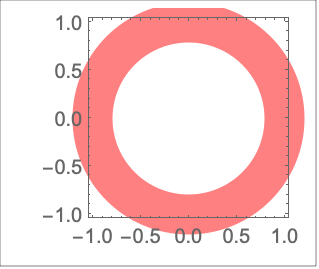
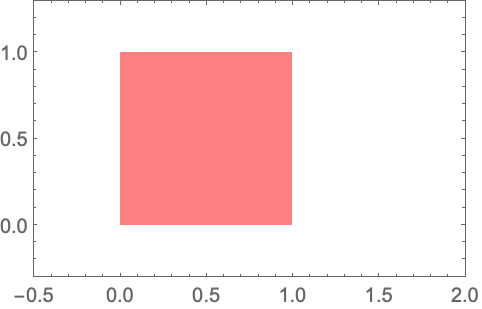
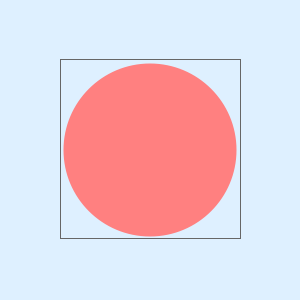
ImagePadding can also be used to add padding around a graphic:
https://wolfram.com/xid/0deklu-oxpwrr
Prolog (1)
RotateLabel (2)
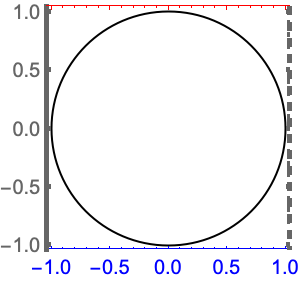
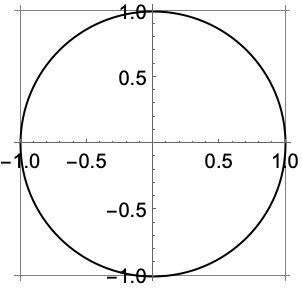
Ticks (3)
Applications (1)Sample problems that can be solved with this function
Properties & Relations (5)Properties of the function, and connections to other functions
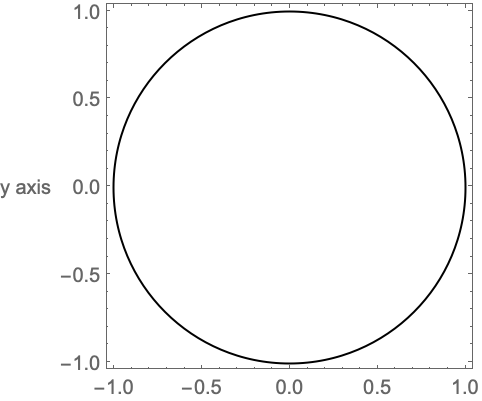
The StandardForm of Graphics is its rendered form:
https://wolfram.com/xid/0deklu-ctg9cq

The InputForm is the textual expression form:
https://wolfram.com/xid/0deklu-esx4un
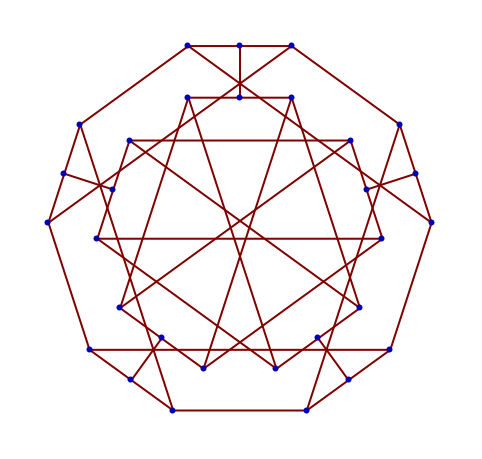
Graphics can be used as input to functions:
https://wolfram.com/xid/0deklu-i4632z

https://wolfram.com/xid/0deklu-gbe1v9
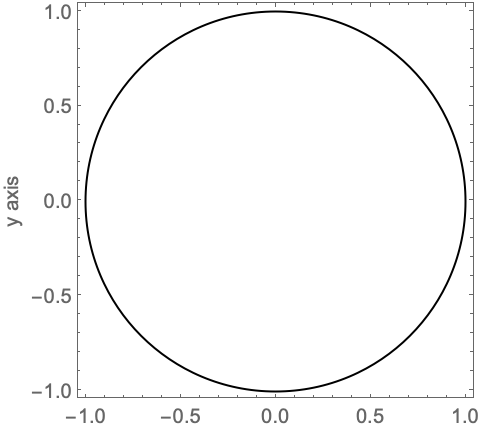
Two-dimensional plot functions return Graphics:
https://wolfram.com/xid/0deklu-c4dgtj
https://wolfram.com/xid/0deklu-h0avy
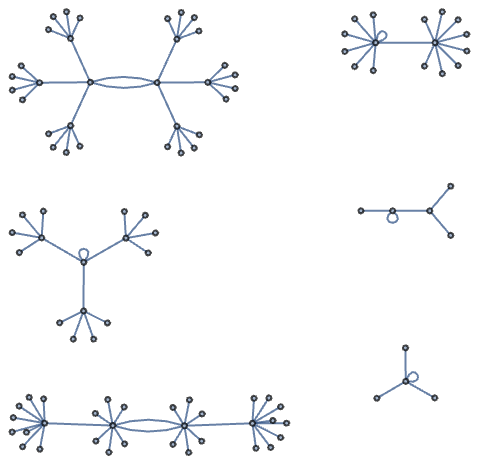
Several integrated data sources return Graphics:
https://wolfram.com/xid/0deklu-gps57a
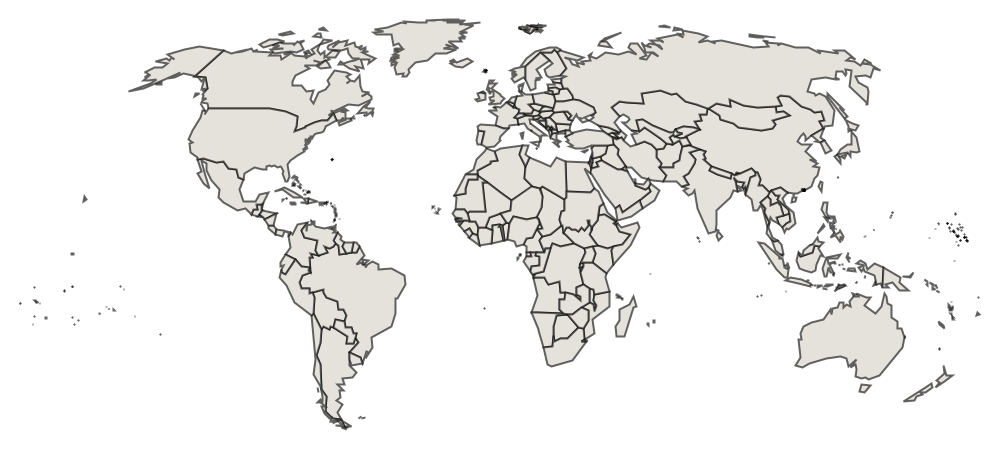
https://wolfram.com/xid/0deklu-gxek4w
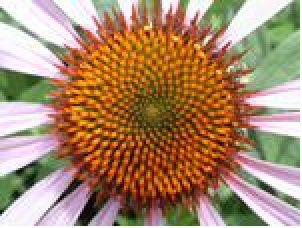
Many Import and Export formats support Graphics:
https://wolfram.com/xid/0deklu-j7p8om

https://wolfram.com/xid/0deklu-m3cilw
Wolfram Research (1988), Graphics, Wolfram Language function, https://reference.wolfram.com/language/ref/Graphics.html (updated 2022).Text
Wolfram Research (1988), Graphics, Wolfram Language function, https://reference.wolfram.com/language/ref/Graphics.html (updated 2022).
Wolfram Research (1988), Graphics, Wolfram Language function, https://reference.wolfram.com/language/ref/Graphics.html (updated 2022).CMS
Wolfram Language. 1988. "Graphics." Wolfram Language & System Documentation Center. Wolfram Research. Last Modified 2022. https://reference.wolfram.com/language/ref/Graphics.html.
Wolfram Language. 1988. "Graphics." Wolfram Language & System Documentation Center. Wolfram Research. Last Modified 2022. https://reference.wolfram.com/language/ref/Graphics.html.APA
Wolfram Language. (1988). Graphics. Wolfram Language & System Documentation Center. Retrieved from https://reference.wolfram.com/language/ref/Graphics.html
Wolfram Language. (1988). Graphics. Wolfram Language & System Documentation Center. Retrieved from https://reference.wolfram.com/language/ref/Graphics.htmlBibTeX
@misc{reference.wolfram_2025_graphics, author="Wolfram Research", title="{Graphics}", year="2022", howpublished="\url{https://reference.wolfram.com/language/ref/Graphics.html}", note=[Accessed: 01-April-2025
]}
BibLaTeX
@online{reference.wolfram_2025_graphics, organization={Wolfram Research}, title={Graphics}, year={2022}, url={https://reference.wolfram.com/language/ref/Graphics.html}, note=[Accessed: 01-April-2025
]}